Performance Evaluation of Automotive Engines
Info: 8971 words (36 pages) Dissertation
Published: 9th Dec 2019
Tagged: EngineeringMechanics
Performance indicatorsEngine Performance
Task 1 – Single cylinder model
Task 2 – 2 litre naturally aspirated gasoline engine model
Cam duration, lift and phasing
Exhaust Valve Opening Timing modification – EVO
Exhaust Valve Closing Timing modification – EVC
Intake Valve Opening Timing modification – IVO
Intake Valve Closing Timing modification – IVC
Task 3 – 1.4 litre turbocharged gasoline engine model.
Task 4 – Comparison of powertrain alternatives on a hillclimb course.
Figure 1: Performance figures single piston
Figure 2: Naturally aspirated inline 4 model
Figure 3:Valve-timing diagrams (a) medium-performance engine, (b) high-performance engine
Figure 4: Naturally aspirated engine results
Figure 5: Turbocharged 1400 cc engine model
Figure 6: Fuel injected per cylinder
Figure 7: Turbo characterization
Figure 8: Intercooler / Turbo with pressure and temperatures diagram
Figure 9: Turbocharged engine results
Figure 10: Turbocharged engine BMEP
Figure 11: Hillclimb calculation flow
Figure 12: Resistant Curve calculation
Figure 13: Input of vehicle parameters and gear ratios
Figure 14: Gear ratio to polynomial curve and acceleration calculation
Figure 15: Perfect drive configurations
Figure 16: Hillclimb performance comparison
Figure 17: (Speed – Distance – Time) Hillclimb comparison
Table 1: Single piston engine configuration
Table 2: N/A Intake dimensions
Table 3: N/A Exhaust dimensions
Table 4: 2000 cc engine benchmarking
Table 5: Turbocharged cylinder configuration
Table 6: Turbocharged Intake dimensions
Table 7: Turbocharged Exhaust dimensions
Table 8: 1400 cc turbo engine benchmarking
Table 9: Battery energy caclulation
Table 10: Battery characteristics
Table 11: Perfect drive (gearbox vs direct drive)
Engine Performance
Performance evaluation of automotive engines is of great importance for their economic operation. The method or criteria for assessing the engine performance include the determination of engine power and torque, considering the engine stroke, engine speed, mean effective pressure and bore- all of these affect the horsepower, and its performance, and if possible, with efficiency, which means obtaining the greatest possible power with lowest possible fuel consumption.
Performance indicators
Common engine performance indicators include:
- Power (kW): The measure of how much torque can be done in a specified time.
- Torque (Nm): Engine’s rotational force, correlates with vehicle driveability
- Mean effective pressure (bar): permits the comparison of torque output per unit displacement
- Brake specific fuel consumption (g/kWhr): The mass of fuel in grams consumed per kWhr of power produced at a particular engine speed and load. The lower the fuel consumption, the less fuel has to be carried at any given point in a competition.
- Operating compression pressure.
- Ignition timing.
- Valves timing.
- Fuel mixture adjustment.
- Mechanical conditions.
- Pistons’ rings and cylinders condition.
- Bearings properly maintained.
- Lubrication.
Main objectives
The objectives of this study are:
- Study engine size by configuration of bore, stroke, displacement and compression ratio.
- Measurement of power and torque along the engine speed range.
- Method of air induction.
- Evaluating the efficiency based on mechanical efficiency and thermal efficiency, considering the energy supplied to the engine and the energy delivered by the engine.
- Measurement of fuel consumption.
Order of objectives
Intake
As the air flows into the engine and it is mixed with fuel and burned to make power. Fewer restrictions will allow an engine to make more power. Restrictions slow the air down before it reaches the engine, and reduce the amount of air at any given point in time.
Timing
The mechanism that manages intake of air and the release of exhaust. By using different valve timing at different RPM, the engine can work better in a variety of different conditions. Modifications that increase performance by tuning the way the engine performs in different conditions. Systems like VTEC system (Variable Timing Electronic Control) change the timing of the valves according to the speed engine in order to provide optimum valve performance to increase final power.
Compression
The compression ratio of the engine refers to how much the pistons compress the air that comes into the cylinders. High performance cars tend to have higher compression ratios. This allows the car to produce more power, but the downside of this is that cars with higher compression ratios usually require higher-octane fuel
Exhaust
The final step. Like the intake, reducing restriction in the exhaust almost always results in more power. High performance vehicles optimize the exhaust flow to have as little backpressure as possible. This allows the engine to expel the waste fumes as quickly as possible so it can burn more fuel faster.
Engine assumptions
Effective blow by gap: For each engine, a value of 0.001 mm has been chosen for each cylinder so a some pressure is lost at the combustion chamber through the piston ring but without losing more than 5% of the performance.
All parallel pipes have the same distance and diameter.
To find the values for piping and ratios, a process of iteration until converging has been used to run the different parameters into excel tables.
All caculations have been achieved with Matthew Harrison notes.
Task 1 – Single cylinder model
This first simulation runs a 500cc single cylinder engine with a range from 3000 to 7000 RPM.
 |
Engine performance indicators required:
|
The engine is a 4 stroke normally aspirated with a peak power of 60 HP and 60 Nm at 7000 RPM.
With this engine the most significant changes in order to define the peak power at high RPM it is to provide maximum torque at high speed,
Figure 1Table 1.
Table 1: Single piston engine configuration
| Bore | 86 mm |
| Stroke | 86 mm |
| Displacement | 500 cc |
| Air/Fuel Ratio | 13 |
| Compression Ratio | 14.5 |
| Valve diameter Intake | 35 mm |
| Valve diameter Exhaust | 30 mm |
| Valve clearance cold Intake | 0.12 mm |
| Valve clearance cold Exhaust | 0.12 mm |
It is important to achieve high flow rates through the engine by minimising the pressure loss caused by the ports / valves / combustion chamber. Also is important to have bigger pipes than the inlet and exhaust valve diameters, preferably with a conic so the transition is smooth and ther are not backpressure waves that worsen the performance.
Short wide inlet pipes move the torque curve up the rev range whereas long, narrow pipes move the curve down the rev range. The effect is caused by waves of relatively high and low pressure in the pipes
The opening of an inlet valve causes low pressure at the engine end of the inlet pipe, as the engine sucks air out of the pipe. Air starts to flow down the pipe into the cylinder until the valve shuts, at which point all that air (travelling at high speed) crashes into the shut valve and creates a relatively high-pressure wave of air. This is reflected and starts to move back up the pipe until the valve opens again, at which point it heads back towards the port.
Well calculated sizes will allow the high-pressure wave through the port before the valve shuts again, when the next wave is created. The dimensions are critical to the operating speed of the engine. If the pipe is short, the reflected pulse might fall out of the end before the valve opens to suck it back in. If the pipe is too long, the larger mass of air may respond too slowly to perform well at high engine speeds. Adjustable or twin length inlet manifolds, which change the dimensions of the inlet pipes at a certain RPM to give upgraded torque across the engine’s speed range would be a considerable improvement.
In order to improve performance at high revs, fuel ratio is decreased and spark advance is increased in order to provide faster and bigger burnt of the fuel, with less fuel the cylinder doesn’t cool down so providing the Stoichiometric A/F ratio (the correct amount of air and fuel to produce a chemically complete combustion event) it is necessary. Leaner A/F ratios results in higher temperatures as the mixture is combusted. Naturally aspirated engines produce maximum power just slightly rich of stoichiometric. However, in practice it is kept between 12:1 and 13:1 in order to keep exhaust gas temperatures in check and to account for variances in fuel quality.
 |
 |
 |
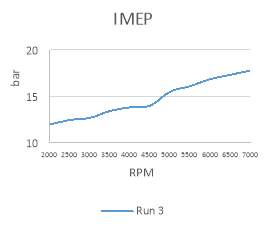 |
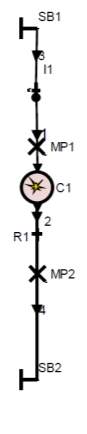
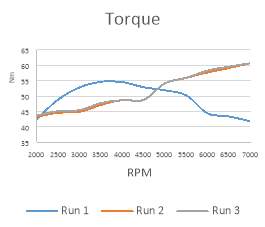
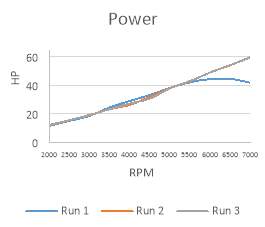
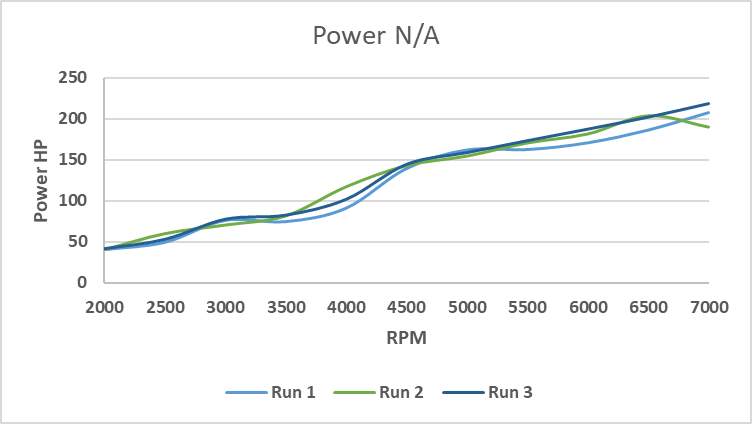
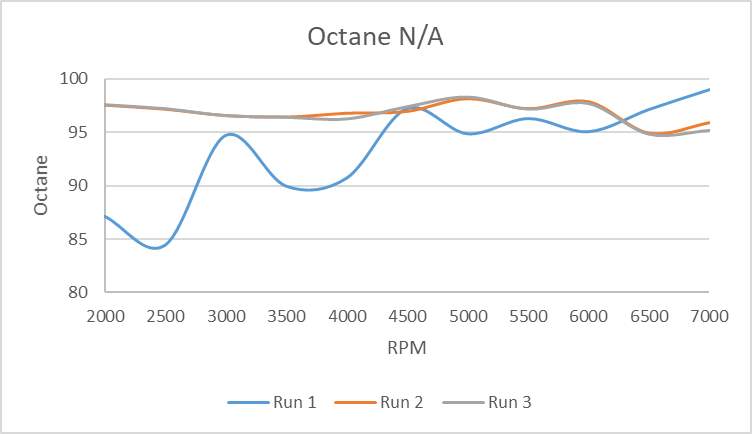
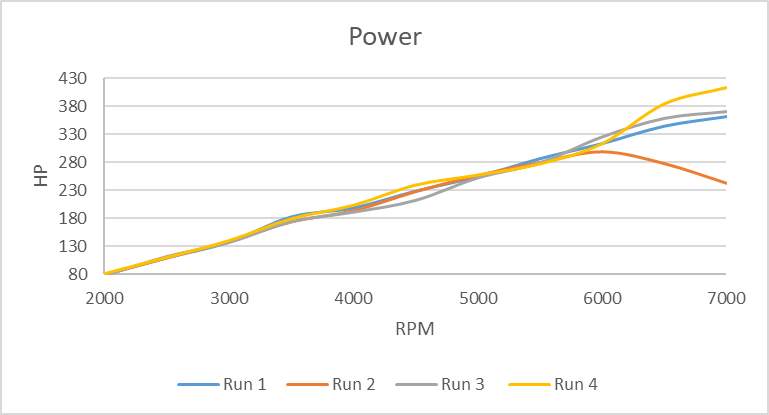
Figure 1: Performance figures single piston
As can be seen in
Figure 1 torque curve Run 3, with a wide and short runner (40x200mm) we achieve maximum torque at high speed providing more power at the top. Increasing volumetric efficiency at the same time A/F ratio is a little reduce as RPM increase.
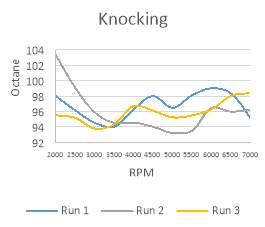
At each point the knocking must be avoided as mixture explode outside the envelope of the normal combustion front, so for standard fuel, octane number should not be over 98.
As long as the rpm increases the valve overlap increases as the process of moving air needs to happen faster, the exhaust valve its still open while the inlet valve opens helping to suck the fresh air inside the cylinder. Also spark is advanced while RPM increases
Compared with 2017 motocross 4T engines, inlet runners and exhaust have nearly no variation between theme from a range of 38 to 41 mm and 180 to 230 mm length. For 34mm inlet valve and 30mm exhaust. Even though their the modelled engine has higher performance at 7000 rpm due to its higher compression ratio but with more engine speed, more power could be achieved as motocross engines try
Task 2 – 2 litre naturally aspirated gasoline engine model
Engine
This model engine is an inline 4 cylinder, 2000cc naturally aspirated, Figure 2.
It keeps the same displacement per cylinder as the single cylinder model and not many changes are provided to the cylinder geometry, major differences are found in the engine breathing as more piston take part of the combustion.
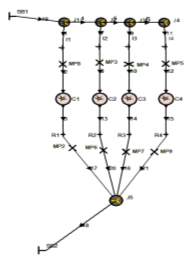
Figure 2: Naturally aspirated inline 4 model
Balance
Inline-four is a type of engine that is in primary balance because the pistons are moving in pairs, and one pair of pistons is always moving up at the same time as the other pair is moving down. However, piston acceleration and deceleration is greater in the top half of the crankshaft rotation. Which leads to a secondary imbalance that origins an up-and-down vibration at twice crankshaft speed.
Most inline-four engines below 2.0 L in displacement rely on the damping effect of their engine mounts to reduce the vibrations to acceptable levels. Above 2.0 L, most modern inline-four engines now use balance shafts to eliminate the secondary vibrations.
Firing order
The firing order is the sequence of power delivery of each cylinder in a multi-cylinder reciprocating engine. That in this case with a flat plane crankshaft has a 1-3-4-2 firing order meaning an explosion every 180º of crankshaft rotation.
Intake
The idea behind these products is that the lower the resistance to airflow into the engine, the more air (oxygen) will enter the engine. This can also be described as an increase in volumetric efficiency. The more air that enters the engine, the more fuel can be burned. This will increase a vehicles maximum power output. When the throttle is not fully open, the throttle plate is restricting airflow into the engine .No matter how much the airflow is decreased before the throttle plate, airflow is still at the mercy of the throttle plate. The throttle plate is there because an engine will pull in more air than it needs or can handle, if it is allowed to at lower RPM. The only time an engine will struggle for air is at wide open throttle and high engine RPM. This is where “a little more airflow” may be of some benefit. The biggest performance difference will be an increase in throttle response
The intake manifold is the last piece of the intake system that air travels through before the intake port. Its main purpose is to provide equal amounts of air to each cylinder but it also provides a vacuum source for the power brakes and anything else that uses vacuum. One important factor in intake manifold design is runner length. Long and/or skinny intake runners increase air speed into the engine which causes the air and fuel to mix better and produce torque at low-mid engine RPM. The faster an engine spins, the more air it needs. At high engine RPM, air will already be moving very quickly into the engine. Air speed is not as much of a concern as air volume in the high RPM range. To get the best intake air volume and high RPM horsepower, wide and/or short intake runners are best. On a multiport injection system, the fuel injectors are seated in the lower section of the intake manifold and they spray fuel into the intake port.
Caclulated lengths and widths are shown in Table 2.
Table 2: N/A Intake dimensions
| Intake Section 1 Length | 400 mm |
| Intake Section 1 Diameter | 45 mm |
| Reduction | 0.98 – |
| Intake Section 2 Length | 100 mm |
| Intake Section 2 Diameter | 43 mm |
| Intake Unification Length | 120 mm |
| Intake Unification Diameter | 70 mm |
Exhaust
There are two separate components to the exhaust event. The first is the removal of exhaust gasses from the cylinder, which occurs as a pulse of hot gas exiting the cylinder and flowing down the header primary tube. The second is the (much faster) travel of the pressure wave in the port caused by the pressure spike, which occurs when the exhaust valve opens as well as the multiple reflections of the wave. Taking proper advantage of these pressure waves (component two) can produce dramatic improvements in clearing the cylinder (component one) and can strongly assist the inflow of fresh charge.
When the exhaust valve first opens in a 4-stroke piston engine, the in-cylinder pressure is still well above atmospheric. In a normally aspirated spark ignition engine burning gasoline and operating at high BMEP, the pressure can be 7 bar or more, and the pressure in the exhaust port at the valve is somewhere near 1 bar (atmospheric). As the valve opens, the pressure differential across the rapidly changing valve aperture starts exhaust smoke flowing through the opening.
The pressure gradient and the cross-sectional determine the instantaneous velocity of the exhaust gas flow at any point. In the header, a smaller tube diameter will increase the velocity at a given RPM, which might enhance the pressure wave tuning (the second component) and can be beneficial with regard to inertia effects. However, if the diameter is too small, there will be flow losses and consequent pressure gradient increases, which can offset any tuning gains. Therefore, the selection of proper tubing diameters is an important part of the design.
Short 4-1 headers are conventionally used to obtain high torque at high rpm. However, they face such problems during scavenging as internal mixing of exhaust gases with the incoming fresh air/charge.
Consider a four-stroke engine, with a 1-3-4-2 firing order. When the exhaust manifold is short, the high pressure wave from the gas emerging immediately after cylinder No. 3’s exhaust valves open, for example, arrives at cylinder No.1 as it finishes its exhaust stroke and enters its intake stroke. As a result, exhaust gas which has just moved out of the cylinder is forced back inside the combustion chamber, increasing the amount of hot residual gas. With a short exhaust manifold, the high pressure wave arrives at the next cylinder within a short amount of time, causing this adverse effect to continue from low to high engine speed. Hence, shorter length causes contamination and produces lesser power.
While in long 4-2-1 headers, exhaust gases get cooled on their way, because of the huge heat loss due to radiation, eventually delays the catalyst activation. Exhaust temperature can be increased by delaying ignition timing, but unstable combustion will result if delayed too much.
With these criteria, the dimensions for the exhaust are shown in Table 3.
Table 3: N/A Exhaust dimensions
| Configuration | 4-1 |
| Exhaust Section 1 Length | 300 mm |
| Exhaust Section 1 Diameter | 43 mm |
| Reduction | 0.98 – |
| Exhaust Section 2 Length | 100 mm |
| Exhaust Section 2 Diameter | 41 mm |
| Exhaust Unification Length | 100 mm |
| Exhaust Unification Diameter | 60 mm |
Ignition timing
Advancing the ignition timing means that the spark plug fires the air-fuel mixture in the cylinder earlier (measured in degrees Before Top Dead Centre). This gives an engine greater performance because it forces the piston in the cylinder back down harder after it has reached top dead centre (TDC) as the mixture was energized before. Combustion actually commences while the piston is on its upward movement. Consumption of the first 5-10% of the air-fuel mixture is generally considered as the flame development. During the flame development period, the spark plug fires and the combustion process starts, but very little pressure rise is observed. Almost all the useful work is produced in an engine cycle during the flame propagation period of the combustion process. During this period 80-90% of the air-fuel mass is burnt; the cylinder pressure is greatly increased which provides the force to produce work in the expansion stroke. The final 5-10% of the air-fuel mass which burns is classified as flame termination. During this time, pressure drops and combustion is finally terminated.
The time it takes for the flame kernel at spark plug to expand to the top and sides of the chamber permits the piston to pass top dead centre before it receives the flame front. The expansion of the gasses during the period from ignition point (BTDC) to flame front reception (ATDC) increases the volume in the chamber and effectively creates higher compression.
For this reasons, ignition time is advanced from -5 to -11 degrees these are not extreme offsets but as compression ratio is 13 more advance will produce the force to be applied while the piston is still moving up and providing counteracting force
Even if not severe, the two important abnormal combustion phenomena of major concern are
Knock: is the name given to the noise which is transmitted through the engine structure when essentially spontaneous ignition of a portion of the end gas. This is when the fuel, air, residual gas, mixture ahead of the propagating flame occurs.
When this process takes place, there is an extremely rapid release of much of the chemical energy in the end gas, causing very high local pressures and the propagation of pressure waves of substantial amplitude across the combustion chamber.
Surface Ignition: is ignition of the fuel-air mixture by a hot spot on the combustion chamber walls such as an overheated valve or spark plug, or glowing combustion chamber deposit: i.e. by any other means other than the normal spark discharge.
It can occur before the occurrence of the spark (pre-ignition) or after (post-ignition). Following the surface ignition, a turbulent flame develops at each surface-ignition location and starts to propagate across the chamber in an analogous manner to what occurs with normal spark ignition.
Cam duration, lift and phasing
Valves, ports, valve timing and lift profile play an important role in engine performance by regulating the air flow into and out from the cylinder in order to have better gas exchange process and maximise volumetric efficiency. However, it can only optimise the performance at particular engine speed and will compromise power over the rest of the speed range. Hence considerable effort has been devoted to develop variable valve timing (VVT) mechanisms to minimise the valve timing compromises.
The intake duration may be different from that of the exhaust. With longer durations, it is possible that IVO will occur before EVC (so both intake and exhaust valves will be open) and a period of valve overlap occurs,
Figure 3.
Peak power increases with increasing valve overlap. However, high overlap causes combustion instability (exhaust gases drawn back into the cylinder) particularly at low engine speeds and this is important for stable idle. Combustion instability manifests itself as a cylinder to cylinder variation in IMEP.
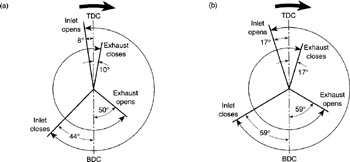
Figure 3:Valve-timing diagrams (a) medium-performance engine, (b) high-performance engine
Exhaust Valve Opening Timing modification – EVO
The ideal timing of EVO to depends on engine speed. At part load conditions, it is generally beneficial if EVO moves closer to BDC as the cylinder pressure is much closer to the exhaust backpressure and takes less time to escape through the valve.
With full load operation tends to result in an earlier EVO requirement because of the time taken for the cylinder pressure to drop to the exhaust backpressure.
Exhaust Valve Closing Timing modification – EVC
For full load action, it is desirable for the minimum possible amount of exhaust gas to be kept in the cylinder as this allows the maximum volume of new air and fuel to enter during the Intake stroke. This requires EVC to be at, or shortly after TDC.
Moving EVC Timing further after TDC increases the level of internal EGR (Exhaust Gas Recirculation).There is a limit to how much EGR the cylinder can tolerate before combustion becomes unstable, this limit tends to become lower as engine load.
Intake Valve Opening Timing modification – IVO
Opening the intake valve before TDC can provide exhaust gasses flowing into the intake manifold instead of leaving through the exhaust valve. The resulting EGR will be detrimental to full load performance as it takes up space that could otherwise be taken by fresh charge. Later intake valve opening can restrict the entry of air/fuel from the manifold and cause in-cylinder pressure to drop as the piston starts to descend after TDC. If the exhaust valve is closed, the delay of IVO tends not to be particularly significant, as it does not directly influence the amount of fresh charge trapped in the cylinder.
Typical IVO timing is around 10-20° before TDC which results in the valve overlap being symmetrical around TDC. This timing is usually set by full load optimisation and, as such, is intended to avoid internal EGR.
Intake Valve Closing Timing modification – IVC
The volumetric efficiency of any engine is heavily dependent on the timing of IVC at any given speed. The amount of fresh charge trapped in the cylinder is dependant to IVC and this will significantly affect engine performance.
For maximum torque, the intake valve should close at the point where the greatest mass of fresh air/fuel mixture can be enclosed in the cylinder. Pressure waves in the intake system normally result in airflow into the cylinder after BDC and consequently, the optimum IVC timing changes considerably with engine speed. As engine speed increases, the optimum IVC timing moves further after BDC to gain maximum benefit from the intake pressure waves.
Closing the intake valve either before or after the optimum timing for maximum torque results in a lower mass of air being enclosed in the cylinder. Early intake closing reduces the mass of air able to flow into the cylinder whereas late intake closing allows air inside the cylinder to flow back into the intake manifold.
A typical timing for IVC is in the range of 50-60° after BDC. At low engine speeds, there will tend to be some flow back into the intake manifold just prior to IVC whereas at higher speeds, there may still be a positive airflow into the cylinder as the intake valve closes.
Valve Overlap
A given amount of overlap unfortunately tends to be ideal for only a portion of engine speed and load conditions. Generally, the torque at higher engine speeds and loads can benefit from increased overlap due to pressure waves in the exhaust manifold aiding the intake of fresh charge. Large amounts of overlap tend to result in poor emissions at lower speeds as fuel from the intake charge can flow directly into the exhaust. High overlap can also result in EGR, reduces full load torque, and can cause poor combustion stability especially under low load conditions such as idle.
Results
 |
 |
 |
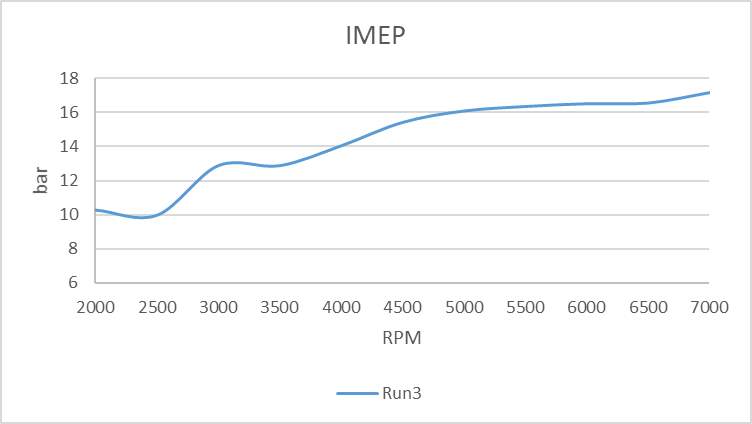 |
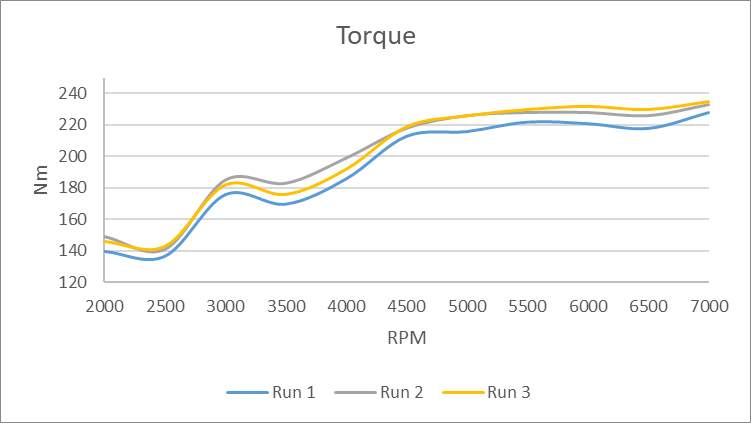
Figure 4: Naturally aspirated engine results
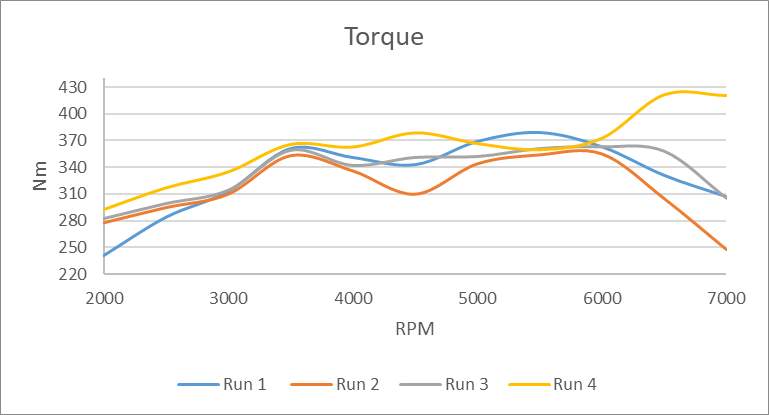
As can be seen in the results from the tested engine
Figure 4, torque is maximum at hight RPM this is achieved by the control of pressure waves from intake and exhaust a proper flow and air mass. Combined with a specific time advance of the spark and cam duration and timing maximum performance is achieved at high RPM due to the use of a gearbox only a range of engine speed must be maximum as its impossible to optimize all the revolution range. Also by choosing a 4-1 exhaust the power curve moves up instead of gaining low rpm torque.
In the next Table 4, the performance of the engine can be compared with other high performance 2000 cc and noticing that it provides the highest power even though its engine speed is lower than other ones.
Table 4: 2000 cc engine benchmarking
| 2000 cc engines | Power (HP) | Torque (Nm) | CR | RPM |
| Tested engine | 218 | 235 | 13 | 7000 |
| Honda k20 | 200 | 192.5 | 11 | 7200 |
| Caterham r400 | 210 | 284 | 12.5 | 7800 |
| Ginetta g40 | 173 | 234 | 11.7 | 6700 |
| Renault clio williams | 150 | 203 | 12 | 6100 |
| Subaru BRZ | 207 | 280 | 11.8 | 7000 |
Task 3 – 1.4 litre turbocharged gasoline engine model.
This model is based on a 1.4 litre, in- line four cylinder, turbocharged gasoline engine but variable valve lift or variable camshaft phasing is not permitted, Figure 5 .
So the aim is to optmize the cylinder head geometry, intake, exhaust and camshaft systems in an effort to improve BMEP over engine speed range 3000-7000 RPM.
The cylinder configuration can be seen in the next Table 5.
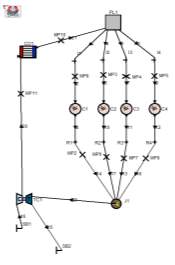
Figure 5: Turbocharged 1400 cc engine model
Turbochargers are a turbine-driven forced induction device that increases an internal combustion engine’s efficiency and power output by forcing extra air into the combustion chamber. This improvement over a naturally aspirated engine’s power output is due to the fact that the compressor can force more air—and proportionately more fuel—into the combustion chamber than atmospheric pressure
The denser mixture increases the peak cylinder pressure, hence increasing the knock probability. As the A/F Ratio leaner, the temperature of the burning gases increases, which also increases the probability of knock. This is why it is imperative to run richer A/F Ratio on a boosted engine at full load. Doing so will reduce the likelihood of knock, and will also maintain temperatures under control.
In order to provide enough combustion energy at high RPM as a high air fuel is entering the cylinder is necessary to increase fuel by keeping the same A/F ratio, Figure 6.
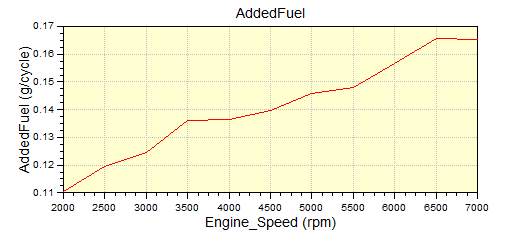
Figure 6: Fuel injected per cylinder
Table 5: Turbocharged cylinder configuration
| Bore | 86 mm |
| Stroke | 60.2 mm |
| Displacement | 350 cc |
| Air/Fuel Ratio | 10 |
| Compression Ratio | 8.2 |
| Valve diameter Intake | 35 mm |
| Valve diameter Exhaust | 29 mm |
| Valve clearance cold Intake | 0.12 mm |
| Valve clearance cold Exhaust | 0.12 mm |
Even though compared with the previous model this one has smaller cylinders (350 cc) as the air mass flow and pressure is much higher hence the intake and exhaust runners are wider as can be seen in
Table 6: Turbocharged Intake dimensions
| Intake Section 1 Length | 250 mm |
| Intake Section 1 Diameter | 55 mm |
| Reduction | 0.98 – |
| Intake Section 2 Length | 100 mm |
| Intake Section 2 Diameter | 50 mm |
| Intake Unification Length | 150 mm |
| Intake Unification Diameter | 75 mm |
Table 7: Turbocharged Exhaust dimensions
| Intake Section 1 Length | 200 mm |
| Intake Section 1 Diameter | 43 mm |
| Reduction | 0.98 – |
| Intake Section 2 Length | 100 mm |
| Intake Section 2 Diameter | 40 mm |
| Intake Unification Length | 100 mm |
| Intake Unification Diameter | 65 mm |
Turbocharger characterization
With a calculated pressure of 3.3 bar at the exit of the turbo that with loses will provide 3 bar at the intake port. A turbocharger with a pressure ratio of at least 3 will be need in order to multiply the atmospheric pressure to the desired one.
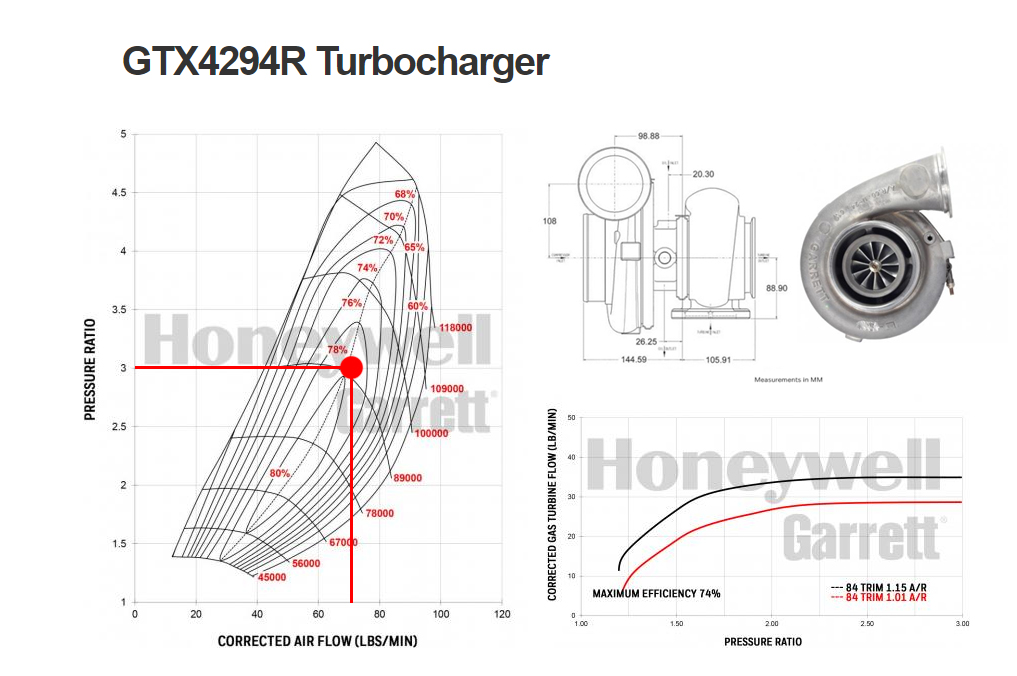
Figure 7: Turbo characterization
With a calculated airflow rate of 4.7 g/ cycle at 7000 RPM requires 70lb/min that with a pressure ratio of 3 the total efficiency is 78% with a turbo spinning at 90000 rpm as can be extracted from previous Garrett GTX4294R turbo, Figure 7 .
As can be extracted from the model a compared work between turbine and compressor is about 93%
With a temperature of 183ºC coming out of the turbo, there is a waste of performance due to cold air is denser than warm air. Getting colder, denser air into your engine will allow for a more volatile mix in the combustion chambers – meaning the potential for more power. The best way to maximise the amount of cold air getting into your engine is to fit a cold air feed to the intake and the use of an air to air intercooler where the intake air charge passes through a narrow bore tubes that are exposed to a cross flow of atmospheric temperature air
An appropriate intercooler would be the PWI5428 from PWR that provides 8L of volume with a 62 mm cores providing a reduction of 129º with a temperature at the intake of 54ºC as shown in Figure 8.
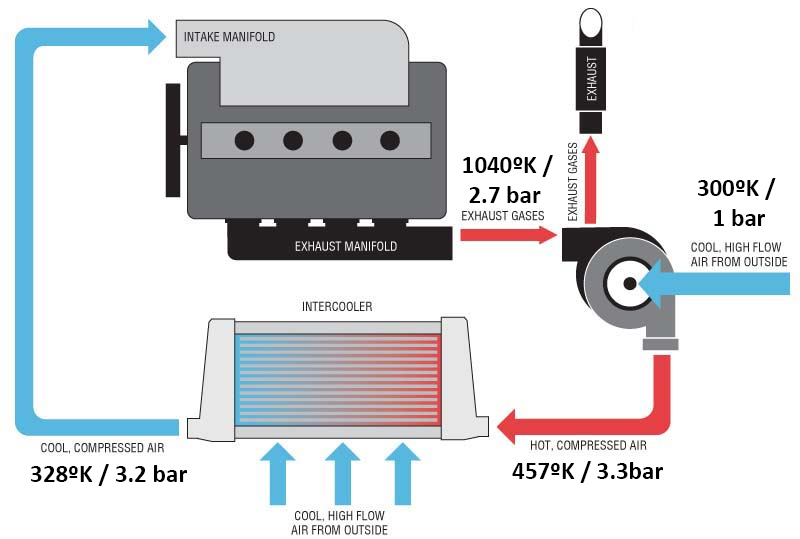
Figure 8: Intercooler / Turbo with pressure and temperatures diagram
Results
 |
 |
 |
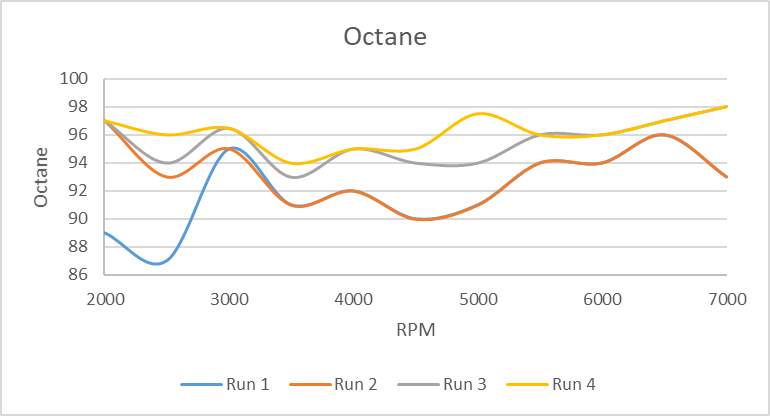 |
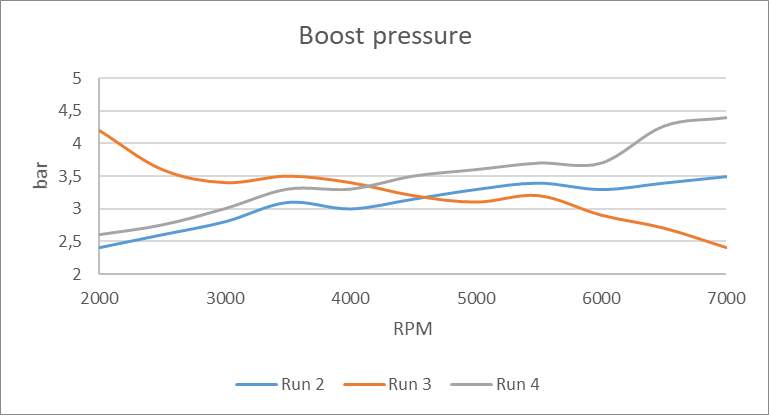
Figure 9: Turbocharged engine results
By using a high A/R obtained from Figure 7 results in low tangential exhaust gas speed at the turbine wheel, low turbine rotating speed at low engine speeds but less of a limit on turbine flow (and hence power) at high engine speeds.
With no variable geometry, sequential, hybrid turbos or nitrous a turbocharger this big will present lag. The engine takes time to create enough exhaust pressure to spin the turbo and pump compressed intake air into the engine and is longest when the engine is in a low-rpm by the fact that turbochargers have a working range, and for this target is optimized for high rpm.
Due to the high pressure up to 4.2 bar, the compression ratio is lowered to 8.2, reducing the static compression ratio greatly reduces the temperature of the A/F mixture. The reduced mixture lowers the chances of detonation as well as pre-ignition. This is helped by increasing the A/F ratio to richer mixture and retarding the ignition time to nearly TDC.
By using a high boost pressure and not extreme valve timing and neutral ignition time, the BMEP reaches 37bar with as previous engine 98 octane, Figure 10.
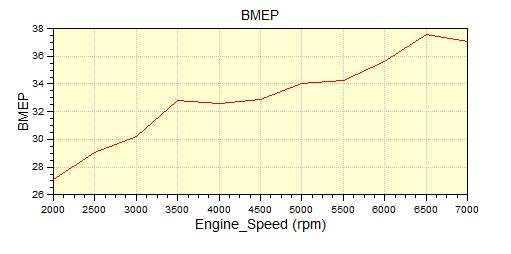
Figure 10: Turbocharged engine BMEP
As can be seen in the next Table 8, different market and racing cars are listed to compare the performance achievable by 1.4 turbo.
Table 8: 1400 cc turbo engine benchmarking
| 1400 cc T engines | Power (HP) | Torque (Nm) | BMEP | CR | RPM |
| Tested engine | 424 | 417 | 37 | 8.2 | 7000 |
| Polo GTI 1.4 t/s | 177 | 240 | 22.6 | 10 | 6200 |
| Abarth 695 biposto | 187 | 253 | 22.9 | 9.8 | 5500 |
| Renault 5 turbo 2 | 160 | 216 | 19.8 | 7 | 6000 |
| Ford Zakspeed Capri | 495 | 402 | – | 6.9 | 7500 |
Task 4 – Comparison of powertrain alternatives on a hillclimb course.
The aim of this task is to compare the performance of previous simulated engines in a hillclimb course that it consists of a straight line of 914m with 11% constant inclination.
The two internal combustion engines will be compared with the performance of an electric powered and an ideal engine with desired torque and speed.
Calculation flow
For the calculation of getting the car from stand still to 914m with less possible time, different assumptions are considered:
Assumptions
- Grip limit: As the torque produced by the engine at low gears is bigger than the amount the wheels can transfer to the road. For calculation, even there is more torque available at low speed, only the amount that can be transferred to the road is used, up to the point that grip and torque is equal and from there the vehicle is power limited.
- Gear change: As the aim is to get to the end of the line with the minimum time, it is need to optimize acceleration. For each gear is calculated the acceleration and velocity as a unique gear and once the acceleration of the next gear Is higher than the previous one, the gear change is produced
- Clutch: The use of a clutch hasn’t been considered for the start so there is no lost at the start from stand still but a time of 0.1 seconds has been applied to do each gear changes
- Drag: Only drag is considered, no downforce is taken in care.
Input parameters and order
The major input is the torque vs engine speed curve, from that other performing parameters are added as in the next diagram, Figure 16.
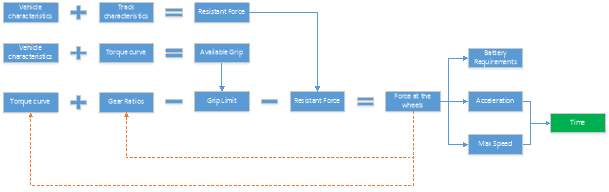
Figure 11: Hillclimb calculation flow
Resistant force
Resistant force is produced by terrain and aerodynamics, for this case a 11% inclination will produce a constant resistance and the aerodynamic will increase exponentially providing a maximum speed.
Also as there is inclination of the track and some of the weight component is transformed as resistant force, the resistant force becomes:
Fd =½ ρ*v2 * Cd * A+Wx
Fd: Drag force
ρ: fluid density
v: Relative velocity between the fluid and the object
Cd: Drag coefficient
A: Transversal area or cross sectional area
Wx: Constant weight force (inclination)
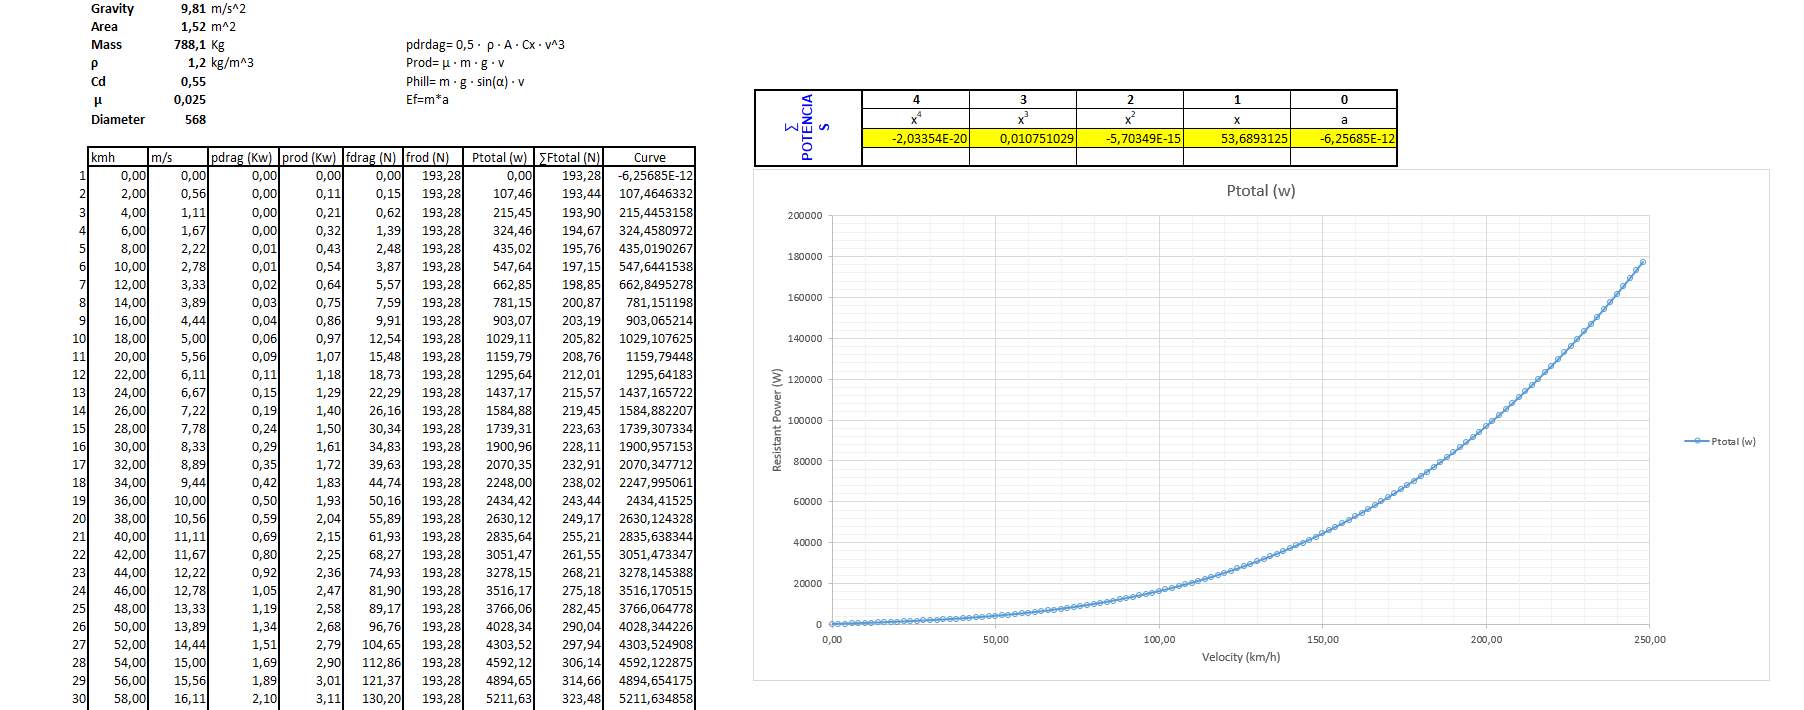
Figure 12: Resistant Curve calculation
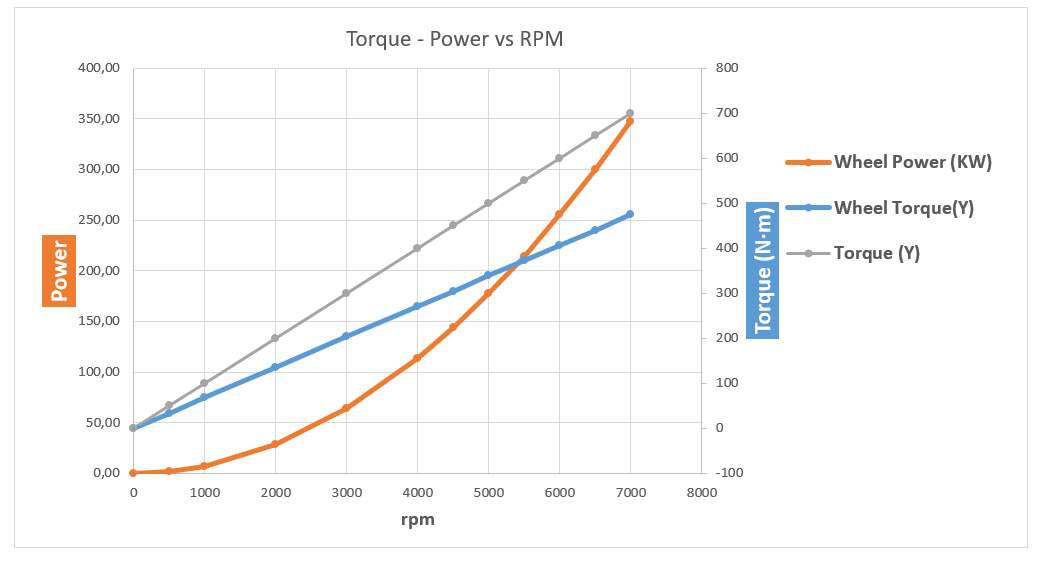
Torque and gears
The most essential parameter for the calculation as well as engine speed is introduced from AVL Boost.
The torque curve is then transformed to a six-degree polynomial. As at low gears, the engine produces more torque than the amount that can be transferred to the ground it is used a launch control system that allows to always having a slip ratio of 0%, by reducing the throttle position in order to only provide the absorbable torque.
From this point, with a 0 km/h start, the the acceleration can be calculated with the weight distribution and tyre characteristics. It is set a distance gap of 0.1m to recalculate the speed and acceleration by transforming the torque polynomial according to the gear ratio.
Once a higher gear has overcome the acceleration, the gear change is produced, up to final gear at which will reach the maximum speed.
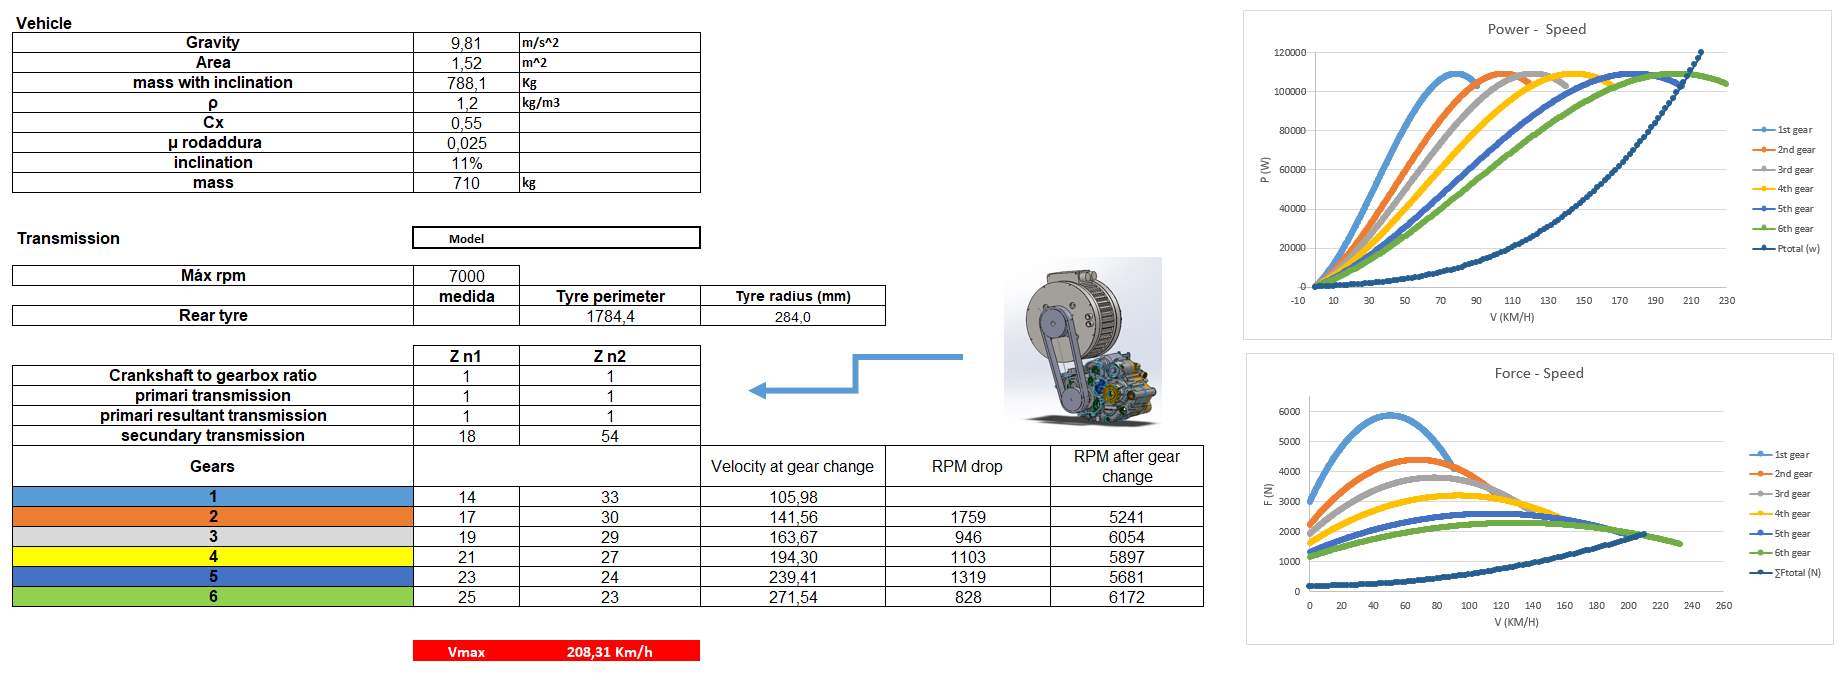
Figure 13: Input of vehicle parameters and gear ratios
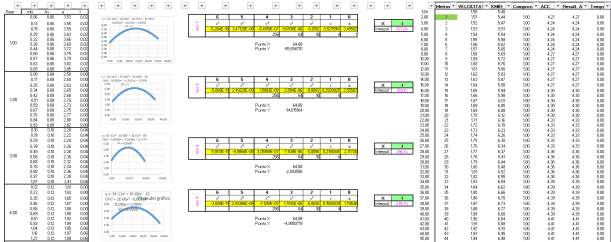
Figure 14: Gear ratio to polynomial curve and acceleration calculation
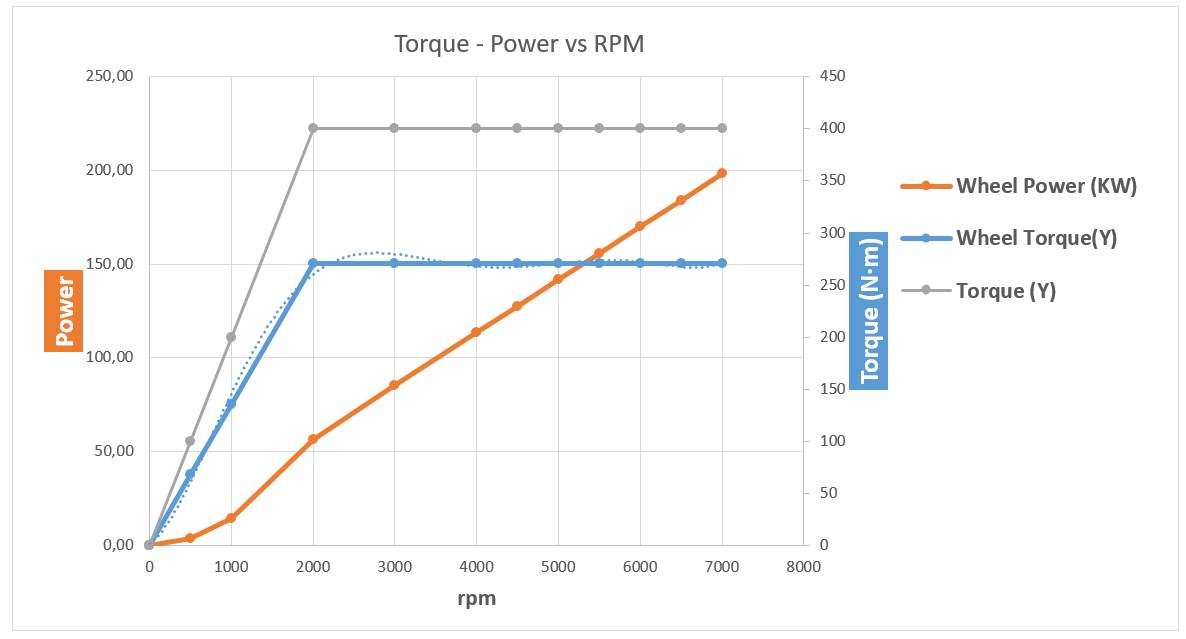
Electric Drive
To accomplish the hillclimb with a single electric motor parallel to the performance of the IC and turbocharged IC the selected engine is the axial flux synchronous permanent magnet motor/generator model 348 from EMRAX. Ref [1]
This is a motor able to provide up to 290 Kw and 1000Nm with a maximum rpm of 4000.
For this motor, the driver controller chosen it is the eDrive 500 From Emsiso. Ref [2]
The resultant needed battery is a 0.65 KWh at 400V and 200A.
The high voltage will produce losses of efficiency but due to the low intensity, heat is not a problem.
Table 9: Battery energy caclulation
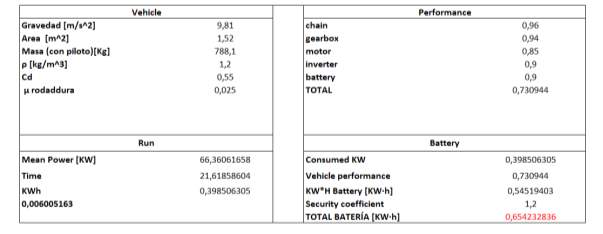
The only problem is that to get to this voltages and amperages, it is needed a big battery with a resultant battery pack of 14.1 KWh due to its configuration:
Table 10: Battery characteristics
| Nominal voltage | 4.2 V |
| Cell capacity | 3 Ah |
| Cells in series | 100 |
| Cells in parallel | 10 |
| C-rate | 10 |
| Final voltage | 470 |
| Final Amperage | 300 |
| Energy Density | 150 Wh/kg |
| Total weight | 95 kg |
Perfect Drive
If an optimum torque curve is available its shape would be the one that always provide the necessary torque that can be transmitted to the ground.
With a start form top bottom and then increasing as grip increases
There can be two curves available for this type of performance explained at Figure 15:
Table 11: Perfect drive (gearbox vs direct drive)
| With gearbox | Without gearbox |
The torque available at low speed is only the amount it can be transferred to the ground and when grip is enough power starts increasing continuously. This set up can be maximized by using a gearbox so maximum acceleration can be available |
The torque is continuously increasing so grip is always available and aerodynamic drag is not a problem as there is always enough power to overcome it. Its limit is engine speed that will limit the maximum power the engine can deliver |
Figure 15: Perfect drive configurations
Even though a perfect curve can also be a flat and constant torque and modulate the torque with the throttle position so only is used the amount that ground can handle.
The main objective is to accelerate the quickest possible with the minimum slip and achieve the maximum velocity that aerodynamics can limit
Torque provides acceleration and traction as power provides maximum speed so always is a balance between both to achieve the desired performance.
Comparison
After running all the models the different performances can be compared at the same track,
Figure 16, Figure 17.
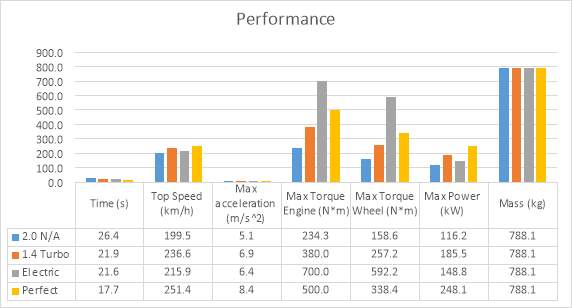
Figure 16: Hillclimb performance comparison
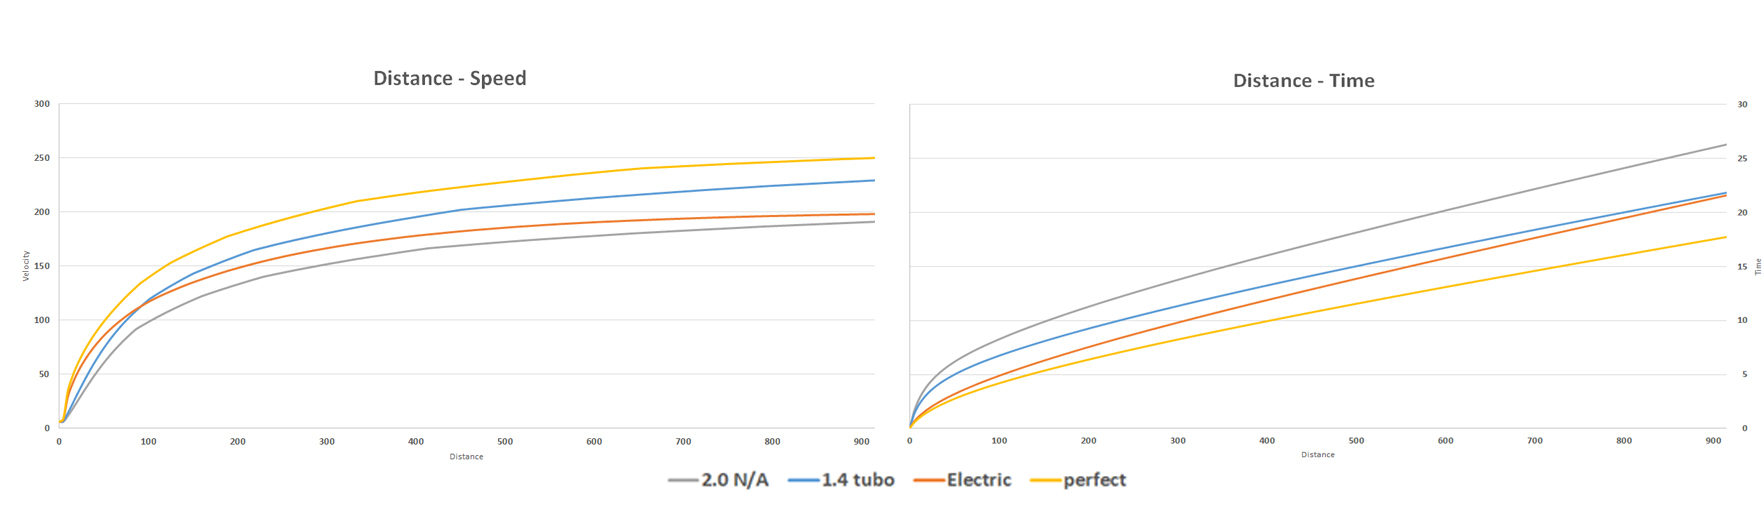
Figure 17: (Speed – Distance – Time) Hillclimb comparison
As it can be seen the normally aspirated engine is the one with less performance even it has more engine displacement, with less air, less fuel can be burnt. The second is the turbocharged with a high peak power but not enough torque at low rpm this is why the electric has better acceleration even though the top speed is reduced as the torque lowers as engine speed increases with a resultant low peak power.
With a perfect curve that means high torque at low rpm as well as high torque with great maximum speed, the performance its always at grip limit so maximum acceleration is always guaranteed.
Bibliography
J.B. Heywood
Internal combustion engine fundamentals, Retrieved January 18, 2018
McGraw Hill Book Company 1988
R. Stone
Introduction to internal combustion engines – 3rd edition, Retrieved January 18, 2018
Macmillan 1999
Webgraphy
Santos, H. D., & Houlahan, M. (2016, June 15).
What Is Turbo Lag? And How Do You Get Rid Of It? Retrieved January 20, 2018,
From: http://www.hotrod.com/articles/what-is-turbo-lag-how-do-you-get-rid-of-it/
(n.d.). Retrieved January 20, 2018,
From: https://www.turbobygarrett.com/turbobygarrett/compression_ratio_with_boost
Turbochargers: Small Engine Performance – Turbo Technology, MPG for Cars, Light Trucks. (2017, April 19). Retrieved January 21, 2018,
From:http://www.enginebuildermag.com/2014/05/turbochargers-small-engine-performance-future/
Air Fuel Ratio in Internal Combustion Engine. (n.d.). Retrieved January 21, 2018,
2018 Vital MX 450 Shootout. (n.d.). Retrieved January 21, 2018,
From: https://www.vitalmx.com/features/2018-Vital-MX-450-Shootout,5510
Inc., J. K. (n.d.). – Exhaust System Technology-. Retrieved January 21, 2018, From: http://www.epi-eng.com/piston_engine_technology/exhaust_system_technology.htm
Benchamrking engine specs, Retrieved January 25, 2018,
From: http://www.autosnout.com/
Electronic Documents
Module – Motorsport Power Train Design
Lecture 2 – Engine performance targets: definitions
M.F. Harrison / Cranfield University 2015
Module – Motorsport Power Train Design
Lecture 3 – calculating fuel and air flow requirements
M.F. Harrison / Cranfield University 2015
Module – Motorsport Power Train Design
Lecture 4 – introduction to valve flow
M.F. Harrison / Cranfield University 2017
Module – Motorsport Power Train Design
Lecture 5– wave dynamic tuning
M.F. Harrison / Cranfield University 2017
Module – Motorsport Power Train Design
Lecture 7 – Limits to ideal behaviour in gasoline engines
M.F. Harrison / Cranfield University 2015
Module–- Motorsport Powertrain Design
Lecture 12 – Turbo and supercharging
M.F. Harrison / Cranfield University 2017
Data Sheets
[1] Emrax “348 motor technicaldata”
[2] Emsiso “EmDrive 500 datasheet ”
[3] Garret turbo catalogue
Cite This Work
To export a reference to this article please select a referencing stye below:
Related Services
View all


Related Content
All TagsContent relating to: "Mechanics"
Mechanics is the area that focuses on motion, and how different forces can produce motion. When an object has forced applied to it, the original position of the object will change.
Related Articles

DMCA / Removal Request
If you are the original writer of this dissertation and no longer wish to have your work published on the UKDiss.com website then please: