Perceptions of Risk of Natural Hazards in the United Kingdom: Sinkholes
Info: 13096 words (52 pages) Dissertation
Published: 9th Dec 2019
Tagged: Health and Safety
The perceptions of risk of natural hazards in the United Kingdom, with specific reference to the risks of sinkholes.
1. Introduction
Several studies of risk perceptions of extreme weather, flooding and other natural hazards have been based on case studies of less developed countries (Wisner et al, 2004; Becken et al 2014). Within more economically developed countries the studies of scholars such as Chinowskya et al (2013) and Andrey et al (2003) focus on the risks of traffic accidents and smoking, with little focus on many natural hazards other than wildfires and flooding. Yet, natural hazards are not bias to one country or another and are an issue shared globally.
Sinkholes in laymen’s terms are cavities within the ground, found predominantly in limestone regions, caused by water erosion and the dissolution of the rock to provide a route for water to percolate underground (Oxford dictionary, 2010). There are different types of sinkholes, categorised through their formation and collapse. There are cover-collapse sinkholes, cover-subsidence sinkholes (otherwise known as suffusion sinkholes), and solution sinkholes (also known as natural sinkholes), all of which formed under different conditions and are further discussed within the literature review.
Sinkholes are not often discussed. They essentially overlooked as a natural hazards present within the UK. It is where and how a sinkhole form determines the severity of the impacts. Sinkholes can form almost anywhere, from out in the ocean or in heavily populated areas, it is these that we hear about most, as can cause a lot of damage not only to property and infrastructure but also to human life.
The impacts of sinkholes vary, changing the topography, altering natural water systems, habitat changes, releasing toxic chemicals from beneath the ground which may pollute groundwater. Sinkholes which occur as a result of human negligence may be stopped, however naturally occurring sinkholes are inevitable. Further, the frequency and severity of sinkholes are further agitated and advanced by climatic changes, and as we see more effects of climate change, it is plausible there will be an increase in the number of the sinkhole. Within the UK, climate change has brought with in more extreme weather, and with that an increase in the risk of sinkholes. In 2014 following the winter storms of December to January 2014, when the Jet Stream moved eastern tracking cyclones in a more southern shift than normal over the UK, brought 287.6mm of rainfall total for December and January (119.9 and 167.7mm respectively). This was the wettest two-month period on record since 1910, subsequently, there were 24 in February alone.
Table 1 contains a record of the sinkholes which opened up in February 2014. Most of which occurred within the south England in the Cretaceous Chalk (Banks, Reeves, Ward, Raycraft, Gow, Morgan & Cameron, 2015).
Table 1. Sinkhole occurrence in February 2014 (Adapted from Banks et al., 2015).
| Date in 2014 | Location | Grid Reference | Description |
| 28 Jan | Walkern Croft, Benington Road, Walkern, Hertfordshire | 5285 2250 | Collapse of karst flow path |
| 2 Feb | Walter’s Ash, High Wycombe | 4839 1978 | Suspected chalk mine shaft associated with former brickworks. Car collapse into subsidence feature |
| 6 Feb | Duddleswell, East Sussex | 5467 1285 | Collapse associated with disused soakaway |
| 11 Feb | M2 between junctions 5 and 6 | 5942 1590 | Suspected denehole. Considerable disruption to motorway traffic. |
| 12 Feb | Rainham Mark Grammar School, Gillingham, Kent | 5806 1668 | The collapse of brick capped denehole. |
| Upper Basildon | 4586 1763 | Associated with former brickworks and chalk mine. | |
| 13 Feb | Gillingham Anchorian Rugby Club | 5786 1664 | Doline associated with feather edge of Thanet Beds over Chalk |
| Oakridge Gardens, Wood Lane End, Hemel Hempstead | 5075 2078 | Associated with former brickworks | |
| Turner’s Hill | 5353 1360 | Sand piping | |
| Warren Farm, Finmere, Buckinghamshire | 4624 2332 | Collapse of karst flow path | |
| Holmesdale Grove, Barnehurst, Bexley | 5513 1760 | Doline associated with feather edge of Thanet Beds over Chalk | |
| 16 Feb | Croxley Green, Hertfordshire | 5071 1963 | Doline associated with Glacial sand and gravel over Chalk |
| Nettlebed, Oxfordshire | 4703 1863 | Chalk mines associated with former brickworks | |
| Windermere Road, St Albans | 5169 2065 | Doline in chalk | |
| 17 Feb | Magdalen’s Road, Ripon | 4316 4719 | Doline formation due to gypsum dissolution below ground |
| 20 Feb | Devizes Road, Salisbury | 4134 1307 | Doline in Chalk |
| 21 Feb | Wilmington, Dartford, Kent | 5509 1707 | Doline |
| Wilmington, Dartford, Kent | 5510 1703 | Doline | |
| 22 Feb | Victoria Avenue, Broadstairs, Kent | 6380 1696 | Associated with brickworks |
| Percy Avenue, Broadstairs, Kent | 6389 1707 | Associated with brickworks | |
| 26 Feb | Bridge House, High Street, Dartford, Kent | 5543 1739 | 3 voids in garden area; suggested the possibility of this being related to former leats. Otherwise suspected natural dolines |
| 1 March | Chilcompton, Somerset | 5160 2065 | Collapse of karst flow path |
Figure 1 depicts the solubility of rocks within the UK. Currently, there is little to no database of UK sinkholes specifically, although a National Karts Database (NKD) is constantly being produced and updates by the British Geological Society (BSG). By keeping a record of the sinkhole or karst related hazardous events which take place, the BSG is using these records to compare to geological records (like those seen in figure one). The NKD includes doline distribution, caves, springs, sinkholes and stream sinks.
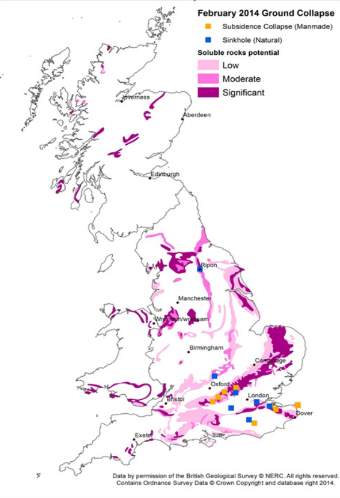
Figure 1. Map of soluble rock susceptibility, including the February 2014 sinkholes superimposed in. (from Banks et al., 2015)
Hazards and risk are inextricably linked by their very nature. Studies of each come with mass bodies of work, spanning a variety of disciplines, whether that be emergency planning, building planning and many other areas, each has a slightly different perspective (Cozier, 1988). Aspects of the geography discipline such as GIS and mapping or hazard management is an important role in hazard evaluation, intensity and extent, as well as the location and composition of the exposed and vulnerable population (Albury, 2004). Albury (2004) explains how mapping or GIS can be used to help visualize the interactions between hazards and potentially at risk population. This research will examine both sinkholes as hazards and social risk perceptions individually, and then in combination to identify how Cutter’s (1993, pg. 67) idea that to perceive risk, it is vital understanding how people are immortalised by various social constructions and social norms fully in conjunction with the hazards themselves.
There is an identifiable gap in the literature of how sinkholes as hazards and the risk associated are perceived within the UK, where these hazards go unaddressed within education, and therefore how these perspectives are affected and controlled by individual factors like gender, age, and education. This investigation will aim to fill this gap.
Primary data will be collected with the use of questionnaires, made on Google form’s, which will be dispensed to the general public through emails and social media. The raw data collected is broken down and presented within the results, broken down into two sections: (1) demographics (2) statistical analysis. A number of statistical tests of chi squared were used to establish the relationship between individual factors of age, gender, region and educational level influences on how an individual perceives risk.
The secondary research shall draw on a number of sources, as well as primary research to investigate the aims outlined below. Case studies where sinkholes are common will be used for comparison to allow for better understanding of the subject and the societal impacts of this particular hazard, as well as case studies where risk perception analysis of natural hazards have been assessed will also be used. The use of these in comparison to the primary research will allow for an in depth critical analysis of the data and the reasons behind trends and patterns that become clear.
This shall also allow for a comparison to be completed drawing from both a human and physical aspects:
- The human aspect addressing how perception differs in an area where the risk is high and common compared to an area that has had less history with the hazard, and any socioeconomic or personal factors will influence this.
- The physical aspect will look deeper into why sink holes occur in different areas looking at the fundamental geology, geomorphology, and anthropogenic factors to analyse their formation and impacts, particularly in the UK (i.e. Rippon)
The thesis will discuss how these hazards may become more prominent due to issues such as climate change, what influences one’s perception of the risk, and how these may be addressed in the future.
1.2 Overview of chapters
The paper is split into four further chapters.
Chapter two will explore the current literature available on the topics of risk perceptions and sinkholes. This chapter aims to present the main factors influencing risk, presenting both sides as to why these factors do or do not impact on risk perceptions. This acts as a basis for the research to take place. Following this comprehensive review of the literature, the gaps within the literature are stated and used as the guidelines from which the objectives were established for the following research.
Chapter three presents the methodological approach chosen. The methods chosen were surveys, with statistical analysis through the SPSS programme. The ethical consideration of the research is also discussed in this chapter.
Chapter four gives a breakdown of the results from the primary research undertaken, as well as a brief analysis of the results, which will be further discussed in the following chapter. The first section presents the demographics of the respondents, followed by the statistical results of the chi squared tests, which presents any relationships found within the research. A full breakdown of each question asked within the questionnaire, why it was asked and how the respondents answered the questions is provided in appendix 4.
Chapter five will discuss the finding from the primary research conducted, how successful the research is and relates what is found to the literature available, as well as addressing the hypothesis and the research objectives.
Chapter six will conclude the study presenting a summary of the main finding from the research. It also explores how successful the research is, as well as recommendations for future studies.
1.3 Overall aim
The basis of this thesis is to investigate the perceptions of risk within the UK and how people associate these perceptions to natural hazards, using sinkholes as a primary hazard. The investigation will establish which demographic factors such as age and gender are the most influential in an individual’s perceptions of risk.
1.4 Hypothesis
The author is expecting that risk perceptions of sinkholes within the UK will be gender neutral, yet factors such as age and region (as a representative of vulnerability and experience) will be the main factors as determinants of risk perceptions.
1.5 Objectives
- Critically evaluate and present any relevant literature within the academic field
- Create and dispense questionnaires to the general public
- To determine through a number of statistical analysis, using the SPSS programme, relationships present between risk perceptions and demographic factors.
- Analyse and equate the relevant literature, case studies and primary research finding to form and conclude the meaningful and pertinent results of the research, including how the research fits into the broader populations.
1.6 Research questions
This research will answer the following research questions:
- What demographic factors play the most important role in influencing peoples risk perceptions of sinkholes within the UK?
- How important is the idea of education and role models (for example the government or the media) in this?
- How do the perceptions within the UK compare to perceptions of those in other countries?
2. Literature review
2.1 Risk
Risk studies date back to the early 1960’s with the introduction of perceived risk becoming a prominent theory within the late 1970’s with work by academics such as Slovic et al (1980) and Fishhhoff et al (1978). Risk perceptions reflect the decision-makers own interpretation of how likely they are of being exposed to the conditions proliferate risk. The research has identified four systematic biases that could cause or justify the common factors which are influential within risk, called heuristics (Slovic, 1980 and Vassie et al., 2005).
The four biases are:
- Ability
- Overconfidence
- Desire for certainty
- The notion that “it won’t happen to me/us” which is also termed “optimistic bias” (Witte et al, 2001), the idea of judging one’s own risk to be lower than that risk posed to others (Helweg-Larsen and Shepperd, 2001).
While other determinants may be the type of the risk and if the risk is voluntary or involuntary, individual characteristics (age or gender), the nature of the consequences (immediate or delayed risks) and controllability of said risk (ref).
Each of these contributes singularly or combined to determining if an individual finds a risk acceptable or unacceptable. Most of the literary research of risk perceptions considers individuals singularly, as facing one threat or one source of risk at a time. For research within risk perceptions to develop a more inclusive conceptual framework would be required, considering how individuals influence, and are influenced by, one another in social and institutional contexts of:
- How multiple hazards events occur and interact with one another
- How hazards affect people and in turn how people affect hazards
- How such interrelation evolve dynamically over time
2.1.1 Individual influences on risk perceptions
“Risk is inherently subjective. Risk does not exist out there, independent of our minds and cultures, waiting to be measured. Instead, human beings have invented the concept of risk to help them understand and cope with the dangers and uncertainties of life” (Slovic, 1992, p. 119).
How individuals perceive and make decisions about risk can be conceptualised by ‘rational choice’, a model developed initially within classic economics (Eiser et al., 2012), a theory which makes the assumption that ‘decision-makers’ compare the possible outcomes of alternate actions in terms of assessing the benefits or costs of each possible outcome and the probability of each.
Kahneman and Tversky conducted a study where participants were asked to imagine a scenario where they are given a choice between two possibly interventions to an epidemic event with a death toll of 600 expected. The first two choices were A) intervention to save 200 or B) had 1/3 probability of saving all but 2/3 probability of saving nobody. Within this scenario, 72% chose A. The same scenario was presented again however given different options. Option C) 400 would die or D) 1/3 probability of nobody dying but 2/3 probability of 600 dying. In this case, 78% chose option D. Kahneman and Tversky, therefore, stressed that ‘gain’s’ and ‘losses’ are not absolute or independent, but relative to an implied reference point (how the question is posed) to represent one’s expectations. Their illustration through this study that decision-makers preference can be changed by a simple alteration to the verbal description of the same situation to imply a different outcome.
Scholarly research and anecdotal evidence tell us that there is no universal conception of risk and how much risk is associated with a particular hazard or activity, as the fundamental basics of what risk is, is perceived differently by each individual. For use with this investigation, the risk is defined as the possibility of loss or injury, while risk analysis refers to the study of risk (Starr & Whipple, 1984). In the interest of narrowing the research, perception is the actual receipt of the environmental stimuli through one of the five senses; smell, sight, hearing, touch, and taste (Cutter, 1993, pg.13). However, there are Risk definitions that are important to keep in mind, as there are a variety of accepted definitions. Smith (1996) defines risk as the actual exposure of something of human value to a hazard, often graded on the damage extent to infrastructure as well as psychological damage, and often defined as the combination of probability and loss, whereas Tobin and Montz (1997) describe risk as the product of the probability of occurrence and social vulnerability. Quantitative risk assessment has been an approach not often utilised for environmental hazards, however, Smiths (1996) and Tobin and Monta (1997) conceptualised these ideals following Fournier d’Albe (1979), who conceptualised risk as:
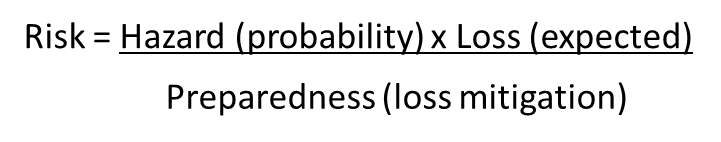
Figure 2. Adapted from Fournier d’Albe (1972) of what factors contribute to making risk quantifiable.
Slovic’s (1987) study says that perceived risk is quantifiable and predictable. It is important to keep in mind that the term ‘risk’ means different things to different people. Risk assessments are subjective to the assessor, as well as risk perceptions, and a number of factors can influence what a person perceives as a risk. Slovic (1987) also furthered that the overriding perception of most is that people face more risk today than in the past, and ones future risk will be greater than before.
Further, understanding these perceptions may be done through psychometric paradigm analysis, allowing for a deepening of understanding by use of quantitative methods to visualise the data, such as cognitive maps of risk attitudes and perceptions (Slovic, 1987). Smith (2000) expanded that the type and level of risk perceptions vary greatly, even between individuals of the same age and gender depending upon ‘personal factors’ – these include location, culture, upbringing and life-style. Smith continues that risk perceptions are to be accepted as a vital part of risk management as well as more ‘scientific assessments’, an ideal shared by Slovic (1987).
There are different opinions on factors influencing risk perceptions. Figure 3 summarises what factors influence a person’s perception of risk to a particular hazard. This combined with a person’s vulnerability will impact upon a number of factors, including an individual’s receipt, interpretation, assessment and response, and adaptation, to a hazard. Each of these, therefore, impact upon and severity of the impacts of the hazard to said individual.
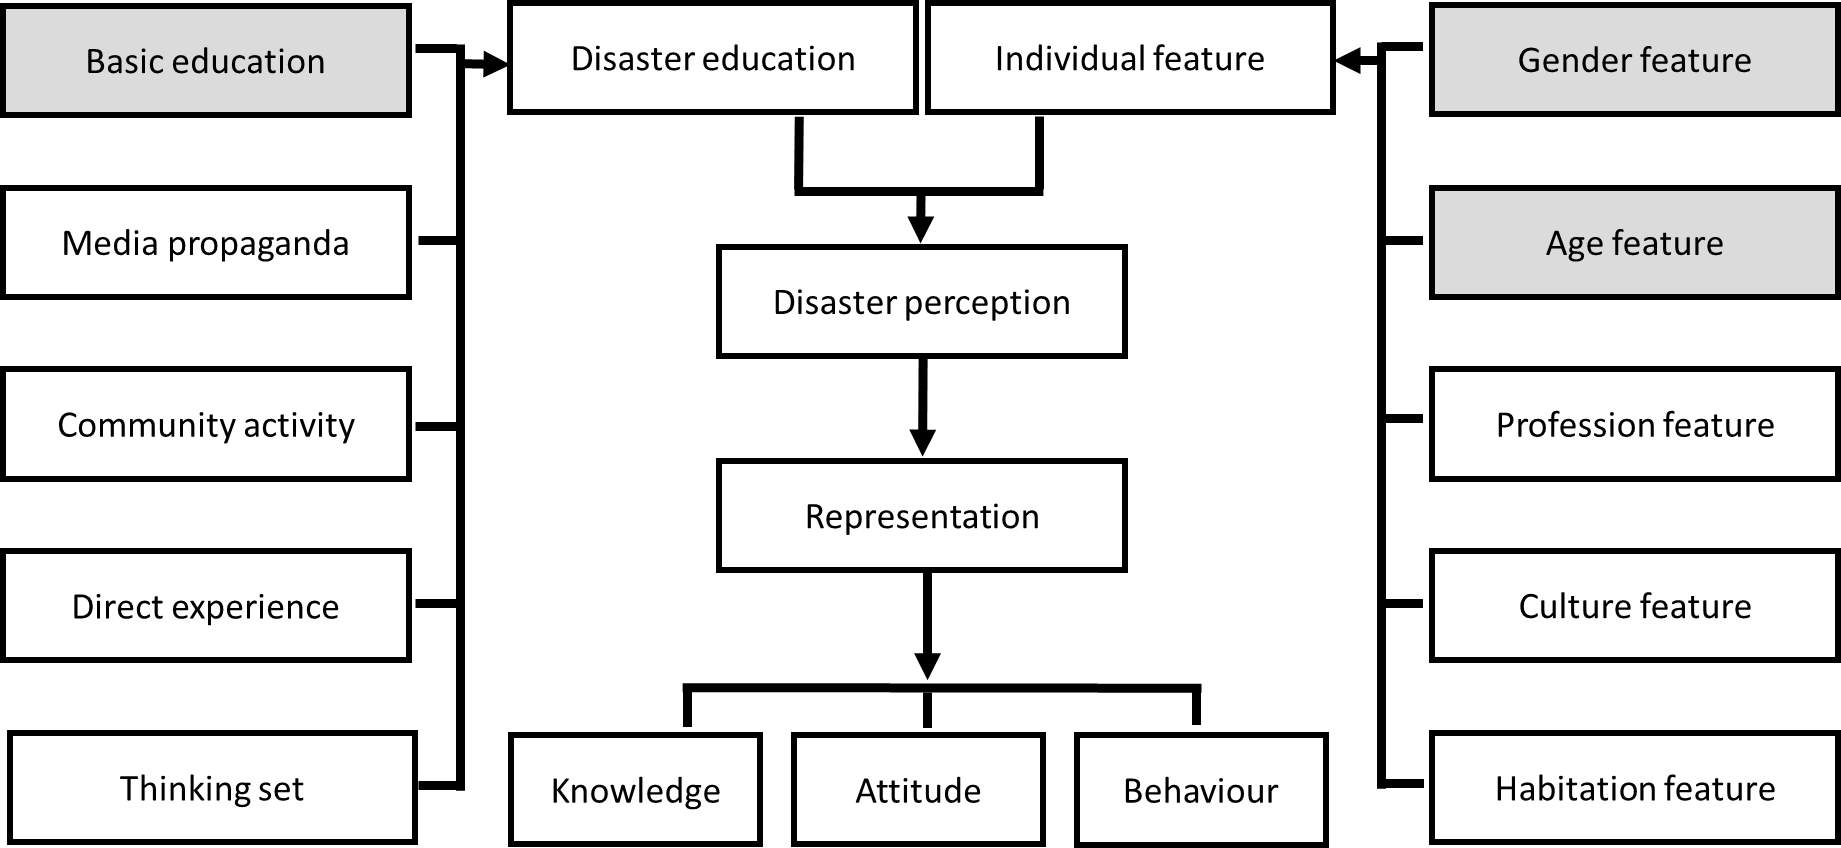
Figure 3. Factors which influence on a person’s risk perception. Boxes in grey will be the main factors assessed of UK inhabitants in the risk of sinkholes. Adapted from….
When interpreting and making decisions based on risks and previous experience, people tent to base their interpretations on a number of characteristics, including not just the severity and magnitude of the risk event and the possible consequences of each possible outcome, but also incorporates their ability to manage or to do something about the risk, the uncertainties of the risk and knowledge of the hazard creating the risk in question (Swets, 1978). People learn from observations and the consequences of decisions made within prior hazardous situations, therefore individuals each perceive a risk differently as people differ in their amount of knowledge and prior experience. A framework presented by Swets (1978) for considering the ‘costs’ and ‘benefits’ of different decisions derives from the classic theory of visual perception known as Signal Detection Theory (SDT), an interpretation of this is illustrated in figure 4.
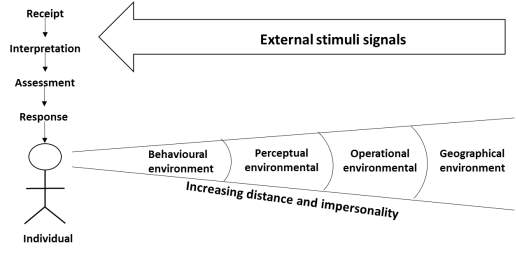
Figure 4. People and their cognitive environment. Each individual receives signals and stimuli from the environment around them and uses these in building up an understanding of that environment and in deciding how best to respond and behave in relation to that environment stimuli. (Adapted from Swets, 1978).
Paul and Bhuiyan (2010) furthered this idea that individuals risk perception is influenced by past experience, not only in their decisions and attitude to a risk but what they perceive to be of greater or lesser importance to themselves or statistically significant risks to most. Therefore memory is similar to other influencing variables like age, gender and prior experience (including the severity and time of the prior experience) (Paul and Bhuiyan., 2010).
2.1.2 Optimistic Bias
Authors such as Drake (1984), Abele & Hermer (1993), Drake & Ulrich (1992) examined the effects of mood on differences within optimistic bias. Drake (1984) began studying the effects of mood on optimistic bias by activating the right and left the side of the brain alternately, a method which has been used since by Drake (1987) and Drake and Ulrich (1992). Drake (1984) went as far as to conclude that right and left handed people to differ with which side of the brain controls their emotions. Positive 1emotions relate to activity within the left hemisphere, and negative emotions from the right hemisphere for right handed people and vice versa. Each of the studies found that more optimistic bias was present when the participants were in a better mood. However, these studied lacked a control variable of a neutral mood, while Adele & Hermer (1993) and Salovey & Birnbaum (1989) conducted a study using sad, happy and neutral moods, however, the study lacked the statistical analysis required to fully understand the affects.
2.1.3 Gender feature in risk perception
Gustafson (1998) theorised that although research has revealed that risk perception itself has subjective dimensions influencing individuals, risk perceptions are not gender neutral, contradicting the common conception. Typically within the academia men are deemed to be “risk takers” and women as “risk-avoiders” as women place a higher price on personal health and well-being, not only for themselves but also others (Cutter et al, 1992), while less secure about all types of hazards, however, this notion is something debated by academics.
Thus, irrespective of the social context the “subjects” – a community of men and women – live in, women tend to worry more about certain risks than a man would, and therefore concluded that risk perceptions are heavily influenced be gender roles as well as their establishment in a community. Further, in a community where women are the main ‘caregivers’, in the situation given by Gustafson (1998), a direct exposure to poor local environmental quality results in a negative risk perception towards the use of portable water in their homes (Gustafson, 1998, pg. 808). Gustafson (1998) goes as far as to deduce that it is imperative for research to take a qualitative approach when approaching risk perception theory as it allows for gender differences to be clearly represented. Arcury et al (1987) however concluded that males were more concerned and knowledgeable regarding problems associated with hazards than females are.
However, this is not an ideology shared by all. In a study based in Turkey in 2013, Nurdan and Alkan (2013) found that women and men have the same concerns about the use of wastewater, and concluded that there are no gender differences in risk perceptions between genders. Flynn et al (1994) also concluded that there is no difference in the level of perceived risks, which are more or less the same for both genders. Therefore, as there are conflicting opinions to the extent of the influence gender roles play in risk perceptions, how they fit with the UK in this study will be interesting in addressing if with this case gender differences are clear, or external factors as age, education, economic or cultural differences are the primary influencer in risk perceptions.
2.1.4 Age
Age is an important variable when assessing risk, ensuring younger people fully understand the risk, and if so does one use their understanding to make conscious decisions on whatever risk is posed (Rhodes, & Pivik, 2011; Bayrampour, Heaman, Duncan, & Tough, 2012). In general, younger individuals respond to risks and hazards highlighted within the media and education, because of this dependency on social awareness younger individuals have an inadequate risk perception, often leading to a failure to respond. Those whose experiences have been dominated by media and recent activities would have higher risk perceptions than those with a longer term perspective. Therefore there is an expected bias of the young as a result of the tendency to overestimate risk (Viscusi, 1991).
Viscusi (1991) conducted a study within which he concluded the study did not reflect a failure to process risk information or stimuli within younger individuals, therefore younger individuals are able to make themselves aware a risk is present but does not indicate their awareness of specific probability or vulnerability. The younger the age meant a higher risk perception while overestimating a risk more than the population at large, indicating there is a higher reliance on information more recently provided. Therefore younger individuals fail to make rational decisions. Viscusi summarises that actions and the consequences of said actions do impact on risk perceptions, however a quality more prominent within adults with prior experience than younger people.
Qi, Jing-yi, and Jing-yo (2003) did a study of the perceptions of earthquakes risks, where although agreeing with Viscusi that young male’s ability to perceive disaster and ability to reduce disaster was the strongest, while old folks had the weakest. Qi et al (2003) furthered the research, identifying persons aged 20-30, who were recently out of schooling, perceptions could be easily edited by communities. Furthermore that from the age of 30-40 the risk perceptions drop due to over-shadowing of other priorities while in those 40-50 the perceptions strengthen again as there is a stronger sense of responsibility. Older than 50 plus there consciousnesses are comparatively conservative (disaster perceptions are reduced or played down).
2.1.5 Education
Culture type and surroundings strongly influence on an individual’s options and activities, particularly in the event of a hazard event (Li, 1999). Generally, schooling or formal education gains and develops knowledge, and those who’s with higher grading in formal education have more knowledge about disaster reduction and management, therefore the level and depth of education become an important factor in impacting on the attitude, choices, and actions of a person’s disaster perception. From Qi et al (2003) illiterate person doesn’t understand clearly a disaster, however, are hurt by disasters and when addressing the disaster and their actions are the most manlike in response. Environmental perceptions from strongest to weakest in figure 5.
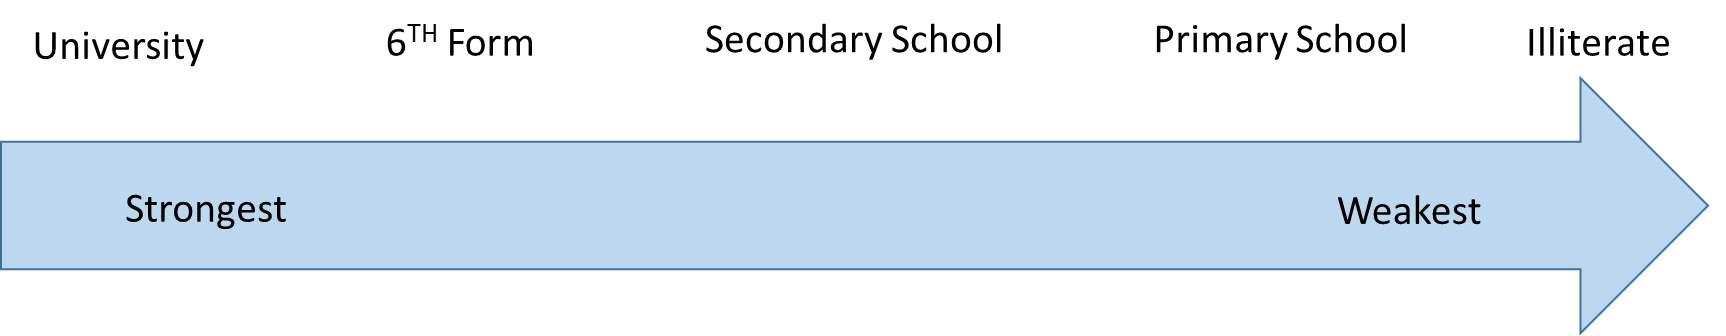
Figure 5. The environmental perception from strongest perception to weakest perceptions. Adapted from Qi et al (2003) study of earthquake risk perceptions.
2.1.6 Media
The media umbrella spans a diverse content of information, normally seen as unbiased. However, the media’s influence on an individual’s perceptions is often underestimated. Between complex emergencies and natural hazards, public and private response is much faster in the case of hazards which become disasters, which in turn typically have more media attention than complex emergencies, particularly as natural disasters usually come with little to know warning, anywhere in the world with causations that cannot be accredited to direct anthropogenic causation (Spiegel, 2005). Due to the complexity and political implications of complex emergencies, depending on an individual’s perspective, the blame is often placed on an individual or groups. As a result, it becomes difficult for other countries to remain independent and neutral when addressing the issues, while aid can sometimes exacerbate tensions between opposing groups (Spiegel, 2005).
Wahlberg and Sjoberg (2011) contradicted this common conception of medias influence, finding that even for those who would be deemed heavy media users, media influences are not as strong as a casual factor in risk perceptions. However, Wahlberg and Sjoberg (2011) did, however, acknowledge that the stronger influenced individuals were those within greater exposure and availability to the media, but the effects of how strong the risk perceptions are proportional to the media; general risk perceptions (ie perception of the population as whole) are more easily changed than personal risk perceptions.
2.1.7 Professional and Habitational difference
Individuals of different occupations have a different perception of disaster events. Due to the impacts of education on an individual’s perceptions, students are likely to have the highest risk perceptions, as those who are still learning or studying have more knowledge of the environment and the risks posed. Within Qi et al (2003) the study found following students are those who work exposed to the environment, like farmers or conservationists, who see the effects of a hazard event, then teachers. This is retrospective to Qi’s study and may vary depending on the country within which the individual is based, as within the UK there are fewer farm workers and outdoor workers compared to places such as Vietnam where farm working is more common, and a greater percentage of the population see the effects.
Habitation of the individuals is just as an important factor as others when addressing the disaster and risk perceptions. Within a big city, a lower perception is expected as individuals have a busy life with less free time and worry less about disasters. Following this logic, those in a smaller city or countryside have more free time an energy to concentrate on observed changes and about the habitat around them, so the ability to perceive disaster is the strongest.
2.2 Sinkholes
Sinkholes in laymen’s terms are cavities within the ground, found prominently in limestone regions, caused by water erosion and the dissolution of the rock to provide a route for water to percolate underground (Oxford dictionary, 2010). There are different types of sinkholes, categorised through their formation and collapse. There are cover-collapse sinkholes, cover-subsidence sinkholes (otherwise known as suffusion sinkholes), and solution sinkholes (also known as natural sinkholes).
Collapse -cover sinkholes are sinkholes that occur is soil or other lose material over a soluble rock (Tao et al., 2015).Sinkhole development almost always starts with the dissolution of soluble rock, with the thickness and cohesiveness of the soil determining the size of a cover-collapse sinkhole. A karst aquifer or fissure is commonly the beginning of a sinkhole as the cracks allow for the passage of soil transport downwards. This type of formation may also be associated with solution sinkholes, where the acidity of the water expands an aquifer or fissure.
In many cases, groundwater is one of the most prominent causes of sinkhole formation and collapse, because ‘seepage force due to groundwater flow drags clay and sand particles downwards’ (Tao et al., 2015). Figure 6 illustrates the typical formation process of a sinkhole due to groundwater pumping, an example of an anthropogenic causation.
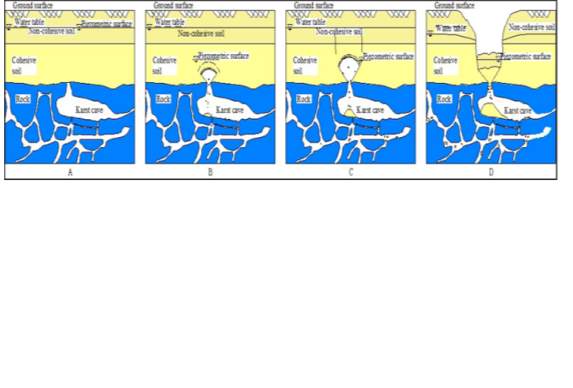
Figure 6. Formation of cover-collapse sinkholes. source: (Tao et al., 2015).
Cover- subsidence sinkholes, also referred to as suffusion sinkholes, form under similar mechanics as cover-collapse sinkholes. Berlin (2013) discusses their formation briefly. Typically these subsidence sinkholes form within regions like the Shenandoah Valley, where sandier soils are common and the formation of a void underground. As the loose soil transports itself downward, into the cavern, the ground above slowly subsides, thus these sinkholes form over time and are not ‘catastrophic’ events (Berlin, 2013). This can take hundreds of thousands of years to form. The movement of the soil into the cavern is called spalling (Radazzo, 2015).
Figure 7 illustrates the formation process of cover-subsidence sinkholes. Comparing this to figure 2 shows the characteristic differences within the two sinkhole formations.
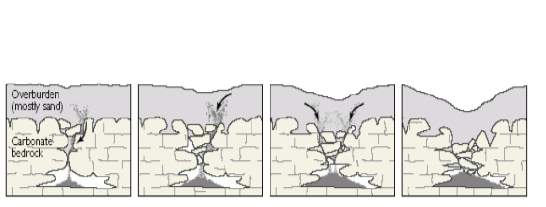
Figure 7. Formation of cover-subsidence sinkholes. Source: Geohazzard website (Radozzo, 2015)
Solution or natural sinkholes form as precipitation percolates through the soil, absorbing carbon dioxide and reacting with decaying plant material to create acidic water (Waltham, Bell, & Culshaw, 2010, p.9). Precipitation absorbs pollution from the atmosphere and thus is already slightly acidic. How acidic the rainwater is, therefore, can be affected by pollution and anthropogenic factor. This acidic water has the ability to dissolve carbonic bedrock as it percolates through, mainly in karst regions. In the UK this is common in gypsum areas (see figure 1, chapter 1) as is easily eroded and dissolved, hence why Ripon or the East is particularly affected. This dissolution of rock results in the formation of caves, disappearing streams, underground drainage and most of all sinkholes (Florida Department of Environmental Protection, 2003).
There have been copious amounts of work addressing the geological framework and mechanisms of sinkhole formation. Sinkholes are naturally occurring hazards that form mainly in soluble rock, particularly limestone Karst regions, a generic term which refers to the characteristic terrain produced by erosion processes associated with the chemical weathering and dissolution of limestone or dolomite (Baryakh & Fedoseev, 2011). Karst is one of the most complex, hazardous and unpredictable geological processes. Within the UK (bsg, n.d.), the most susceptible area to sinkholes is the Permian gypsum deposits of north-east England, particularly near Ripon. This is due to gypsum being more soluble than limestone and thus dissolves more quickly (bgs, n.d.). Baryakh & Fedoseev (2011) set up a finite element model of a growing cavern to describe the possible sinkhole formation processes within the territory of the Permian Region and Karst regions of Russia, using this to estimate formation criteria for ground surface sinkholes and underground caverns to estimate their size. Baryakh & Fedoseev (2011) found that given the height of the cavern within the rock is large enough to enable a visible difference at surface level, then the height of the cavern is irrespective. It is the width of the cavern that deems the size and extent of the sinkhole. Through Baryakh & Fedoseev‘s (2011) analysis of the stress-strain state of a rock mass with a cavern inside three possible scenarios are possible when the maximum width is reached:
- The roof at the edge of the cavern collapses as a result of ‘plastic strain localisation’ and shearing fracturing, throughout the entire overlying thickness of rock.
- The roof collapses in the centre of the cavern due to a growing/expanding fractures in the whole of the overlying mass of rock.
- There is a total collapse of the cavern roof as a combination of one and two takes place simultaneously.
Baryakh & Fedoseev’s (2011) however based this theory assuming the cavern and geological state of the surrounding rock mass were in a perfect state, yet they admit within reality this may not be the case. Variables such as cavern size and shape, rock thickness and mass (i.e. volume force) are interchangeable depending on location. This was a theory developed and revisited by Tao et al (2015), where this theory is applied to a specific case study within Florida.
3. Methodology
This chapter will present the methodology used within the primary research, addressing the research philosophy, data collection, and analysis as well as ethical considerations and limitations to the methods chosen.
3.1 Research philosophy
When addressing research philosophy, there are many debates on which philosophy specifically addresses each discipline and many conflicting opinions (Mkansi, & Acheampong, 2012) making it a confusing aspect of assessing for those undertaking research. Due to the quantitative approach of this research Steen and Roberts (2011) believe that taking a positivist and naturalist philological approach is most appropriate, while Alvesson and Skoldberg (2009) built on this to add post-positivism and societal construcualism to be incorporated as philological stances. This is something backed up by Polit and Beck (2008), whose study associates positivism to natural sciences, drawn from Bryman’s (1984) summary that social research which applies natural sciences should use a positivist approach as well as an interpretivist view investigating people and how they interrelate with each other and their environment.
Therefore in light of this, this research will take a positivist philological approach. However, the ideology of epistemology is important when undertaking any research as Slovic (1987) deemed qualitative methods for risk perception data collection to be preferred within the academia. Keeping this in mind, although no primary qualitative research will be undertaken, secondary qualitative data will be used, to gain more epistemology; the ideology of all-encompassing knowledge, utilising all possible methods to increase validity regarding pubic risk perceptions before relating to cases of UK sinkholes. This will all be combined when analysing the results and all will contribute to final conclusions.
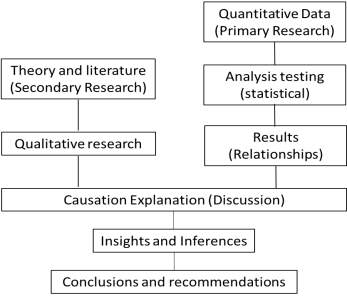
More and more within today’s academia is the combined use of these methods. This is known as Triangulation and is demonstrated in figure 8, which shows the plan undertaken within this research as to how the triangulation will be used within this research, adapted from Fellows and Liu (2008).
Figure 8. Triangulation and plan for the research to be undertaken as the best approach to allow for full epistemology to the research. Adapted from Fellows and Liu (2008).
3.2 Primary research
Naoum (2012) describes primary research as the most accurate sources of information as they publish original research. Primary research is a practical approach to conducting research and may be described as “field work” (Naoum, 2012, pg.44) as a means of collecting data first hand and applying it to an investigation (Doyle, 2011). Undertaking such research can be particularly time to consume as planning, ethics, data analysis, and then concluding the main findings is required. Within this section, the primary data collection and analysis methods are outlined.
3.2.1 Data collection
Questionnaires will be used to collect data of risk perceptions within the UK, as the use of questionnaires is popular and fundamental within collecting information on public knowledge and perceptions of natural hazards (Bird, 2009). Questionnaires are a method of quantitative research which allow for a large sample size to be questioned and generalised into categories, allowing for identification of the key factors influencing how risk perceptions are developed and differ within the chosen sample region. Further, questionnaires allow for bias to be eradicated from the research. For this research the use of questionnaires over interviews was chosen as little prior research within the UK has been conducted for risk perceptions associated with sinkholes, therefore questionnaires will allow for a wider study to be conducted. Secondary research allows for the qualitative approach due to the mass body of work accumulated within other countries, case studies, and analysis of similar studies, the in-depth insight that interviews would have allowed given an extended study will be achieved through this.
Convenience sampling (also called accidental sampling or haphazard sampling) is a type of non-random sampling where members of a target population are chosen due to a number of factors such as accessibility, geographical location, willingness to participate as factors which make ease and practicality (Etikan, 2016). This sampling method was chosen for the reasons aforementioned. Convenience sampling is often a method used within quantitative studies
The questionnaire was produced using the Google Forms programme, of which a blank copy of which, including the information with which participants were provided, can be seen in appendix 1. Once a sample questionnaire had been created, a pilot study was issued to highlight any issues with structure or defects of the questionnaire, missing information that may be required and test the overall usefulness (Bird and Dominey-Howes, 2008; Bird., 2009). For this pilot study, an additional section for any comments and feedback was added to the end of the questionnaire allowing for feedback. The feedback from the sample study was used to edit and adjust the questionnaire accordingly for the final questionnaire produced.
The questionnaire was distributed via email and social media, including the information to debrief participants on the following:
- the purpose of the investigation
- details of the questionnaire
- how participants data will be used within the study
- details of how participants data and personal details will be stored and disposed of
- contact detail for the author
The questionnaire was comprised of 5 sections as outlined:
- Consent form. This section was required be all participants to be completed. The questions addressed some of the information within the information sheet ensuring all participants has understood the information. Included was a final question for this section asking if the participant was happy to continue to the questionnaire, only upon answering yes was the participant allowed to continue. All 74 respondents agreed to be included in the study.
- Personal factors assessing vulnerability and any demographic information which may have influenced their risk perception.
- Personal response to hazards events.
- Preparedness. This section addressed if, how and why one might prepare for a hazard. This was split into two sections depending on how the questions were answered.
- Knowledge and influence.
The questionnaire was comprised of a series of mainly closed questions, however, where appropriate open ended questions were asked. Where open ended questions were asked the data was post coded appropriately.
Following the initial dispersal of the questionnaire via both email and social media, a one week collection period was allowed. At the end of the week, reminders were sent via email, as well as the questionnaire being reposted on social media, following which an additional two weeks of sampling was allowed. During the initial week of surveying the response rate was fairly slow, receiving 26 responses at the end of week 1. Following the second drive of delivering the survey, the response rate increased for week two. During the final week, reminders were again sent out and posts on social media were again shared, getting an additional few responses at a slower rate, before closing the survey once 74 responses were received.
3.2.2 Data analysis
The study received a total of 74 responses. Following the closure of the questionnaire, the raw data collected was analysed. The results from this are presented in chapter 4.
The raw data from the questionnaire was post coded and where appropriate coded into groups to allow for statistical analysis to be conducted. Initial coding allowed for the main groups to be identifiable within the data. For example, post coding of the occupations of the respondents was conducted in accordance with the International Standard Classification of Occupations (ISCO) (“ISCO”, 2017). The other post coded questions included questions 14, 28, 30 and 31. These questions were grouped by similarity of answers, not in accordance with any specific or defined classifications.
The raw data from the questionnaires is then checked and edited that the coded data is entered to replace the pre-coded categories (Oppenheim, 1992). This is important as a computer assisted data analysis of Statistical Package for the Social Sciences (SPSS) was chosen to conduct the statistical analysis of the data, thus will ensure the data matches the post coding data analysis.
A full breakdown of the questionnaire questions can be found in appendix 3 due to there being 31 questions to present, not all are directly relevant to have a full breakdown. For this reason, a full breakdown is provided within the appendix, including why they were asked and a table of the answers and responses to each question. Each question asked was relevant to the research as an indication of an aspect being analysed for the research and therefore the author deemed it relevant to include a full breakdown, despite not all included within chapter 4.
The IBM SPSS statistics programme is the most reliable statistical analysis for quantitative data (Sarantakos, 2007) and therefore was the chosen method of statistical analysis. SPSS allows for a general and descriptive overview of the data collected, providing frequency tables and examines the correlation and relationships of variables while testing the significance of the results as to if they are suitable and reliable enough to be applicable to the population. Categories were developed for various open ended questions to enable the SPSS to analyse the data appropriately.
3.2.2.1 Inference statistics
Inference statistics are used to infer something about the sample, identifying any errors within the data and test how much confidence one can have within the sample, testing the hypothesis and presenting any relationships between variables. Confidence intervals were used to know how the sample mean (the mean collected from the survey) compare to the true mean (if applied to the population) by identifying the range the true mean would fall within.
Chi squared tests are used when testing two nominal variables within the same or a single population to identify any relationships which may be present and how significant these relationships may be, particularly if the hypothesis is deemed to be a null hypothesis. Due to the nature of the study most of the results are nominal, therefore the use of a Chi squared test over the use of a t-test was chosen. A t-test, like a chi squared test, can be used to test the hypothesis and establish any relationships and how strong the relationships, if present, are. A t-test was therefore deemed unsuitable for being used within this study.
A number of tests were carried out on the demographic factors, mainly gender and age, compared to the results of a number of the questions asked. The results of the chi squared tests are presented for each of the demographic variables tested in Chapter 4, section 4.4. The results are further discussed in Chapter 5, bringing together the results to analyse what they mean for risk perceptions and how these compare to case studies.
3.3 Limitations
The characteristic of the non-respondents often differs to those of respondents (Bird., p. 1315, 2009). de Vaus (p. 84, 2002) suggests that by observing what one can about non-respondents characteristics and collating information of what is known about the population as a whole and apply this to the data collected, can be a useful way to neutralise the effects of non-respondents.
For the tests to be a true representation, there must be approximately the same or similar number of data for each comparable variable, as comparing large sample to a small sample may give inaccurate representations. For most of the variables, this is not an issue, however for example, when comparing the levels of education, the majority of the respondents had a degree level of education. When comparing the education level to other categories this is important to keep in mind as questions to the validity of the results for that section may be questioned.
Due to convenience sampling methods being used, only loosely based and weak statements can be made about how the study applies to the larger population (Etikan, 2016). Of course, the obvious disadvantage to this method is the that the sample is likely to be biased, and therefore the study will be limited as to how accurate a representation of the population the study will be. Etikan (2016) also highlights the issues of outliers in non-probability sampling; the effects of outliers are heightened and may impact on the results of the study due to the self-selection possibility.
Finally, there is only one method of primary research being undertaken. Academics such as Gustafson (1998) and Slovic (1987) regarded qualitative methods to be the preferred method of data collection, however, these qualitative methods are not used in this study. Although secondary methods of qualitative data are utilised to try and accept the idea of epistemology, the research conducted may not hold the same depth of knowledge, however, this may be something considered in future research.
3.4 Ethical considerations
All research will be conducted within the confines of what is ethical and will be undertaken in an ethical and respectful manner, keeping the participant’s ethical rights as the main priority, maintaining a standard of validity to the investigation. A full ethics report can be seen in appendix ….
Due to the nature of the investigation, questionnaires are the main primary research data collection method utilised. All participants will be briefed before answering any questions to raise awareness of their rights to withhold or retract their participation.
In light of the limitations of the investigation, by completing the questionnaire and submitting results, the participant are giving their consent for the data to be used accordingly, waving their right to retract the data past the point of final submission. This will allow for the data collected to be available for direct use of the author and allow for greater response rates within the limited time available.
3.5 Summary
A positivist quantitative approach is taken to the study, using questionnaires to collect data from the chosen sample population – the general public. Data collected via the questionnaires is coded and statistically analysed utilising the SPSS programme. Pearson’s Chi Squared and Spearman’s rho are used test the hypothesis, identify relationships and establish not only the extent of the relationships but if those relationships preset are linear, positive or negative (see chapter 4). The results of the statistical analysis are compared to case studies as well as the background research as presented in Chapter 5.
Chapter 4: Results and analysis
4.1 Introduction
The purpose of this chapter is to present the finding from the primary survey research by presenting the key finding. It will consist of two main sections. The first will be the demographics of the participants, the second will present the statistical analysis, identifying the main relationships to be carried forward into the analysis and discussion in chapter 5. Appendix 3 presents a full breakdown of the questionnaire results by, including the post coded analysis to each question (NB Due to a lot of questions and results to address, appendix X covers these as each is not significant individually).
4.2 Data Collection Method
One method of data collection was employed, however via two separate dispersion methods were utilised to ensure that neither method was introducing an element of bias. A total of 74 responses to the questionnaire were collected, however not all questions were answered by everyone; the number of respondents to each question = n. Before completing the questionnaire each participant was asked to consent to their data being used in this study, to which everyone consented.
The questionnaire was split into 5 sections:
- Participant demographic information and vulnerability
- Individual perceptions and actions
- Preparedness
- Knowledge
- Perception
4.3 Demographics
Presented here are the results from the first section of the questionnaire. This section analysis demographics of the participants to demonstrate some groups are more prominent in the data. For example, most participants were from the northwest. However, the techniques used seem to be suitable since there was a variety cross sections of regional and habitational data collected. (NB only percentages are shown within the graphs, the number of respondents to each are within the tables in appendix 3 with a breakdown of each question results).
- Gender
n = 74
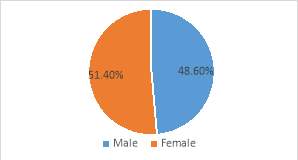
Figure 1. A graph of the gender of the survey participants.
The study received almost equal male to female ratio of respondents, with 51.4% female and 48.6% male.
- Age
n = 74
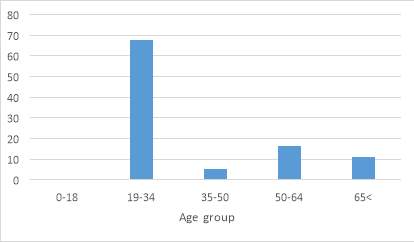
Figure 2. Age distribution of the respondents involved in the study
The majority of the respondents (67.7%) were within the age group 19-34, followed by 50-64 (16.2%). 65 and over took 10.8% of the participants with only 5.4% aged 35-50. No participants were 18 or below.
How the age is distributed is shown in figure 2.
- Marital status
n = 74
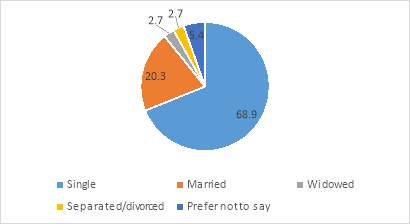
Figure 3. A graph of the marital status of the survey participants.
The majority of the respondents are single (68.9%) followed by married (20.3%). Both widowed, separated/divorced had 2.7%, while 5.4% chose not to disclose this information.
- Education
n = 74
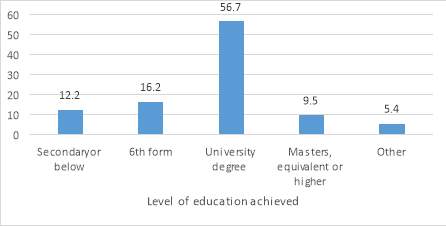
Figure 4. A breakdown of the level of education achieved by the survey participants.
Over half (56.7%) of the respondents had a minimum educational level of a degree of some sort, followed by 16.2% with 6th form, then 12.2% with a minimum level of secondary. 9.5% of the participants have achieved masters, equivalent or higher. 5.4% have ‘other’, presumably, this would be a qualification such as a diploma.
- Habitation place
n = 74
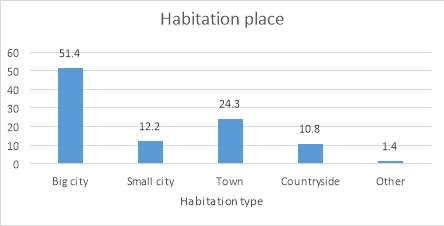
Figure 5. Percentage of respondents who lie within each habitat type, the percentage of people who chose each is included within the graph.
The type of residence a person resides in is influential in their perceptions. Most of the residence live in a big city (51.4%), the next most being a town (24.3%). This was followed by 12.2% of the participants who live in a small city, then 10.8% in the countryside. 1.4% chose other, this may be if they live in a village or hamlet, however, cannot be determined from the questions asked. The distribution of the residence of respondents is shown in figure 5.
- Region of the UK
n = 74
A large proportion of the survey participants were from the North-West of England (44.6%), followed by the second largest proportion from Yorkshire and the Humber (21.6%) and 12.2% from London or greater London. Few participants were from other regions of the UK as 5.4% were from the northeast, with 2.7% from west midlands, east midlands, East Anglia, the southwest, and southeast. 1.4% of the participants were from Scotland and Northern Ireland. This proves that the data sampling technique appears to be robust as a variety of regions were sampled from, however, it must be noted no respondents were from Wales.
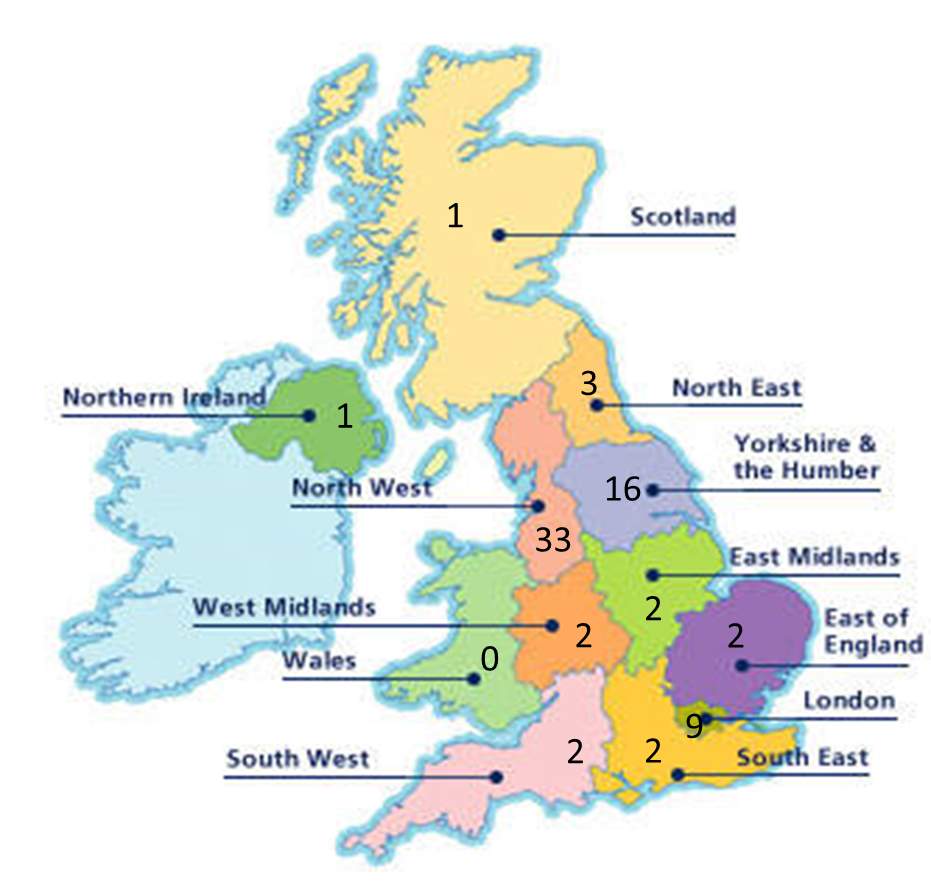
Figure 6. Map of UK regions, including the names of the regions and the number of respondents who live in each region. This was the same map given the questionnaire.
- Time lived in current region
n = 74
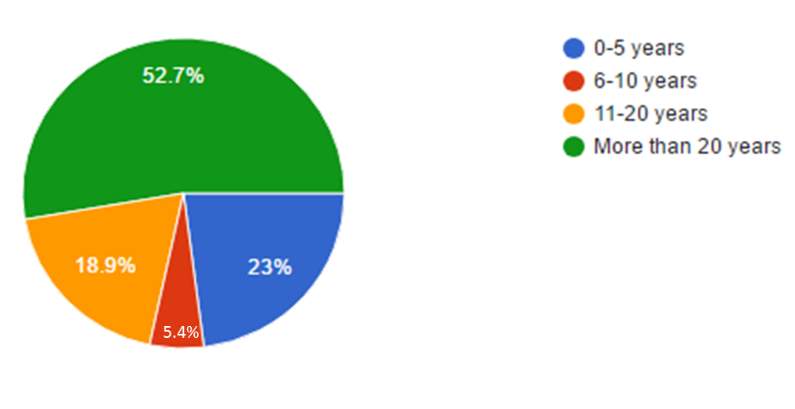
Figure 7. Visual depiction of the time each respondent lived in the region of habitation.
52.7% of the participants have lived within their current region for more than 20 years. The minimum amount of time spent living within a region is within the 0-5, this being the second most common (23%).
- Income
n = 73
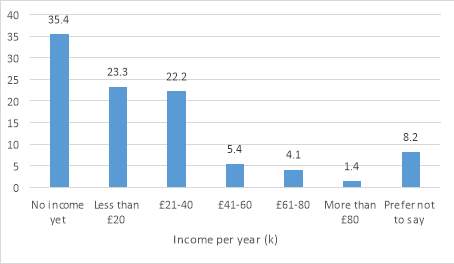
Figure 8. Income received annually by respondents. The data from this is an indication of the societal ‘class’ positioning of the respondents, as this may be a factor influencing
35.4% of the respondents stated they have no income yet, however, this is expected as most of the respondents were students (39.2%) as seen in figure 9. Less than £20 and £21-40 had similar results of 23.3% and 22.2% respectively. Each of the followings of £41-60 (5.4%), £61-80 (4.1%) and more than £80 (1.4%) had fewer respondents than the other groups. 8.2% of respondents chose not to disclose this information.
- Occupation
n = 74
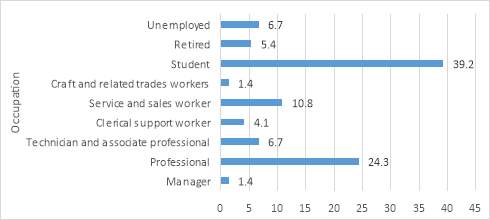
Figure 9. Coded results of the occupation of respondents. Occupations were coded using the ISCO classification.
As previously mentioned, most of the respondents were students (39.2%), followed by professional (24.3), the third most popular service and sales workers (10.8%). 6.7% of the respondents were technicians and associate professionals, 4.1% clerical support workers, while both craft and related trades worker and manager categories both received 1.4% respondents. 6.7% were unemployed and 5.4% retired.
4.4. Statistical analysis results
Below are presented the statistical results from the data analysis for which a relationship was identified. For each of the tested demographics of age, gender and education the Pearson’s Chi Squared tests which were conducted are presented with an analysis of the results. All were carried out using the SPSS programme. For each demographic being tested, the results and analysis are presented and briefly discussed.
The following chi squared tests were completed comparing demographic features of age, gender and education to; (1) how prominent a risk sinkholes were ranked and perceived to be by respondents (2) Where one looks for information (3) preparedness (4) UK media influence. This was completed to see what has the strongest relationship between demographics as a significantly influencing factor in risk perceptions. The crosstabulation tables of the tests that identified a relationship to the corresponding tables presented below can be found in appendix 5, full chi-squared tests completed not shown here are presented in appendix 6. The following sections demonstrate the results for each demographic of which relationships have been identified.
4.4.1 Age
UK media influence
Ha = age is proportionate to if one is influenced by UK media, the younger the individual the more likely they are expected to be influenced by media.
Hn = there is no relationship
Table 2. Results of the chi squared tests of age and if the media is an influencing factor, included is the symmetric measure results of SPSS results (SPSS, 2017).
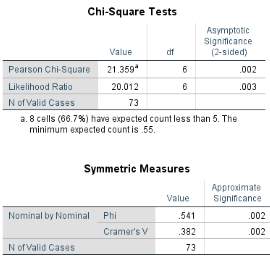
Pearson’s Chi-square statistic, X2 = 21.359, and p<0.002. The p value is less than 0.05 (p<0.002), therefore the Ha that there is a relationship is accepted.
Age appears to bare a relation to the media influences (p<0.002). Addressing to the crosstabulation table (appendix 5, table … ) a total of 57.5% of the participants admitted their opinions were influenced by the UK media images. Out of this 47.9% were within the age group 19-34, while only 5.5% were aged 50-64 and 1.4% aged 65+. Therefore the Ha is accepted.
4.4.2 Gender
Where one would look for information
Ha = gender is proportionate to where one looks for information relating to hazards within one’s local area
Hn = there is no relationship
Table 3. Results of the chi squared tests of gender and where respondents look for information and the symmetric measure results of SPSS results (SPSS, 2017).
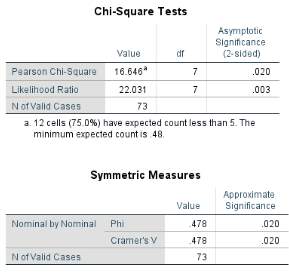
Pearson’s Chi-square statistic, X2 = 16.646, and p<0.02. The p value is less than 0.05 (p<0.02), therefore the Ha that there is a relationship is accepted.
Looking to the crosstablulation table (appendix 5, table … ) out of the respondents who would look to the radio for information (9.6%) all were male. Further, no females said they would look in a local newspaper. 50.7% of the respondents said their first instinct would be to look at the news or weather, out of this 27.4% were female.
Preparedness
Ha = gender is proportionate to if one prepares for a hazard.
Hn = there is no relationship
Table 4. Results of the chi squared tests of gender and whether one prepares for a hazard including the symmetric measure results of SPSS results (SPSS, 2017).
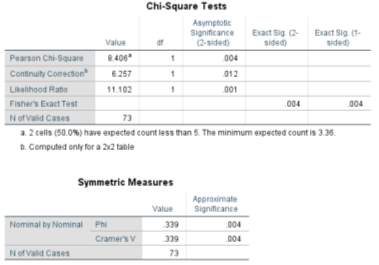
Pearson’s Chi-square statistic, X2 = 8.406, and p<0.004. The p value is less than 0.05 (p<0.004), therefore the Ha that there is a relationship between gender and if they were to prepare is accepted.
Addressing the crosstablulation table (appendix 5, table …) we can see that the most popular answer was no (90.4%) however those who had prepared for a hazard event (9.6%) were all male. This clearly shows there is no uniformity as to the gender preference of preparation to a hazard event.
UK media influences
Ha = age is proportionate to if one is influenced by UK media.
Hn = there is no relationship
Table 5. Results of the chi squared tests of gender and whether one is influenced by media including the symmetric measure results of SPSS results (SPSS, 2017).
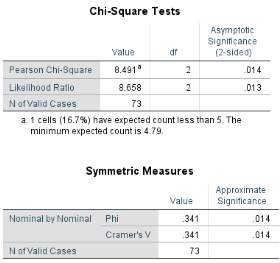
Pearson’s Chi-square statistic, X2 = 8.491, and p<0.014. The p value is less than 0.05 (p<0.014), therefore the Ha that there is a relationship between gender and if they were to prepare is accepted.
57.5% of the respondents said they were affected by the image of a UK sinkhole, 38.4% of these were females affected by the image, whereas the male responses of yes and no were evenly matched (19.2%). It is then accepted that media influence is influenced by gender.
4.4.3 Education
Preparedness
Ha = level of education is proportionate to if one prepares for a hazard event
Hn = there is no relationship
Table 6. Results of the chi squared tests of education and if one prepared for the event including the symmetric measure results of SPSS results (SPSS, 2017).
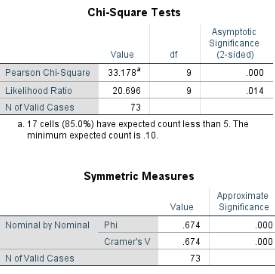
Pearson’s Chi-square statistic, X2 = 33.178, and p<0.001. The p value is less than 0.05 (p<0.001), therefore the Ha that there is a relationship between education and if they were to prepare is accepted.
7 respondents had prepared for a hazard event at some point. 100% of people of whom had prepared had a university degree, equivalent or higher. However, it must be noted that 39 of the 73 responses to this question had not prepared had a university degree or higher. Due to the small amount of respondent who had prepared, this cannot be deemed conclusive to a relationship between education and preparation.
4.5 Further analysis and observations
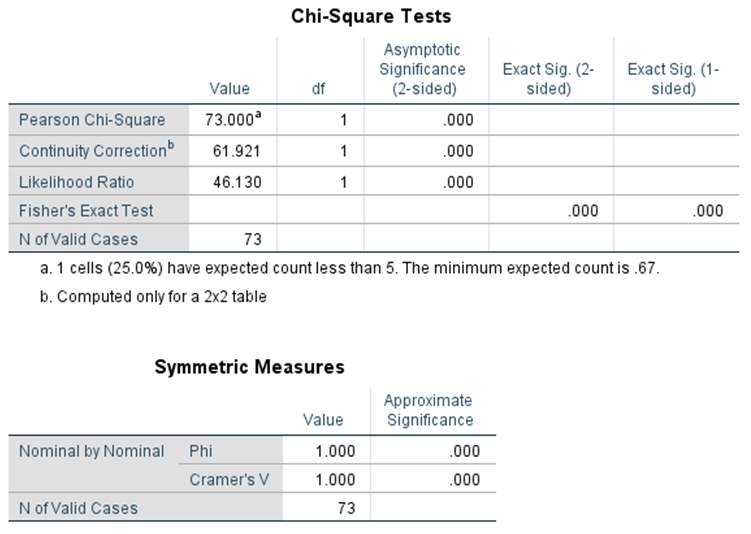
Following further analysis, it became clear that there were links and relationships apparent other than between the demographics and variables. For example, links were identified between those who had prepared and why that was. A chi-squared test comparing the preparation to the reason identified that there was a strong positive link between the two. The statistical test found p=0.001 identifying a strong link, with Phi = 1, proving a strong positive link (table 11). 100% of those who had prepared for the event of a natural hazard said the reason for that was that had previous experience with a hazard (mainly the hazard at which they had prepared for) yet all of these were also men.
Table 7. Chi squared test and symmetric measures comparing the relationship of who had prepared and why (SPSS, 2017).
Sinkholes were ranked at being both the easiest to cope with as well as the least risky. Table’s 13 and 14 shows the results from where respondents lived to if they believed the area they lived in could be at risk of a sinkhole (the actually risk the respondents were at).
Ha = region of habitation is directly proportionate to the perceived risk of sinkholes.
Hn = there is no relationship
This showed that were was a relationship between the two. Pearson’s Chi-square statistic, X2 = 34.920, and p<0.021. The p value is less than 0.05 (p<0.021), therefore the Ha that there is a relationship between region of habitation and perceived risk can be accepted.
Table 8. Chi squared test and symmetric measures comparing the relationship of the region of habitation and the perceived risk of sinkholes (SPSS, 2017).
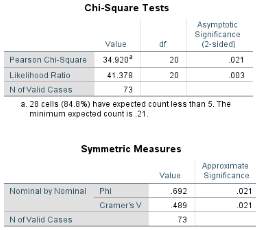
Despite only 21.6% believing the region within which they live could be at risk of sinkholes, most of the respondents live in the North-West and the Yorkshire and the Humber regions (44.6% and 21.6% respectively), areas which are at risk of sinkholes (refer to figure 1). How these is are perceived is minor and it appears many are unaware of the specific natural hazard of sinkholes.
5. Discussion
Disaster perception and the processes associated are notably different between individuals and as group perceptions are comprised of multiple individual’s perceptions the group perceptions are vulnerable to individual differences and influences. Throughout the study, it became clear that gender was the most influential factor as the most relationships were present between this demographic and features of the risk perceptions tested. It was expected that age would be just as, if not more, of an influential factor as gender however it has come to light that age is not as important as expected.
There was a clear relationship between age and the influences of UK media as well as a relationship present between gender and media, yet the relationship between ages and media was stronger as expected. The younger participants stated they would look to the internet as social media for updates and information, whereas the older populations relied upon radio and news, some even newspaper. With the growth of social media as a reliable source of updated and information, there is a movement in the crisis communications possible. Technology and societal adaptations and development have allowed for a branching out in the way researchers and disaster risk management professionals can propagate and interact with vulnerable and at risk populations (Veil et al, 2011). Smith (2010) found that 31% of adults online use blogs, social media sites, and other online resources, so for the younger adults and children who grow up in a community surrounded by these will inevitable become more reliant on these methods of information dissemination.
The media controls what information the public are presented with and through this their knowledge and attitudes toward risk, so the risk related information of which the media provide should be relatively maintained and objective, yet this is not always the case. Often within the media, hazards are overlooked. For example, on the 16th January 2017 within Sheffield, a sinkhole opened in the Decathlon car park within the city centre. The event was considerably unpublicised within the media as, despite a risk to the community, the damage was relatively minor as nobody was hurt in the event. In Manchester on 14th August 2015, a sinkhole, not unlike the one in Sheffield earlier this year in dimensions, opened on a main connecting road to the city centre. The event became highly publicised within the Manchester area as took over a year and £6m to fix. Despite 85.1% of respondents within the study saying they know what sinkholes are and having an understanding of the risks posed, only 58.1% identified the correct definition of sinkholes. Further, both of the regions within which these two sinkhole events occurred (the North-West and the Yorkshire and the Humber region) received the most respondents (44.6% and 21.6% respectively). However, when a closer look is taken as to if these participants are aware of the possibility of sinkholes there is a lack of the knowledge the respondents have. An increase in the media’s responsibility to addressing the risks within local areas may aid in addressing the issue of lack of knowledge.
Looking at the preparation of the participants also raised some interesting point, again highlighting the gender differences in risk perceptions. Out of the respondents who had prepared for the event of a hazardous even, 100% were male and stated their reasoning as prior experience. Viscusi (1991) and Swets (1978) were earlier discussed within chapter 2 as both expressed as how prior experience is vital to developing a risk perception of an event. One learns from their actions and repercussions of one’s decisions, an ideology backed up by this research, however, the limitations must be noted. The sample of this particular section is highly limited due to a small sample size (n=7 for how many respondents had prepared for a hazard event).
Two case studies will now be used to compare the results of the study as to how they fit into other counties and other hazard studies.
Public Disaster Perception in Western China (Zhou et al., 2003)
Zhou et al (2003) conducted a study of environmental perceptions the public held and the personality differences present within the Shaanxi Province of Western China. Within the study, the personality factors addressed were: age, gender, education, occupation and habitation (only the age, gender, and education will be fully discussed as these are what overlap within this study).
Zhou et al (2003) concluded that women’s risk perception were higher than of the males, however, deemed men to have a greater knowledge derived for a greater ‘multi-level society’ exposure, yet as males have a greater affinity to ignore the disaster information, their risk perceptions are reduced. On the contrary, females had the physiology and mentality to have a magnified fear of hazards and gain a higher risk perception. The conclusion of the male’s perspectives are similar to that of this study, as the males had a greater knowledge and awareness of hazards, conversely, the cultural differences here must be kept in mind. Within Western China the females aren’t exposed to the same social situations and span of knowledge as males (the multi-level social situations), this social bias is not as prominent with the UK as men and woman are exposed to the same social an educational situations. Age was also an influencing factor, adults had the strongest risk perception middle aged relatively average and the oldest participants had the weakest risk perceptions. Zhou et al (2003) found that young males had the strongest disaster perceptions. They deemed this to be that as young adults who are still within the education of sort (school, university) or recently left school, are more responsive to gaining more knowledge about disasters, further, these individuals’ perspectives can be more easily moulded by the wider community. The older one becomes, the more preoccupied one becomes with work and attentions move to other areas, leading to a reduced perception.
When applying this scenario to this research study there are similar patterns apparent. The younger respondents had a greater understanding and knowledge of sinkholes and the risk posed to themselves as well as the greater populations, fitting Zhou et al (2003) theory of age as an influencing factor.
The educational difference, as previously mentioned found that those more recently involved in education have a greater affinity for developing and understanding risk, gaining a stronger risk perception. This again resided in this study, as there was a strong positive relationship between the levels of education and preparation for hazardous events. 100% of those who had prepared for such an event had a university degree, furthering this idea that the closer to education you are, the stronger the level of risk perception one gain. Although the same limitation applies to the small sample size of those who had prepared for a hazard event.
Climate change and sinkholes
Climate change brings with it more extreme weather, for the UK this will mean more intense storms like those experienced in the winter of 2013-14 as well as the possibility of drought events. Within chapter 1, the effects of the extreme winters on sinkholes has already be briefly discussed, however droughts can be just as influential in sinkhole formation. Waltham et al (2004) and Dragoni & Sukhija (2008) highlight how
a fall in groundwater level may aid in the collapse of cavities, forming a sinkhole, an issue which will be most prominent in karst and limestone regions, causing an increase in the risks posed. This concept of drought increasing within drought situations was something recently tested in the Fluvia River valley in North-East Spain by Linares et at (2017).
case studies – how these fit to me
climate change?
6. Conclusion
Cite This Work
To export a reference to this article please select a referencing stye below:
Related Services
View all


Related Content
All TagsContent relating to: "Health and Safety"
Health and Safety is a set of regulations, policies, procedures, and guidelines that aim to prevent any accidents or injuries from occurring. Health and Safety procedures are essential to ensuring a safe, efficient working environment.
Related Articles

DMCA / Removal Request
If you are the original writer of this dissertation and no longer wish to have your work published on the UKDiss.com website then please: