Embodied and Operational Energy Analysis of Passive-house Building Envelopes
Info: 16518 words (66 pages) Dissertation
Published: 11th Dec 2019
Tagged: Energy
This study is a comparative assertion of five Passive House wall assemblies with the purpose of quantifying the lifecycle environmental and economic performance of each wall compared to a low energy baseline standard. A literature review summarizes and analyzes recent research concerning life cycle assessments (LCAs) of residential buildings for the purpose of comparing embodied energy to operational energy. Wood-framed walls were found to have a lower environmental and economic impact compared to other wall systems. Double stud walls in particular were found to be the most cost-effective option in all climates. An analysis of life cycle energy and the associated environmental impacts of a building’s exterior wall assembly can highlight opportunities for reducing energy and impacts, leading to the selection of more sustainable building components in the residential construction industry.
CONTENTS
1.0 Introduction
1.1 Building Energy Consumption
1.2 Embodied Energy
1.3 Passive House Dilemma
1.4 Passive House Characteristics
1.5 Scope of Work
2.0 Literature Review
2.1 LCA Methodologies
2.1.1 Process-based LCA
2.1.2 EIO-based LCA
2.1.3 Definitions
2.2 Energy Measurement Tools
2.2.1 Embodied Energy
2.2.2 Operational Energy
2.3 Variations
2.3.1 Variations in Scope Boundaries
2.3.2 Variations in Location
2.3.3 Variations in Year of Publication
2.3.4 Variations in Building Type
2.3.5 Variations in Building Material
2.4 Results of Literature Review
2.4.1 Process vs. EIO Methods
2.4.2 Low Energy vs. Standard House
2.4.3 EE% by Year of Publication
2.4.4 Building service life
3.0 Comparative Assertion of Five Passive House Wall Assemblies
3.1 LCA and LCCA: Goal and Scope
3.1.2 Scope
3.2 Case Study Descriptions and Inventory Analysis
3.2.1 Passive House Case Studies
3.2.2 Thermal Values
3.3 LCA
3.4 Operational Energy Analysis
3.5 Cost Analysis
3.5.1 Material Quantity Take-Off
3.5.2 LCC
4.0 Results and Discussion
4.1 Environmental Impact Assessment
4.2 Operational Energy Cost
4.3 LCCA
4.4 Contribution of EE on LCE
4.4.1 EE of Exterior Wall vs. Whole Building
4.4.2 Exterior Wall EE vs. LCE
4.4.3 Whole Building EE vs. LCE
4.5 Recommendations and Limitations of Study
5.0 Conclusions
6.0 Acknowledgments
1.0 Introduction
1.1 Building Energy Consumption
Nearly 39% of all energy consumption in the US is attributed to buildings [1]. The largest energy-consuming sector consists of residential buildings alone, which represents 26% of the final energy demand [2]. Due to concerns of anthropogenic climate change, a significant amount of building science research has focused on reducing the environmental impacts and improving the energy efficiency of buildings. Energy efficiency research has thus led to the development of high-efficiency appliances, HVAC systems, water fixtures, improved insulation and air-tightness of building envelopes, and other material technologies designed to reduce operational energy use. The building envelope has the greatest impact on life cycle energy (LCE) performance in residential buildings [14] and, thus, represents a grand opportunity to improve energy efficiency. Recent research has shown that by simply replacing a poorly insulated building envelope with a tighter, more highly insulative envelope can reduce operation energy consumption up to 50% [3].
1.2 Embodied Energy
Although some studies [8,37] conclude that operational energy (OE) has the highest impact in a building life cycle, other studies show that this represents only 40-60% of the total energy consumption of a house when all stages are considered from cradle to grave [34,36,21]. The remainder is attributed to embodied energy (EE), which represents the energy consumed during all processes of production, construction, and disposal of building materials and components. This includes the energy involved in the extraction, processing, and manufacture of raw materials, as well as transportation, assembly, use, demolition and end-of-life phases of a building life cycle. EE consists of two major components:
1) Initial EE: Initial embodied energy is the sum of the energy required for extraction and manufacture of a material together with the energy required for transportation of a material used for the initial building construction.
2) Recurring EE: The recurring embodied energy in buildings represents the sum total of the energy embodied in the material use due to maintenance, repair, restoration, refurbishment or replacement during the service life of the building.
Increases in EE often accompany efforts to reduce OE consumption, negating some of the reduction in energy achieved through a high-performance design. This effect is a result of the increase in quantity as well as energy intensity of materials required to produce high-performance envelope assemblies [21]. Therefore, as demand for low-energy building designs (i.e., Passive Houses) grows, the effect of embodied energy becomes increasingly more significant as its contribution to total life cycle energy (LCE) rises.
1.3 Passive House Dilemma
Passive House standards, which champion energy efficient solutions that result in reduced energy consumption [10], are widely recognized as a pinnacle in residential construction for good reason—research has shown that the operational energy consumption of the average Passive House is reportedly 3.6 times lower than the standard home [9]. Despite achieving remarkable improvements in operational energy consumption, however, Passive House standards address only the operational stage of building energy efficiency and may lead to an increased up-front energy demand at the manufacturing and construction stage. In fact, past research has demonstrated that Passive Houses do not always provide net energy savings and, depending on expected lifetime, can exhibit total lifecycle energy consumption that is similar to a newly constructed standard building [4,35].
The Passive House example illustrates an important now-or-later energy tradeoff facing residential building design and construction and motivates a need for a more holistic understanding of lifecycle energy consumption. In addition, the Passive House dilemma highlights a need to understand and negotiate the relationship between operational and embodied energy in high-performance residential buildings to achieve surefire reductions in total lifecycle energy efficiency.
1.4 Passive House Characteristics
The Passive House concept was originally conceived by Adamson and Feist [X] and resulted in the founding of the PassivHaus Institute in Durmstadt, Germany. The European metrics serve as a one-size-fits-all design target for all climates, requiring a combination of superior envelope insulation, airtight construction, efficient mechanical equipment, and heat recovery ventilation technologies [10].
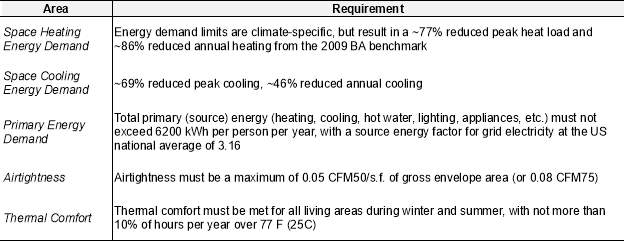
Alternative Passive House criteria were released in 2015 by Passive House Institute U.S. (PHIUS) for use in North America, as Straube found that in ASHRAE climate zones 5-7 in the U.S., the current European standard and its metrics were generally not economically justifiable and often led to poor design decisions [X]. The new criteria were therefore developed to modify the international requirements based on local climate factors and energy prices [X]. Because all Passive Houses studied in this paper are located in the U.S., PHIUS criteria is the standard used in this study for meeting Passive House requirements. Basic characteristics of PHIUS+ Certification are listed in Table 1.
Table 1. Characteristics of the North American Passive House according to PHIUS+ Certification
Additional requirements that apply to both European and North American Passive House standards generally require the following measures at a minimum in cold and temperate climates:
- Insulation: Opaque building envelope components should have a heat transfer coefficient (U-value) no higher than 0.09 Btu/h/ft2/F (R-11) (0.15 W/m2K).
- Windows: Window frames must be well insulated and fitted with low-e glazings filled with argon or krypton to prevent heat transfer. This generally means a U-value of 0.46 Btu/h/ft2/F (0.80 W/m2K) or less, with solar heat gain values around 50%.
- Ventilation: Efficient HRV is essential to enable good indoor air quality without energy waste. At least 75% of the heat from exhaust air must be transferred to the fresh air again by means of a heat exchanger.
- Thermal bridges: All edges, corners, connections, and penetrations must be planned and executed with great care so that thermal bridges can be avoided or minimized.
1.5 Scope of Work
The purpose of this study is to quantify the lifecycle environmental and economic performance of five Passive House wall assemblies in comparison to a low-energy baseline standard. First, a state-of-the-art literature review was conducted to analyze the methodology and scope of existing LCAs and compare EE data for a variety of building types, locations, and service lifetimes throughout the last decade. Second, a comparative life cycle assessment (LCA) was conducted to examine the tradeoffs of EE, OE and global warming potential (GWP) of each wall assembly. A life cycle cost analysis (LCCA) will also be taken into consideration as many Passive Houses are built on a larger budget than the average US home, limiting its reproducibility for lower income residential homes. As the building envelope is a key feature of energy efficient design, a study of Passive House wall assemblies will reveal various approaches for achieving a cost efficient, low impact design that can be used as a guideline for new construction.
2.0 Literature Review
A literature review was first conducted to analyze recent studies that have quantified the embodied and operational energy of residential buildings. A total of 84 case studies were investigated, categorized, and analyzed with respect to (a) LCA methodology, (b) year of study, (c) LCA scope, (d) building type, and (e) building lifetime on the calculated ratios of embodied vs. operational energy consumption.
Teach here.
2.1 Some title related to analysis of literature data.
The results from the comprehensive literature review are shown in Table 2 [A-Z].
Table 2. A summary of residential LCA results in literature
| Author | Year | Standard / Low energy |
Material | Life | Location | Life phases MCUE* | Process / EIO | EE % |
| Peuportier | 2001 | Standard | Wood | 80 | France | ME (not well specified) | Process | NA |
| Standard | Concrete | 80 | France | ME (not well specified) | Process | NA | ||
| Citherlet | 2007 | Standard | NA | NA | Switzerland | MCUE | Process | 14-17 |
| Low energy | NA | NA | Switzerland | MCUE | Process | 19-27 | ||
| Low energy (passive) | NA | NA | Switzerland | MCUE | Process | 40-50 | ||
| Thormark | 2007 | Low energy | Wood | 50 | Sweden | MU | Process | 60-75 |
| Fouquet | 2015 | Low energy (passive) | Concrete (cast) | 100 | France | MCUE | Process | NA |
| Low energy (passive) | Concrete (CMU) | 100 | France | MCUE | Process | NA | ||
| Low energy (passive) | Wood | 100 | France | MCUE | Process | NA | ||
| Verbeeck | 2010 | Standard | Wood, concrete | 30 | Belgium | MU | Process | 25-33 |
| Low energy | Wood, concrete | 30 | Belgium | MU | Process | 61 | ||
| Pal | 2017 | Standard (townhome) | Wood | 50 | Finland | MCU | Process | 19-20 |
| Low energy (townhome) | Wood | 50 | Finland | MCU | Process | 24-25 | ||
| Standard (townhome) | Concrete | 50 | Finland | MCU | Process | 17-18 | ||
| Low energy (townhome) | Concrete | 50 | Finland | MCU | Process | 22-23 | ||
| Standard (townhome) | Steel | 50 | Finland | MCU | Process | 16-17 | ||
| Low energy (townhome) | Steel | 50 | Finland | MCU | Process | 19-20 | ||
| Frenette | 2010 | Standard | Wood | 60 | Quebec, Canada | MCUE | Process | 30 |
| Kahhat | 2009 | Standard | Concrete (CMU) | 50 | AZ, USA | MCUE | Process | 5 |
| Standard | Concrete (cast) | 50 | AZ, USA | MCUE | Process | 5.1 | ||
| Standard | Concrete (insulated) | 50 | AZ, USA | MCUE | Process | 5.6 | ||
| Standard | Wood | 50 | AZ, USA | MCUE | Process | 4.5 | ||
| Standard | Wood | 50 | AZ, USA | MCUE | Process | 4.6 | ||
| Standard | Steel | 50 | AZ, USA | MCUE | Process | 4.6 | ||
| Monteiro | 2011 | Standard | Masonry | 50 | Portugal | MU | Process | 39 |
| Standard | Masonry | 50 | Portugal | MU | Process | 44 | ||
| Standard | Concrete | 50 | Portugal | MU | Process | 38 | ||
| Standard | Concrete | 50 | Portugal | MU | Process | 42 | ||
| Standard | Concrete | 50 | Portugal | MU | Process | 41 | ||
| Standard | Masonry, wood | 50 | Portugal | MU | Process | 41 | ||
| Standard | Wood | 50 | Portugal | MU | Process | 40 | ||
| Low energy | Masonry | 50 | Portugal | MU | Process | 76 | ||
| Low energy | Masonry | 50 | Portugal | MU | Process | 86 | ||
| Low energy | Concrete | 50 | Portugal | MU | Process | 73 | ||
| Low energy | Concrete | 50 | Portugal | MU | Process | 82 | ||
| Low energy | Concrete | 50 | Portugal | MU | Process | 78 | ||
| Low energy | Masonry, wood | 50 | Portugal | MU | Process | 78 | ||
| Low energy | Wood | 50 | Portugal | MU | Process | 77 | ||
| Huberman | 2015 | Standard | Concrete, steel | 50 | Israel | NA | Process | 47-57 |
| Standard | Masonry (Adobe) | 50 | Israel | MCU | Process | 53-58 | ||
| Standard | Concrete | 50 | Israel | MCU | Process | 54-67 | ||
| Shukla | 2009 | Standard | Masonry (Adobe) | 40 | India | MC | Process | 56 |
| Stephan | 2012 | Low energy (Passive) | Concrete | 100 | Belgium | MCU | Process I/O hybrid | 55 |
| Stephan and Crawford | 2014 | Low energy | Wood | 50 | Melbourne | MCU | Process I/O hybrid | 46 |
| Takano | 2014 | Standard | Wood | 50 | Finland | MUE | Process | 6.4 |
| Standard | Wood | 50 | Finland | MUE | Process | 10.6 | ||
| Standard | Concrete | 50 | Finland | MUE | Process | 9.2 | ||
| Standard | Concrete | 50 | Finland | MUE | Process | 8 | ||
| Standard | Masonry (brick) | 50 | Finland | MUE | Process | 8.4 | ||
| Standard | Steel | 50 | Finland | MUE | Process | 7.2 | ||
| Praseeda | 2016 | Standard | Masonry (soil, clay, brick) | 50 | India | MCU | Process | 10-80 |
| Standard | Concrete, Masonry | 50 | India | MCU | Process | 35 | ||
| Hernandez and Kenny | 2008 | Standard (insulation only) | NA | 50 | Ireland | NA | NA | 5-40% |
| Gustavsson | 2010 | Standard | Wood | 50 | Sweden | MU | Process | 45 |
| Low energy | Wood | 50 | Sweden | MU | Process | 60 | ||
| Ignacio Zabalza Bribian | 2009 | Standard | Brick | 50 | Spain | MU | Process | 31 |
| Blengini | 2010 | Low energy | Concrete, Masonry | 70 | Italy | MU | Process | 53 |
| Low energy | Concrete, Masonry | 70 | Italy | MU | Process | 52-58 | ||
| Zabalza | 2013 | Low energy | Clay | 50 | Spain | NA | Process | 43-45 |
| Berggren | 2013 | Low energy (passive) | NA | 60 | Sweden | NA | Process | 67 |
| Crawford | 2013 | Low energy (passive) | Wood | 80 | Belgium | NA | EIO hybrid | 56.9 |
| Low energy (passive) | Wood | 80 | Belgium | NA | Process | 13% | ||
| Leckner | 2011 | Low energy (ZEB w solar) | Wood | 40 | Canada | NA | Process | 100 |
| Low energy (ZEB) | Wood | 40 | Canada | NA | Process | 100 | ||
| Motuziene | 2015 | Standard | Masonry | 100 | Lithuania | MCUE | Process | 74 |
| Standard | Wood (log) | 100 | Lithuania | MCUE | Process | 74 | ||
| Standard | Wood | 100 | Lithuania | MCUE | Process | 74 | ||
| Cellura | 2014 | Low energy (ZEB) | NA | 70 | Italy | MCUE | Process | 68 |
| Thiers | 2012 | Low energy (Passive) | Wood | 80 | France | NA | Process | NA |
| Iddon | 2013 | Standard | NA | 60 | United Kingdom | NA | NA | 20-26 |
| Georges | 2015 | Low energy (ZEB) | NA | 60 | Norway | MU | NA | NA |
| Proietti | 2013 | Low energy (passive) | Concrete, Steel | 70 | Italy | MCUE | Process | NA |
| Maodus | 2016 | Standard | Masonry (brick) | 80 | Serbia | MCUE | Process | 66-68 |
| Standard | Wood | 80 | Serbia | MCUE | Process | 62-68 | ||
| Standard | Concrete | 80 | Serbia | MCUE | Process | 65-69 | ||
| Himpe | 2013 | Standard | Wood | 60 | Belgium | MUE | Process | 10-19 |
| Leckner | 2011 | Standard | Wood | 40 | Canada | NA | Process | 20 |
| Hacker | 2008 | Standard | Wood | 100 | England | NA | Process | NA |
| Standard | Concrete | 100 | England | NA | Process | NA | ||
| Kylili | 2016 | Low energy (passive) | Wood | 50 | Cyprus | NA | Process | 8-32 |
| Houlihan Wiberg | 2014 | Low energy (ZEB) | Wood | 60 | Norway | NA | NA | NA |
| Dahlstrom | 2012 | Low energy (passive) | Wood | 50 | Norway | MCUE | Process | 15 |
| Standard | Wood | 50 | Norway | MCUE | Process | 10 | ||
| Lutzkendorf | 2014 | Low energy (ZEB) | Wood | 60 | Norway | MU | Process | 60 |
*M = Manufacture, C = Construction, U = Use, E = End-of-life.
NA = Not available.
2.1 LCA Methodologies
LCA is defined as a method of environmental accounting that tracks the impacts and emissions of a produce (i.e., a whole building) throughout its life cycle, from material acquisition, production, construction, use, end-of-life, and disposal. Current standards on building LCAs include PCR 2014:02 [X], which provides guidance for Environmental Product Declarations (EPD) by defining the methodological framework, calculation procedure, and quality of data so that it is in accordance to ISO 14025:2006 [X]. It is based on the framework of ISO 14040, ISO 14044, EN 15978 and EN 15804. For LCA practitioners, ISO 14044, shown in Figure 1, details the steps in conducting a LCA, which includes (1) goal and scope definition, (2) inventory analysis, (3) impact assessment, and (4) interpretation.
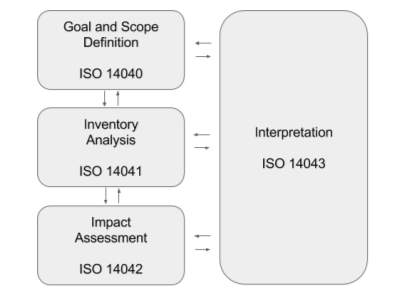
Figure 1. LCA framework according to ISO 14040
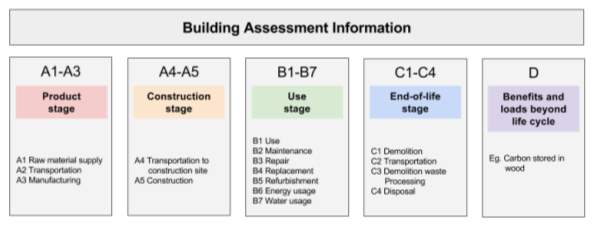
Figure 2. Stages of the life cycle of buildings according to EN 15804 [X]
As shown in Figure 2, LCAs can be used to investigate the impacts of different lifecycle stages using specific system boundary definitions, such as cradle-to-gate (i.e., building material production to construction), gate-to-gate (i.e., manufacturing-phase impacts only), and cradle-to-grave (i.e., whole building lifecycle). Many operational energy studies are, in effect, use-phase LCAs in which only the energy usage is quantified and reported (lifecycle stage B6).
In general, LCA methodologies can be classified into three main categories: (1) process-based LCA, (2) economic input-output LCA (EIO-LCA), and (3) hybrid LCA [27].
2.1.1 Process-based LCA
A process-based LCA methodology directly measures the impacts of material and energy flows to and from the environment. In calculating total energy demand, for example, process-based LCA systematically models the known energy inputs (and potential outputs) by utilizing a process flow diagram in each phase of the lifecycle. For buildings, this would include process, manufacturing, and transportation energy for all building products, construction energy, use-phase operational energy, and any post-use energy expended (or reclaimed). Given its ability to be intimately tied to specific data and, thus, very detailed in the environmental accounting, a process-based LCA approach has the advantages of very specific analyses, specific product (i.e., wood vs. steel) and manufacturing-method comparisons, and high-precision results. However, certain drawbacks, like limited access to data, subjective system boundary definitions, time, and cost, make accurate, replicable analyses quite difficult [X]. Thus, industry average data are often used in process-based LCAs, diminishing the potential advantages of the methodology. For more information and building-related results using process-based LCA analyses, the reader is directed to these other literature reviews on process-based LCA for the building industry [X].
2.1.2 EIO-based LCA
EIO-LCA calculates environmental impacts of a sector by linking the economic impacts of that sector’s total supply chain to national emissions and energy consumption [X]. Given that the foundation for the EIO-LCA model is the sector-by-sector economic interaction, the energy and environmental results calculated by the model are the mean value of goods and services provided in a given sector. Advantages of the EIO-LCA model lie in its comprehensive system boundary and other attributes, such as publicly available data, reproducible results, time efficiency, and cost savings. The disadvantages of EIO-LCA include (1) extremely high variability in EIO-LCAs for specific, individual goods and services, (2) time lag in reflecting current practices, and (3) dependency on high-fidelity data. In addition, EIO-LCA is incapable of presenting a complete cradle-to-grave LCA on building products, since the EIO databases fail to reflect their operation and end-of-life options. More information on EIO-LCAs, including in-depth reviews, is published elsewhere [X].
In LCA studies of buildings, the process-based approach is the most commonly used, while only a few EIO-LCA studies have been published [28-31,34-42]. Lesage et al. [X], made a comparison by using both methods to assess brownfield rehabilitation for residential developments and compared it to an exposure minimization scenario (i.e., covering the site with clean soil). Although the process-based method resulted in showing no preferable option, the EIO-LCA method resulted in data that supported rehabilitation of brownfields for residential reuse in order to avoid the development of suburban sites [29,30]. Franco [X] t compared LCA results of three residences calculated using EIO-LCA with process-based results from Keoleian et al. [X] and found that the estimated impacts were larger with the EIO-LCA method due to the inclusion of indirect effects in its system boundary. On the other hand, Vieira et al. [28] used both methods to assess the environmental impacts of concrete used in an office building, and concluded that there was no relevant difference between results from either method and that the choice between the use of one or the other for buildings may not be a critical decision.
2.1.3 Hybrid LCA
Hybrid LCA combines both process-based and EIO-LCA methodologies to create a hybrid methodology designed to take advantage of the strengths of the other methods. Hybrid LCAs reach a balance among system boundary, specialization of model applicability as well as time and cost efficiency. With hybrid LCA models, the embodied impacts of goods could be included with economy-wide scope, and impacts in the operation and end-of-life phases could be specifically analyzed [X] The advantages of the integrated hybrid model are the consistent mathematical framework for the entire life cycle, avoidance of double-counting, and application in analytical tools; the disadvantage is that it is data and time intensive [X]. Studies relying on the more comprehensive input–output-based hybrid analysis, which combines process and input–output data, have found that embodied energy requirements are generally higher than a simple process-based life cycle assessment [32].A study by Crawford on a residential building showed that values obtained from a process-based LCA could be up to 87% lower than values found using the EIO hybrid method[X]. This indicates that process-based LCAs may omit certain stages that contribute significantly to overall embodied energy. More detailed information on hybrid LCAs can be found elsewhere [refs].
2.1.4 Definitions
In addition to EE, OE and LCE, there are other types of energy that have been included in the system boundaries of building-related LCA studies. The different categorizations are defined below [24,38,39]:
- Primary energy: The energy of a fuel extracted directly from earth, such as fossil fuels. Also known as source energy. In regard to buildings, primary energy describes the total energy needed to produce a final energy service, including all inputs and losses along the energy chain (production, operation, end of life).
- Secondary energy: The energy generated by processing the primary fuels, such as electricity. Also known as delivered energy, or site energy.
- Feedstock energy: The potential energy embedded in a resource not used as an energy source.
- Demolition energy: The energy required at the end of the buildings′ service life to demolish it and to transport the material to landfill sites and/or recycling plants.
The inclusions and exclusions of energy type, especially if not specified, leaves the industry with published embodied energy values that are not comparable. Several studies, for example, do not mention whether the energy use they describe is primary or secondary energy, and some mix primary and secondary energy in their comparisons [16-20]. Pears asserts that the different information sources and inclusion of either primary or secondary energy could result in 30-40 percent variation in reported embodied energy, which emphasizes the importance of distinguishing between the two types of energy [19]. Feedstock energy is also only referred to in two studies, although assumptions of inclusion can be made depending on the LCI database source that was used [14,15,35].
It has been suggested that while measuring operating emissions is straightforward, determining embodied emissions is more complex [25]. Therefore in analyzing the percentage of embodied energy to total energy consumption, most authors convey their results as a range. This portrays the sensitivity of this value, due to a host of variables like the lifespan of the building, its geographic location and climate, and the types of materials used.
The process is further complicated by the fact that there is currently no generally accepted method available to compute embodied emissions accurately and consistently. Differences in methodology and scope alone contribute to wide variations in measurement. For example, some authors include the construction phase in their embodied energy assessment while others do not. Some also include stages of demolition as well as refurbishment and replacement, which according to Moncaster can comprise up to 26% of total embodied energy and can therefore, if omitted, lead to significantly underestimated values [40,41].
2.2 Energy Measurement Tools
2.2.1 Embodied Energy
A variety of LCA software tools and databases exist to provide assessments of embodied energy and other environmental impacts related to buildings. Most LCA software tools consist of a database of existing products or process-specific inventory data. The inventory data may be proprietary, from public data sources, or both. Variations are due to differences in location, data availability, time of research, and other inclusions and exclusions. Table 3 lists some of the LCA software tools and databases used in literature. Out of studies from the past 10 years that are reviewed in this paper, Ecoinvent was the most commonly used LCI resource. SimaPro, which integrates the Ecoinvent database, was the most commonly used LCA software.
Table 3. List of LCA software tools and databases used in existing literature
| LCA software tool / database | Description | |
| Ecoinvent* (Switzerland) | Recognized as largest and most consistent LCI database. More than 12,800 datasets compliant with ISO 14040/14044 | |
| GaBi** (Germany) | Widely used in Europe and North America. More than 700 datasets compliant with EN15804. Integrates multiple LCI databases including Ecoinvent and US LCI. | |
| EcoHestia (UK) | Developed by Sustainable Energy Research Group (SERG). Compliant with ISO 14040. Cradle to gate | |
| ATHENA** (Canada) | Only LCA-based tools in North America for whole buildings and assemblies. Provides LCA databases for cradle to grave impact | |
| SimaPro (Netherlands) | Widely used globally. Incorporates a number of LCIs including Ecoinvent and a number of impact assessment methods | |
| AusLCI* (Australia) | LCI database for Australia, currently with 460 datasets | |
| eTool LCA (Australia) | Launched late 2012. Database of Australian and international LCI EN 15978 compliant • | |
| IMPACT* (UK) | Specification and database to attribute environmental and cost info to items in BIM. For incorporation in other software packages. Currently integrated with simulation package (IES), plans for Impact for SketchUp. Compliant with EN15978 | |
| TALLY (US) | Released 2013. Plugin web app for Revit. Cradle to grave analysis. Integrates GaBi LCI database. Impacts in 5 categories reported in line with TRACI 2.1 – method used in North America. Does not include construction or operation. | |
| BEAT 2002 (Denmark) | LCA based inventory and assessment tool. | |
| BEES (USA) | A product level LCA tool developed by the EPA for product comparison | |
| US LCI* (USA) | Cradle to grave database is a collection of unit processes. Developed by NREL. | |
| ELCD* (Europe) | European Life Cycle Database. Released 2006. LCI database for EU. |
* LCI database
** LCA software tool with its own database
2.2.2 Operational Energy
While some studies utilized operational energy data that was obtained directly through utility bills, most researchers modeled operational energy using energy simulation software. Examples of software used in existing LCA literature are presented in Table 4.
Table 4. Operational energy modeling software used in existing literature
| Energy modeling software |
| CALENER |
| DesignBuilder (EnergyPlus) |
| TRYNSYS |
| GraphiSoft Eco Designer |
| BEopt (EnergyPlus) |
| eQUEST |
| OpenStudio (EnergyPlus) |
| EnergyPlus |
| Simien |
| COMFIE |
Some programs are more regionally relevant while others were chosen for being better suited for certain projects. BEOpt, for example, is suitable only for residential buildings less than 4 floors [X]. Some may have been used because it was the most comprehensive option available at the time of research. Even within the same program, newer updates with increasing complexity can provide more accurate values than older versions. Each program also makes its own assumptions and employs its own set of default parameters.
There seems to be no consensus on the most optimal software as there is no clear majority in any program. The variance in software may present an issue for comparisons in which operational energies are assessed across different energy modeling programs. However, the type of software used is likely not significant when comparing designs within the same software, as any trend that formulates will likely remain the same when modeled in other programs.
2.3.1 Variations in Scope Boundaries
One of the challenges to comparing LCA results is that all of the reviewed studies differ in its scope boundaries, level of simplification, completeness and transparency. A full evaluation of the environmental impacts of buildings will consider all phases of the building components including raw materials extractions, processing, construction, use, disposal/demolition, and all relevant transportation. Some studies examined a cradle-to-gate analysis, or a cradle-to-grave analysis, or even cradle-to-cradle for those that considered recyclability and reuse. End-of-life stages were sometimes excluded with the reasoning that it typically represents less than 1% of the total energy demand of a building [4]. There were several studies that did not specify exactly which phases were considered, or from where the materials were sourced [X,X, 36, 43]. Yet others did not specify the source of their Life Cycle Inventory (LCI) data, which could vary greatly with location [43].
2.3.2 Variations in Location
Geographic location is also a key differentiator between each study. Shaded regions in Figure 3 correspond to the number of studies conducted from the sources reviewed in this paper. Over 80% of the studies were conducted in Europe (48 in total with highest number of 5 in both Norway and Italy). Remaining studies were conducted from North America (5), India (2) and Australia (2).
Location of study contributes to variation in energy values due to differences in climactic zones, local energy sources, standards and policies, and availability and proximity of regional materials and technologies.
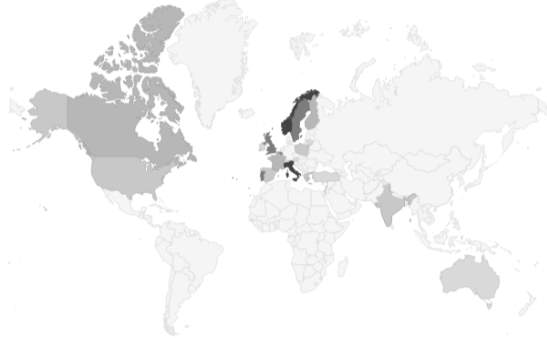
Figure 3. The distribution of locations worldwide in which building LCA was conducted
2.3.3 Variations in Year of Publication
Older publications have a higher tendency to omit crucial information, such as the life cycle phases considered within the system boundary or specification of LCA methodology [46-50]. A study by Optis in 2012 found that up to 60% of LCAs conducted in years 1996-2006 do not explicitly state the inclusions or exclusion of each life cycle stage within the system boundary, and 78% of the studies do not specify the calculation procedure used to obtain EE and OE values [56]. Some earlier studies also neglected to mention whether the measured embodied energy was primary or secondary energy, which according to Pears can cause up to 30-40% in variability [19, 51-55].
Additionally, software and databases such as Simapro, Ecoinvent and Athena that are commonly used to collect LCA data undergo continuous updates that improve quality of data, and thus more recent reports are likely to have a higher level of consistency and reliability.
2.3.4 Variations in Building Type
Commercial and residential buildings differ not only in specific embodied energy per area, but also in their range of possible values. A study by Dixit found that the mean of residential units’ embodied energy is 5.5 GJ/m2 and standard deviation is found to be 1.6 GJ/m2, while commercial buildings’ embodied energy figures demonstrate a mean of 9.2 GJ/m2 and a standard deviation of 5.4 GJ/m2 [46]. This indicates that commercial buildings show greater variability than do residential units in embodied energy terms.
2.3.5 Variations in Building Material
The typology of building envelope material varies greatly among residential buildings, depending on the typical local construction and availability of materials. Multiple studies have shown that a building with a wood frame envelope has the lowest embodied emissions and energy compared to those made with concrete, steel or brick [57, 59-61].It is worth noting that insulation material can have a significant effect on impact, although analysis by typology of insulation is considered outside the scope of this study [62].
2.3.6 Process vs. EIO Methods
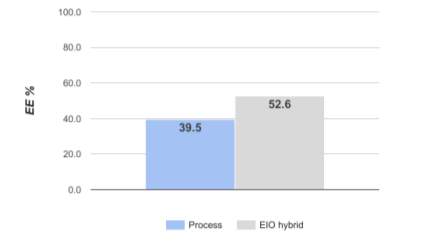
Figure 4. EE% of process vs. EIO hybrid methods
Figure 4 shows the difference in embodied energy results of two different LCA methodologies. The value of EE is calculated to be up to 14% higher on average using EIO-hybrid method than the process-based method. This supports the results of Crawford and Stephan, who similarly found that in their individual LCAs of residential buildings, the EIO-hybrid method produced higher impact results than the process-based method. This was because with the EIO-hybrid method, all the processes in the supply chain are covered and this results in a more complete system boundary.
2.3.7 Low Energy vs. Standard House
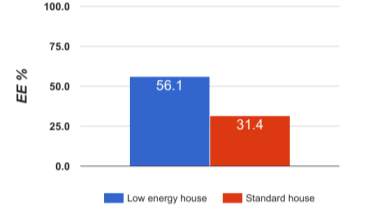
Figure 5. EE% of low energy construction vs. standard construction
The results shown in Figure 5 suggest that as the building industry aims toward “lower energy” homes, the contribution of embodied energy to total energy consumption rises. This is due to the fact that low energy homes have reduced operational energy, thereby naturally increasing the percentage of EE in the LCE. However, another consideration is that design strategies to reduce operational energy load in a building often results in an increased use of energy intensive materials, which drives up the relative EE. Nonetheless, standard homes are shown to have an embodied energy that is over 30% of the total energy consumption of a house over its lifetime, which is significant enough that the embodied energy of building materials should be considered carefully in design decisions.
2.3.8 EE% by Year of Publication
The fairly even distribution of EE values show in Figure 6 suggests that the data was generally consistent over the past decade.
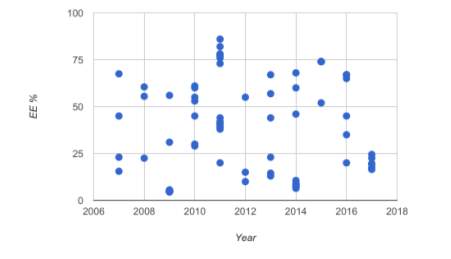
Figure 6. EE% by year of publication
2.3.9 Building service life
Figure 7 shows the service life of case studies ranging between 30 and 100 years with a median of 50 years. Although within the same case study, an increased lifespan generally leads to a decrease in embodied energy, it is difficult to draw a trend across multiple cases.
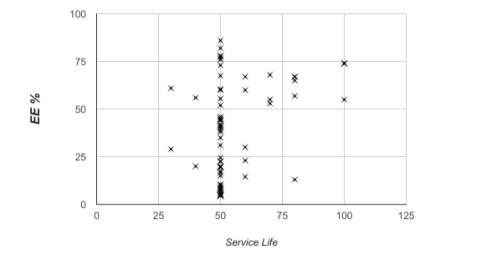
Figure 7. EE% by building service life
2.3 Challenges in LCA literature
From this literature review, it is apparent that several main challenges and opportunities exist in conducting LCA for X …. These challenges and opportunities include:
- One
- Two
2.4 Summary
This review analyzed 84 case studies of X for residential buildings over a 10-year horizon. While the existing body of literature is extensive and valuable, the lack of consistency within the scope and methodologies makes it difficult to draw definitive conclusions.
However, the results show that even conventional homes consume a large percentage (31%) of embodied energy due to the impact of energy intensive building materials. As the industry begins to move toward operational energy improvements, significant opportunities to optimize the life cycle energy efficiency of a building can be missed if the impact of construction materials is overlooked.
3.0 Comparative Assertion of Five Passive House Wall Assemblies
Introductory paragraph … “Second, a comparative life cycle assessment (LCA) was conducted to examine the tradeoffs of EE, OE and global warming potential (GWP) of each wall assembly. A life cycle cost analysis (LCCA) will also be taken into consideration as many Passive Houses are built on a larger budget than the average US home, limiting its reproducibility for lower income residential homes.”
3.1 LCA and LCCA: Goal and Scope
3.1.1 Goal
This study is a comparative assertion of five Passive House wall assemblies and a low-energy baseline and includes both a LCA as well as a LCCA. The objective is to investigate the environmental and economic impacts of the six chosen wall assemblies to assess the tradeoffs of the following measures:
- Embodied energy (EE), MJ
- Operational energy (OE), MJ
- Global warming potential (GWP), kg CO2e
- Life cycle cost (LCC = cost of materials + operational energy), $
Five of the wall types examined in this study are based on those used in existing Passive Houses and represent a variety of residential framing types, insulation materials and cost ranges. They will be compared to a typical wall assembly used in low-energy residential homes, which will serve as a baseline. Some of the walls were chosen for having received recognition in the Passive House community for quality and effectiveness of design. The results of this study can be applied to help inform decisions made by architects, engineers and green building community members regarding wall optimization.
Individual economic and environmental impacts notwithstanding, it should be noted that each wall assembly has its unique characteristics that has been specifically chosen for its local climate, codes, construction schedule and access to local materials.
3.1.2 Scope
The functional unit in a LCA is defined as the quantified performance of a product system, according to ISO 14040. In this study, the functional unit is a 2-story single family home with dimensions of 40’ x 20’ x 20’, south-facing, with 15% window-to-wall ratio on each elevation and an insulated roof (R-38), slab-on-grade floor (R-10) and a service life of 60 years. Doors and interior walls are also excluded. The only variation within the models will be the exterior walls of the building envelope, based on the wall assemblies used by a typical low energy house and 5 PHIUS+ houses. The economic costs, global warming potential, embodied and operational energy impacts of the various wall assemblies will be evaluated in four different US climate zones (CZ2, CZ3, CZ5, CZ6).
This study is a cradle-to-grave analysis and includes life cycle stages A-C according to EN 15804 (Figure 2), which encompasses all phases from raw materials extraction and processing through construction, use and disposal. All relevant transportation between each phase is also considered. Recurring embodied energy due to maintenance and replacement are not included as the building envelope is expected to last through its service life of 60 years. Construction schedule and its effect on LCC are also excluded.
Since the energy use of a building depends on local climate, the houses are modeled in a variety of regions. Four cities were chosen that represent the range of climates in the U.S.: Los Angeles, CA (CZ3), Orlando, FL (CZ2), New York City, NY (CZ5), and Minneapolis, MN (CZ6).
3.2 Case Study Descriptions and Inventory Analysis
3.2.1 Passive House Case Studies
The Passive Houses chosen for this study are the (1) Maple Leaf (Seattle, WA), (2) the Riversong (Maine), (3) the Isabella Ecohome (Isabella, MN), (4) EcoPanels, and (5) Passive House in the Woods (Hudson, WI). The baseline model for this LCA is a typical low-energy home based on the design of Flatirons Habitat for Humanity home construction based in Boulder, CO, which achieves LEED Platinum ratings. A summary of wall assembly characteristics is shown in Table 5 with a section layout in Figure 8.
Table 5. Summary of Passive House wall details for actual and modeled cases
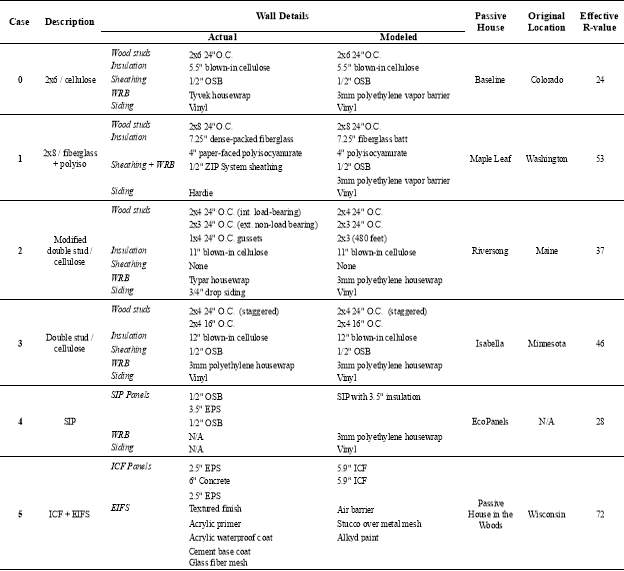
This study compares the different ways in which Passive Houses achieve high insulation and assesses the impact of its design from an economic and environmental standpoint. In analyzing the differences in cost, GWP, and EE of each wall assembly, adjustments were made to achieve greater comparability. The following building components were therefore included in all models:
- Vinyl siding for exterior cladding
- Interior finishes
- ½” gypsum wall board
- Vinyl paint
- Ceiling, roof and floor components
- R-38 attic insulation
- Asphalt shingles
- Foundation
- Slab-on-grade
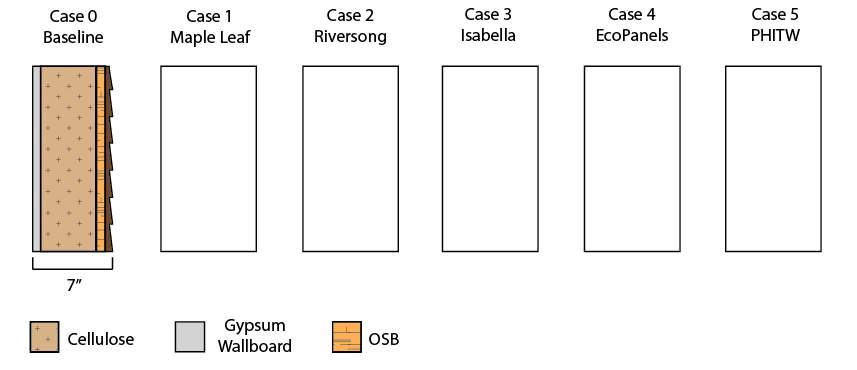
Figure 8. Wall assembly details (excluding studs)
Case 0: Baseline
House description: The baseline case is modeled after the low-income, energy efficient single-family homes constructed by the Flatirons Habitat for Humanity in Boulder, CO [X]. This wall assembly, according to the director of the Flatirons H4H program, was chosen for its ease of construction, low cost and insulation value of R-24 that exceeds the IECC standards for its local climate. The homes are built with volunteer labor and thus has high constructability and replicability. Additionally, the building achieves LEED Platinum ratings and thus represents a high-performance design.
Inventory Analysis: The main component of the DOW brand STYROFOAM Blue Board used in the actual house is extruded polystyrene, and thus 1” XPS was used to represent the Blue Board []. A thickness of 5.5” of blown-in cellulose was used due to the 5.5” cavity depth provided by the 2×6 studs. The cellulose was modeled as average density cellulose due to lack of dense-pack options in the ATHENA database. The data for the Tyvek housewrap used in this wall assembly was obtained from an externally verified EPD of 1060B, 1560B and 2460B Tyvek membranes (GWP = 0.477 kg CO2e/m2; EE = 8.07 MJ/m2) [X]. Tyvek tape was excluded from any environmental impact calculations but included for material costs.
Case 1: Maple Leaf
House description: The Maple Leaf Passive House is located in Seattle, WA and was built by Hammer & Hand and designed by Whitney Architecture [X]. The structure consists of a 2×8 stud wall to establish a thick wall cavity without the additional labor involved with a double stud-wall application. The air barrier is formed by the structural sheathing sealed at the panel’s edges. Siding is placed over a ¾” ventilation rainscreen cavity. The ZIP sheathing system provides an integrated weather barrier and sheathing in each panel, leading to a construction system that requires less time and labor than the conventional OSB sheathing with housewrap. The exterior rigid insulation consists of paper-faced polyisocynurate and has a vapor open covering so vapor can move out to the ventilated rainscreen cavity, or to the interior of the building. Insulation consists of a 3” paper-faced polyiso exterior insulation and 7.25” of dense packed fiberglass insulation. One advantage of this wall assembly is its use of standard materials and established trade practices, which makes it easy to replicate. Another benefit is the potential for reduced thickness due to the higher performing R-value of the exterior polyisocyanurate, which allows for larger interior space. This may be a highly valued quality to some homeowners.
Inventory Analysis: The R-3 ZIP sheathing system consists of expanded polystyrene (EPS) with an integrated engineered wood base and built-in barrier that acts as a housewrap [X]. In ATHENA, the ZIP material components were designated as 1” EPS, ½” plywood sheathing, and 3mm polyethylene vapor barrier. The 1×4 rainscreen was omitted. The impacts of ZIP tape is also omitted for this LCA, but included in material costs.
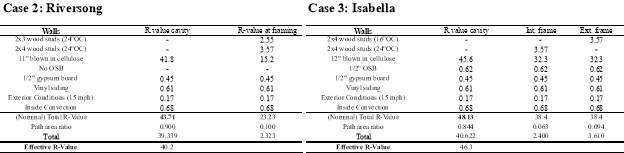
Case 2: Riversong
House description: The Riversong wall assembly was designed by builder Robert Riversong and based on the first house of this design built in Charlemont, MA in 1998 [X]. It is a modification of the Larsen Truss system and consists of a double stud wall in which the load bearing interior wall consists of 2×4 studs with 2×3 studs as the non-load bearing exterior wall and 1×4 gussets attached horizontally between the two frames for stabilization. All studs and gussets are spaced at 24” O.C. The cavity is filled with dense-pack cellulose. A unique characteristic of this wall assembly is its lack of exterior wall sheathing. According to Riversong, the air-tight drywall system with a full ¾” drop siding over the housewrap eliminates the need for exterior wall sheathing.
The wall assembly is claimed to have an R-value of 40 for a thickness of less than 1 foot, using “no more lumber than what is used in a conventional 2×6 house.” The double stud wall system eliminates thermal bridging, which is problematic for single stud wall designs. The disadvantage of this design is that it is relatively new (less than 20 years old) and there is little record of houses using this system that can provide data confirming durability and effectiveness.
Inventory analysis: Tyvek housewrap was assumed for the wall assembly and thus the Dupont EPD was used for LCI data. Double stud framing was modeled as two sets of 2×4 24” O.C. walls, with one set load bearing and other non-load bearing. The 1×4 gussets were designated in ATHENA as 1×4 pine siding for a quarter of the model’s wall area, which overestimates its environmental impacts. The dense-pack cellulose was designated as average density cellulose in ATHENA.
Case 3: Isabella
House description: The Isabella Ecohome designed by Compass Rose Designs is a LEED Platinum home built in 2010 and located in Northern Minnesota where the average annual temperature is 38.5F [X]. The house incorporates extensively monitored assemblies including electrical storage, rainwater catchment, and both liquid and solid seasonal heat storage. The exterior wall consists of staggered double stud wall framing filled with blown-in cellulose. It has a heavy timber frame roof and an insulated concrete floor to provide thermal mass. This house achieves the European Passive House standard with an air-tightness of 0.6 ACH50.
Inventory analysis: Housewrap was modeled using Tyvek EPD data. As in Cases 1 and 2, dense-pack cellulose was designated as average density cellulose in ATHENA. The double stud wall framing, like Case 2, was modeled with two sets of 2×4 studs. One set was spaced at 24” O.C. while the other was spaced at 16” O.C. and the cavity was filled with 12” blown-in cellulose.
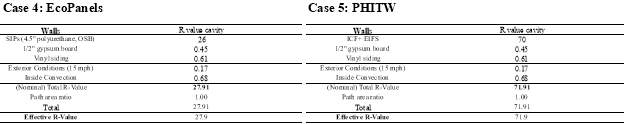
Case 4: EcoPanels
Product description: Case 4 is not a Passive House but rather a SIP product recommended by the manufacturer as a building material designed for effective use in Passive House construction. The R-26 EcoPanel is 4.5” thick, with polyurethane foam core sandwiched between OSB sheathing [X]. Metal locking devices are embedded on each vertical edge to secure the panels together. The insulating foam reportedly has an R-value of 7 per inch when measured at 52°F, implying an approximate insulation thickness of 3.5” for the R-26 EcoPanel. Additional exterior surfaces can be OSB, fiber-cement , galvanized stainless steel, fiber-reinforced plastic, various sidings, or other structural materials. For this study, no exterior surface was modeled as it’s an optional feature. One of the main advantages of EcoPanels is its reduction in construction time and labor costs. However, the material cost is relatively high compared to other wall options, with a price of $295 per 4×10 panel.
Inventory analysis: The SIP system was modeled in ATHENA as a SIP with an insulation thickness of 3.5”, which is comparable to the actual product. Conventional SIP systems consist of an EPS insulation core, while EcoPanels use the less standard closed cell polyurethane foam. It is not clearly specified in ATHENA, but it is assumed to reflect values for EPS insulation. However, polyurethane has embodied energy and carbon emissions that are approximately 20% greater than that of EPS (Bath ICE v2, 2011), so the LCA results likely underestimate the actual impact of EcoPanels.
Case 5: Passive House in the Woods (PHITW)
House description: Built in 2010 and designed by TE Studio, the Passive House in the Woods was the first certified Passive House built in the state of Wisconsin [X]. Designed to be “carbon-neutral”, the PHITW has its own renewable energy system and exceeds European Passive House space-conditioning requirements by 30%. The exterior wall consists of a 11” ICF layer on the interior with a 11” Sto EIFS facade on the exterior, for a total thickness of 22” and a R-value of 70. The ICF system is 6” of concrete sandwiched between two layers of 2.5” EPS with polymer ties. The ICF system was used due to its high thermal mass, its durability, and its naturally low infiltration rates. Other additional insulation around the building envelope includes 14” polyisocyanurate in the roof (R-95) and 12” of EPS under the slab (R-60). The high energy efficiency of this building has attracted national media attention and is featured as a case study in the PHIUS website [X].
Inventory Analysis: The 11” ICF wall was modeled in ATHENA as two sets of 5.6” ICF systems. The Sto classic continuous insulation EIFS system consists of a waterproof air barrier, a drainage cavity, continuous EPS insulation of varying thickness, and a textured finish. This was modeled in ATHENA with an air barrier, EPS insulation, and stucco over a wire mesh. As the bulk of the EIFS system is due to the thickness of the EPS insulation, the assumed thickness of EPS was 9”. This is reasonable with the assumption that the 5” of EPS in the ICF system provides roughly R-25, which means that the EIFS should supply the remaining R-45. With its R-5/inch thermal value, this results in a thickness of 9”.
3.2.2 Thermal Values
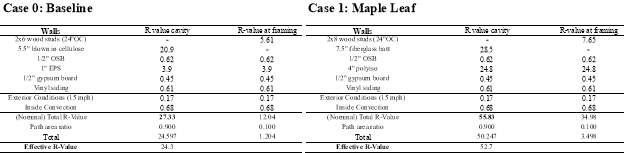
The total R-values determined for each wall were based on the insulation values provided in Table 6 [X].
Table 6. R-values of insulation
The effective thermal value of each wall assembly was then calculated to account for different framing types, convective air currents and additional wall components in Table 7. The effective R-values for single stud walls are lower than those of double stud walls due to the elimination of thermal bridging in the latter.
Table 7. Effective R-values of case studies
3.3 LCA
LCA software tool ATHENA Impact Estimator was used to quantify the embodied energies and carbon emissions of building materials. Substitutions were made where specific product types were not available (Table 5). In its LCA calculations, ATHENA follows a process-based method and uses a proprietary database developed by ATHENA Sustainable Materials Institute as well as the US LCI database developed by NREL. This database uses only North American values and is compliant with ISO 14040/14044 unit processes related to basic materials, building products and components, fuel use, and transportation. All data is reportedly less than 10 years old.
Each wall assembly designed in ATHENA also includes the impact of fasteners (nails, screws, staples), paints, adhesives, sealants, and other necessary construction details that are not included in cost estimations. The software is also regionally sensitive, and applies the appropriate electricity grids, transportation modes and distances, and product manufacturing technologies depending on the building location. Transportation impacts of each wall component are typical weighted averages of the distances from which materials are sourced and includes different modes of transportation (diesel road, diesel rail, RFO barge, RFO ship). The software reports footprint data for a variety of environmental impact measures consistent with the latest US EPA TRACI methodology, and includes the impacts of the following life cycle stages: resource extraction and recycled content, material manufacturing, related transportation, on-site construction, maintenance and replacement effects, demolition, and disposal. The disposal analysis considered the environmental impacts of the building materials due to the dismantling and deconstruction of the house after its service lifetime. Materials, quantities, and processes were the same as those used to assess the manufacturing stage.
According to the 2016 ATHENA Impact Estimator User Guide, LCA results should be viewed with a 15% margin of error perspective; thus, a comparative impact measure difference of 15% or less between two design scenarios should be considered to be equal or insignificant[2].
3.4 Operational Energy Analysis
Energy simulation program BEopt was used to estimate operational energy use, BEopt is a residential building based graphical user interface for EnergyPlus, developed by the National Renewable Energy Lab (NREL). The program calculates energy use as a function of building envelope options as well as HVAC equipment options. Appliance and lighting option energy savings are calculated based on energy use intensity (EUI) factors and schedule inputs. TMY2 weather data in four different US cities was used for all simulations.
The operational energy as a result of heating and cooling is collected as source energy data (converted from evaluated energy using a conversion factor of 3.4) and thus includes the embodied energies associated with the extraction, proves, transportation and combustion of the electricity and natural gas used as an energy source. It excludes the impacts associated with manufacturing, transport, maintenance and disposal of the central heating boiler and air conditioner. The cost of energy consumption, which factored into the LCC of each model, were calculated based on average 2017 Colorado prices of residential gas usage ($1.95/therm) and electricity ($0.10/kWh) [X]. Annual operational energy of the building is assumed to be the same in future throughout its service life.
The BEopt model of the reference building is described below:

Figure 9. Reference building modeled in BEopt
As shown in Figure 9, the reference building is a 2-story house with a 40’x20’ footprint, a total height of 20ft and a living space of 1600ft2. It has 3 bedrooms and 2 bathrooms. The foundation is slab-on-grade with the highest available insulation with R-40 XPS placed horizontally below the entire slab area with R-10 XPS placed at the gap between the edge of the slab and foundation wall. The floor was set as a wood surface with a ½” drywall in the exterior and interior partition walls as well as the ceiling. The attic is insulated R-38 cellulose (Gr-1, vented). Roof consists of medium asphalt shingles. There is 15% low-e, low gain, triple paned and air-filled glazing on each wall, with 0.5 interior shading in summer and .95 in the winter. Infiltration rates are set at 0.74 ACH50, which meets the PHIUS+ standard of 0.05 cfm50/ft2 of gross envelope area.
The heating source is a natural gas furnace with an efficiency of 98% AFUE. The air conditioner is a variable speed split-system with a SEER 24.5 rating, the highest available efficiency below an “ideal AC” system. Mechanical ventilation uses an ERV with an efficiency of 72%. Natural ventilation is used everyday during cooling months. The duct system experiences 7.5% leakage and is insulated up to R-8. The thermostat setpoints are 78°F when occupied with a setback of 85°F when unoccupied for cooling, and 70°F when occupied and 62°F when unoccupied for heating, based on recommendations by ENERGY STAR. Occupancy schedule is shown in Table 8.
Table 8. Occupancy schedule for heating and cooling setpoints

Electricity was used for cooling as well as the domestic hot water system, which is an electric tankless heater. A solar water heater with an area of 64ft2 is mounted on the south roof at a 26.6° tilt to provide hot water through passive solar heating whenever possible. Lighting was provided by 100% LEDs, using 792 kWh/year. All other miscellaneous plug loads, appliances, and fixtures were excluded (default setting).
Each case study had identical models and differed only by its exterior wall assembly, which was modeled based on the assumptions made in Table 3.
3.5 Cost Analysis
3.5.1 Material Quantity Take-Off
GoldenSeal Estimating Software was used to quantify the material costs of each wall assembly, listed in Table 9.
Table 9. Material quantity take-off of wall components
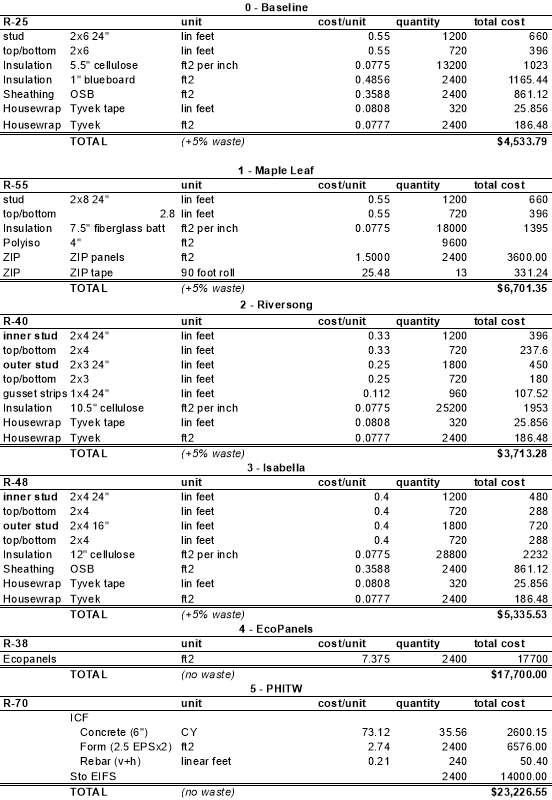
An additional cost of $86,550 was added to each wall assembly to account for the remainder of the building for the financial analysis. These costs include materials for ½” drywall on every interior surface including the ceiling, alkyd solvent based paint, framing for interior partition walls (240 feet total length), a 6” thick foundation slab, 2×10 floor and ceiling joists, ½” OSB sheathing for the floor and roof, a wood surface floor, asphalt shingles, 10” cellulose insulation in the attic, and 2” EPS insulation below the slab.
3.5.2 LCC
The LCC of each house is calculated as the sum of initial cost (materials) and energy cost (operational energy over a period of 50 years). The analysis takes into account a number of economic parameters such as interest, inflation, and tax rates. The following equation (1), recommended by Krarti [X], is used to calculate LCC:
LCC=IC+USPWd,N× AC (1)
where IC is the initial cost, AC is the annual energy cost, and USPW(d,N) is the uniform-series present worth factor based on a designated discount rate, which represents the effective interest rate that includes the impact of inflation and taxation. In this study, the assumed discount rate (d) is 5% and the years of service life (N) is 50. The USPW(d,N) allows us to determine the ratio of initial investment (P) to cost savings (A) based on service life years and the discount rate, and is expressed as follows:
USPW(d,N)=PA= 1+dN-1d1+dN (2)
This LCCA method is the most commonly accepted method to assess the economic benefits of energy conservation projects over their lifetime. [Krarti]
4.0 Results and Discussion
4.1 Environmental Impact Assessment
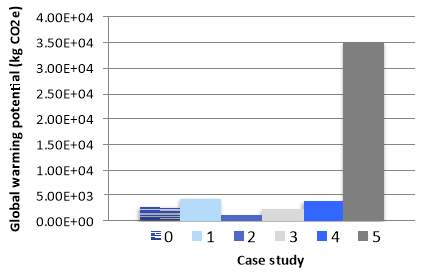
Figure 10. Average GWP of wall assembly
An initial assessment of the five Passive Houses and the baseline shown in Figure 4 illustrate that the wood-framed walls in Cases 1-4 generally have lower impacts compared to the SIP or ICF wall systems in Cases 4 and 5. The double stud walls (Cases 2,3) show the lowest impact of EE and GWP of all assessed Passive House walls. The double stud walls are also insulated with cellulose, which despite its relatively high thickness (11” and 12”) have a much lower EE and GWP compared to the insulation materials used in the other four cases.
Case 5 was also shown to have embodied energy and embodied carbon that is 4 and 7 times greater, respectively, than the next highest case (Case 1: Maple Leaf). The main component of the Case 5 wall assembly consists of ICFs. The high carbon emissions associated with the production of concrete is likely responsible for the disproportionately large impact of the ICF wall. Ordinary portland cement (OPC) typically contributes over 50% of the embodied energy in concrete. This is largely due to the calcination process in which limestone, clay and sand are heated at extremely high temperatures to form clinker.
The additional layer of EIFS, which included 9” EPS, will also have contributed to total EE and GWP. The high thermal mass of ICF contributes to reducing operational energy; however, it is not enough to offset the high embodied energy associated with its production. A previous study by Marceau and VanGeem showed that at lower thermal values, ICF walls can have a lower LCE than wood-framed walls [X]. The analyzed R-values in that study were R-12 for the wood system and R-18 for the ICF system, and in all climates ICF walls showed a higher EE but the OE was reduced such that the LCE was lower in each case. The results of this study, by comparison, show that there is a limit to the efficiency of ICF walls and that when the system reaches a certain insulation value, ICF walls are no longer a the least impactful building envelope option.
4.2 Operational Energy
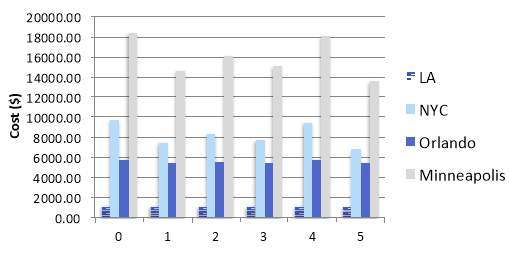
Figure 11. Operational energy cost in different climates
In mild or cooling dominated climates, a thermal wall value above R-24 has little impact on energy reduction. In LA, the difference in OE was negligible and varied only by 3%. In Orlando, the energy load increases by over 5 times, which was due almost entirely to cooling loads. However, the savings between the highest and lowest OE is only $244 over a 50 year service life, suggesting that in cooling dominated climates, increasing the thermal value above R-24 is not very cost effective. In colder climates, however, the models demonstrate more sensitivity.
In NYC, where heating loads increase, the difference in OE across various wall types becomes more significant, and the range in savings from the baseline increases to $2846. Minneapolis- the coldest climate assessed in this study, offers the greatest range of savings in OE, with a difference of $4799 between the baseline and the lowest OE option (Case 5).
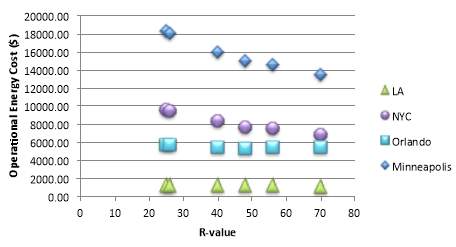
Figure 12. Operational energy cost by R-value
Figure 12 show how OE correlates with R-value, and as expected, operational energy costs decreases with increasing R-value in heating dominated climates. The results also suggest that the colder the climate, the more effective increased R-values achieve reductions in operational energy. For Case 5, the high thermal value of ICF walls also contributes to reduced OE costs. A lighter weight material with the same R-value would likely perform much less efficiently. Diminishing savings can also be observed in Figure 12, suggesting that beyond a certain R-value, further investments in increasing insulation are neither practical nor cost-effective depending on the climate. Maximum savings in LCE as a result of R-value are observed for colder climates, whereas in milder or hotter climates, the impact is minimal.
4.3 LCCA
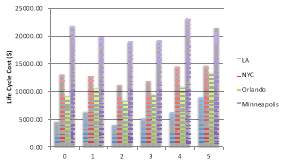
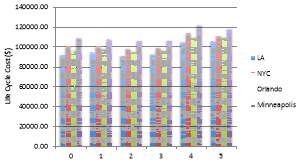
Figure 13. Life cycle cost of wall type in different climates (a) and (b) …
Figure 13a shows the LCC of each case study in various locations. In any given climate, the double stud walls represented by Cases 2 and 3 have the lowest LCC. For the double stud walls, both initial costs and OE costs were relatively low due to the affordable price of cellulose insulation, the only major contributor to thermal value in both cases. The initial cost of Case 2 is lower than Case 3 due to its omission of OSB sheathing in the assembly. Double stud walls notwithstanding, the baseline model and Case 1 trade off in cost efficiencies depending on the climate. This implies that the investment in insulation for Case 1 is worthwhile only in colder climates as the higher initial cost is offset by lower OE costs over the building’s service life. Similarly, despite the relatively low initial cost of the baseline model, the lack of insulation results in a high energy consumption over its lifetime, leading to a LCC nearly $2000 higher than that of Case 1.
The results further illustrate that the non-wood frame assemblies such as SIPs and ICFs are not cost effective in any climate. This does not imply that SIP and ICF walls are poor options compared to wood-frame walls; it only suggests that above a thermal value of R-24, these wall systems become a much less cost effective option. Moreover, it is important to note that initial costs considered only material prices and excluded any construction labor. An inclusion of the full construction process may reveal that high material costs, for example in the case of the SIP system, can be offset by reduced construction costs.
4.4 Contribution of EE on LCE
4.4.1 EE of Exterior Wall vs. Whole Building
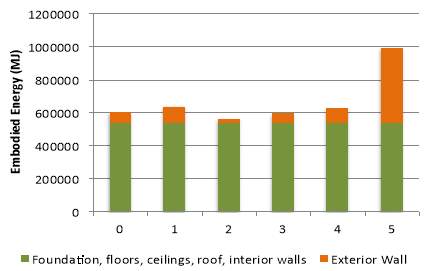
Figure 14. Embodied energies of exterior wall and whole building for different wall assemblies
The contribution of embodied energy of the exterior wall assembly to total building embodied energy is shown in Figure 14. On average, the percentage of envelope EE compared to the whole building EE is 17%. The envelopes of the double stud walls have the lowest EE percentage in the 5-10% range, while ICF walls have has the highest contribution at 44%. Excluding the ICF wall system, the average EE of envelopes compared to whole building EE is 11%. The EE of the remainder of the building is due to the additional wood materials required for floors, ceilings, interior walls and roof, as well as the insulation in the roof and slab, and finally the slab itself, which consists of 400ft3 of concrete.
4.4.2 Exterior Wall EE vs. LCE
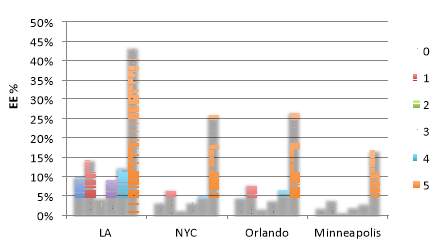
Figure 15. Contribution of exterior wall EE to LCE
Figure 15 illustrates the contribution of embodied energy from just the exterior wall to total LCE of the building. Results showed that the EE of the exterior wall alone accounts for 16% of total LCE in mild or cooling dominated climates and 5% in heating dominated climates. The ICF wall has the greatest contribution to EE, ranging from 17% in Minneapolis to 43% in Los Angeles, whereas double stud walls dropped to as low as 1% in Minneapolis.
4.4.3 Whole Building EE vs. LCE
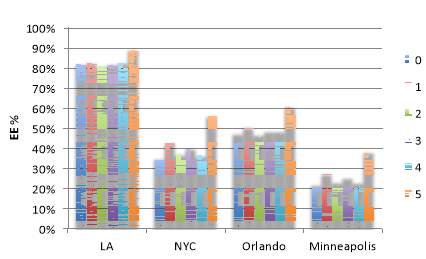
Figure 16. Contribution of whole building EE to LCE
The average ratio of EE to LCE of the whole building is shown in Figure 16.
For each location, the percentage of EE ranged from 27% in Minneapolis to 83% in Los Angeles. Location has a greater impact on the EE:LCE ratio than the type of wall assembly. This implies that in mild or cooling dominated climates, there is great potential for total energy reduction if buildings are designed with careful consideration of the EE associated with building components. In colder climates, the ratio of OE increases and the use phase becomes more significant; however, with an average of 27% in one of the coldest climate zones, EE remains a significant fraction of total LCE.
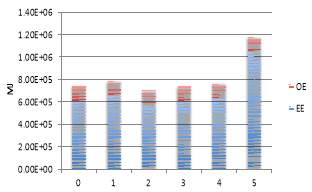
Figure 17. LCE of case studies in Los Angeles 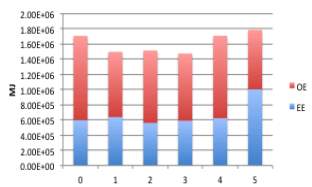
Figure 18. LCE of case studies in New York City
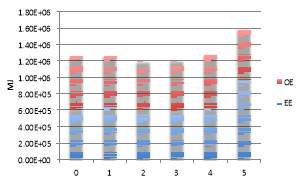
Figure 19. LCE of case studies in Orlando
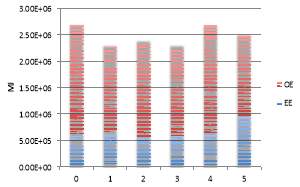
Figure 20. LCE of case studies in Minneapolis
Figures 17-20 show the ratio of EE to OE for the total energy consumption of each case study in four different locations. LCE differs from the previously assessed LCC in that instead of comparing the initial and final operational costs associated with each wall system, it considers only the initial and final energy consumption.
In LA, the differences in LCE are minimal between Cases 0-4. However, Case 5 with the ICF wall system stands out with a LCE approximately 40% higher than the average case. In Orlando with higher cooling loads, the discrepancy between the ICF wall and the rest is reduced to a 25% increase with close to a 1:1 ratio of EE to OE. In both NYC and Minneapolis, Cases 2 and 4 are presented as the lowest LCE options. The LCE of Case 5 is lower than either the baseline or Case 4 in Minneapolis, suggesting that in the coldest climates, the high EE of ICF walls can result in a lower LCE compared to standard low energy construction.
A comparison of LCEs also highlights the fact that Case 3, which was otherwise analyzed as the most cost effective and least impactful option in any given location, was not the lowest LCE wall system in colder climates. Instead, Cases 2 and 4 indicated that in heating dominated climates, investing in high thermal insulation pays off with the lowest LCEs over its lifetime. However, it is important to note that the initial cost of Case 2 is relatively high, and the LCCA conducted previously indicated that Case 2 is only the third most cost efficient option in colder climates. This suggests that using only a LCE analysis for decision-making may be misleading, as this excludes initial costs. It is a much more meaningful metric where finances are concerned to consider a LCCA as well as a LCA to help inform decisions.
4.5 Recommendations and Limitations of Study
There are several limitations in this study that building designers and decision makers should take into consideration. Some metrics were ignored that may affect the reliability of these results.
1) One of the omitted details is the actual cost of construction, which is presumed to vary with each wall assembly and may have a significant impact on initial costs. For example, double stud walls require additional labor to erect two sets of studs, which increases the construction time and cost. The SIP wall, in contrast, has relatively low construction costs due to the simplicity of its design and subsequent decrease in labor hours.
2) A durability assessment was beyond the scope of this study; however, conducting a hygrothermal analysis would provide another useful metric for measuring the long-term cost efficiency of these wall systems. Double stud walls often run the danger of condensation within its wall system due to the lack of exterior insulation outside of its sheathing, which results in wall temperatures dropping below the dew point. Tyvek housewrap has only been in existence for 20 years and thus its service life is not confirmed, and therefore some uncertainties exist regarding its effectiveness through the designated 50 year service life.
3) ICF and SIP wall systems have naturally low infiltration rates, while wood-framed walls, in order to achieve similar rates, requires additional materials to seal edges and openings. The extra sealant, adhesive and foam materials required results in increased initial costs as well as higher embodied energy and carbon emissions.
4) A sensitivity analysis was excluded in this study. However, this would be an appropriate follow-up to this study in order to assess the impact of R-value on the LCE of ICF walls compared to wood-framed walls.
5) Only the exterior walls of each Passive House were modeled in this study, and impacts and costs associated with the case studies do not necessarily reflect the true impacts and costs of the actual Passive House. The Isabella Ecohome, for example, had a final building cost of $342/ft2 due to additional high-performance materials used in the rest of the building. This is 2 to 3 times the national average cost of $125/ft2 for new residential construction in the U.S.
The results of this study suggest that many Passive Houses are over-designed. The baseline wall assembly with a R-24 thermal rating (Case 0) resulted in OE consumptions that were adequately low enough that depending on the climate, further increases in R-value were not always economical or environmentally beneficial. A Passive House in Sonoma, CA, for example, employs a 10” double stud wall with fiberglass insulation for a total wall assembly R-value of 40. Even with the low EE design of a double stud wall system, this is almost certainly overdesigned for such a mild climate, and is likely a missed opportunity for a much more reduced LCE.
This study highlights the low impact and energy of wood-framed walls in comparison to SIP and ICF systems at a thermal value of R-24 or higher. Since achieving high R-values are possible with any framing type, a wood-framed wall is recommended over other wall systems. Double stud wall construction in particular is highly recommended for any climate in the U.S. and is likely among the most cost-effective options available. With its low embodied energy and carbon emissions, double stud walls are also the most environmentally friendly choice for a wall system, especially in colder climates.
For insulation, cellulose is a cheap, effective and low impact option. It requires at least 6-7 inches to achieve R-24 or higher and is therefore most effective in a double wall system as it allows for greater thickness. However, in a conventional single stud system, cellulose as the main cavity insulation can still achieve high thermal values when paired with additional exterior insulation such as polyisocyanurate.
ICF and SIP systems are generally not recommended due to the high environmental impacts associated with its production as well as its high financial costs.
5.0 Conclusions
This study presents the results of a LCA and LCCA of a single-family home modeled with 5 different types of Passive House exterior walls. The LCA was carried out in accordance with the guidelines in the ISO 14000 standards. The house was modeled in four cities, representing a range of US climates: Los Angeles, New York City, Orlando, and Minneapolis. The system boundary includes the inputs and outputs of energy from the manufacturing, processing, transportation, construction, operation and disposal of building components. It excludes recurring energy from maintenance and replacement. Operational energy was based on a service life is 50 years.
Results indicate that in any given climate, the wood-framed walls have the least amount of environmental and economic impact compared to ICF or SIP-based walls. The double-stud walls in particular have very low embodied energy and carbon emissions, and due to its high potential for thermal insulation, it also has a low operational energy impact. Double stud walls are the most cost-effective option in any location. ICF walls had the greatest environmental and economic impact, and therefore considered the least cost-efficient option. The SIP wall also had a relatively high impact and life cycle cost. Cellulose as an insulation material has the least amount of embodied energy and emissions, compared to polyisocyanurate, fiberglass, or EPS.
6.0 Acknowledgments
This research was made possible by the Department of Civil, Environmental, and Architectural Engineering, the College of Engineering and Applied Sciences, and the Sustainable Infrastructure Materials Laboratory (SIMLab) at the University of Colorado Boulder. This work represents the views of the authors and not necessarily those of the sponsors.
References
[1] A. Dodoo, L. Gustavsson, R. Sathre. Building energy-efficiency standards in a life cycle primary
energy perspective. Energy Build., 43 (2011), pp. 1589–1597
[2] L. Perez-Lombard, J. Ortiz, C. Pout, A review on buildings energy consumption information, Energy and Buildings 40 (3) (2008) 394–398.
[3] International Energy Agency. Tracking Clean Energy Progress 2015, Energy Technology Perspectives 2015 Excerpt, IEA Input to the Clean Energy Ministerial. (2015)
[4] A. Stephan, R. Crawford, K. Myttenaer. Towards a comprehensive life cycle energy analysis framework for residential buildings Energy and Buildings, 55 (2012), pp. 592-600
[5] J.D. Silvestre, J. de Brito, M.D. Pinheiro, Building’s external walls in Life-Cycle Assessment (LCA) research studies, in: Portugal SB10. Sustainable Building Affordable to All, Vilamoura, Portugal, 2010, pp. 629–638. [33]
[6] W. Feist, J. Schnieders, V. Dorer, A. Haas. Re-inventing air heating: convenient and comfortable within the frame of the passive house concept. Energy Build., 37 (11) (2005), pp. 1186–1203
[7] A. Kylili, M. Ilic, P.A. Fokaides, Whole-building Life Cycle Assessment (LCA) of a passive house of the sub-tropical climatic zone, Resources, Conservation and Recycling, Volume 116, January 2017, Pages 169-177.
[8] E. Zavadskas, S. Raslanas, A. Kaklauskas The selection of effective retrofit scenarios for panel houses in urban neighborhoods based on expected energy savings and increase in market value: the Vilnius case. Energy and Building, 40 (4) (2008), pp. 573–587
[9] A. Lewandowska, A. Noskowiak, G. Pajchrowski. Comparative life cycle assessment of passive and traditional residential buildings’ use with a special focus on energy-related aspects. Energy Build., 67 (2013), pp. 635–646
[10] PassivHaus Institut (2014). Home. Accessed Dec 28, 2016,
from http://www.passiv.de/index_phi.html.
[11] A. Szalay, What is missing from the concept of the new European Building Directive, Building and Environment, 42 (2007) 1761-1769.
[12] https://hammerandhand.com/field-notes/how-much-does-a-passive-house-cost/
[13] https://www.census.gov/construction/chars/pdf/soldpricesqft.pdf
[14] Takano, A., Pal, S. K., Kuittinen, M. & Alanne, K. Life cycle energy balance of residential buildings: A case study on hypothetical building models in Finland. Energy Build. 105, 154–164 (2015).
[15] Biswas, K., Shrestha, S. S., Bhandari, M. S. & Desjarlais, A. O. Insulation materials for commercial buildings in North America: An assessment of lifetime energy and environmental impacts. Energy Build. 112, 256–269 (2016).
[16] Kneifel, J. Life-cycle carbon and cost analysis of energy efficiency measures in new commercial buildings. Energy Build. 42, 333–340 (2010).
[17] Ferrández-García, A., Ibáñez-Forés, V. & Bovea, M. D. Eco-efficiency analysis of the life cycle of interior partition walls: a comparison of alternative solutions. J. Clean. Prod. 112, 649–665 (2016).
[18] Marceau, M. L. & Vangeem, M. G. Comparison of the Life Cycle Assessments of an Insulating Concrete Form House and a Wood Frame House.
[19] A. Pears, Practical and policy issues in analysis of embodied energy and its application.‘ In proceedings of embodied energy seminar: current state of play, Deakin University, November 28- 29, (1996) Geelong, Australia
[20} I. Sartori, A.G. Hestnes. Energy use in the life cycle of conventional and low-energy buildings: a review article. Energy and Buildings, 39 (3) (2007), pp. 249–257
[21] T. Ramesh, R. Prakash, K.K. Shukla, Life cycle energy analysis of buildings: an overview, Energy and Buildings 42 (10) (2010) 1592–1600.
[22] I. Sartori, A.G. Hestnes, Energy use in the life cycle of conventional and low energy buildings: a review article, Energy and Building 39 (3) (2007) 249–257
[23] G. Ding, The Development of a Multi-Criteria Approach for the Measurement of Sustainable Performance for Built Projects and Facilities, University of Technology, Sydney, Australia, 2004 (PhD thesis).
[24] Pal.
[25] Y.L. Langston, C.A. Langston, Reliability of building embodied energy modeling: an analysis of 30 Melbourne case studies, Construction Management and Economics 26 (2) (2008) 147–160.
[26] M.R. Emmanuel, K. Baker. Carbon Management in the Built Environment. London: Routledge,
2012.
[27] G. Finnveden, et al. Recent developments in life cycle assessment Journal of Environmental Management, 91 (1) (2009), pp. 1–21
[28] P.S. Vieira, A. Horvath. Assessing the end-of-life impacts of buildings. Environmental Science & Technology, 42 (13) (2008), pp. 4663–4669
[29] P. Lesage, T. Ekvall, L. Deschênes, R. Samson. Environmental assessment of brownfield rehabilitation using two different life cycle inventory models. Part 1. Methodological approach, International Journal of Life Cycle Assessment, 12 (6) (2007), pp. 391–398.
[30] P. Lesage, T. Ekvall, L. Deschênes, R. Samson. Environmental assessment of brownfield rehabilitation using two different life cycle inventory models. Part 2. Case study, International Journal of Life Cycle Assessment, 12 (7) (2007), pp. 497–513
[31] J.D. Silvestre, J. de Brito, M.D. Pinheiro . From the new European Standards to an environmental, energy and economic assessment of building assemblies from cradle-to-cradle (3E-C2C). Energy and Buildings, 2013, pp. 199–208.
[32] J. Nässén, J. Holmberg, A. Wadeskog, M. Nyman. Direct and indirect energy use and carbon emissions in the production phase of buildings: an input-output analysis. Energy, 32 (2007), pp. 1593–1602
[33] http://ec.europa.eu/environment/waste/pdf/study/annex5.pdf
Cite This Work
To export a reference to this article please select a referencing stye below:
Related Services
View all


Related Content
All TagsContent relating to: "Energy"
Energy regards the power derived from a fuel source such as electricity or gas that can do work such as provide light or heat. Energy sources can be non-renewable such as fossil fuels or nuclear, or renewable such as solar, wind, hydro or geothermal. Renewable energies are also known as green energy with reference to the environmental benefits they provide.
Related Articles

DMCA / Removal Request
If you are the original writer of this dissertation and no longer wish to have your work published on the UKDiss.com website then please: