Investigation of Neurochemicals’ Role in Glioblastoma and Neural Stem Cells
Info: 56799 words (227 pages) Dissertation
Published: 24th Feb 2022
Investigation of Neurochemicals’ Role in Glioblastoma and Neural Stem Cells: Characterization of Dopamine Receptor D4 Inhibition in Glioblastoma Stem Cells
Abstract
Neurochemicals that mediate synaptic communications between mature neurons are now appreciated to have a critical role in neurogenesis and cancer. Glioblastomas (GBM) grow in the rich neurochemical milieu of the brain and may depend on neurochemical signals for proliferation and survival. Given the close similarities between GBM stem cells and neural stem cells (NSC), and their existence in the rich neurochemical milieu of brain, neurochemical signaling may profoundly impact tumor growth.
To test this hypothesis, I interrogated a library of 680 neuroactive compounds in patient-derived GBM neural stem cells (GNS) against normal human NSC and human fibroblasts cells to identify selective compounds. I found that compounds modulating dopaminergic, serotonergic and cholinergic signaling pathways selectively affected GNS and NSC growth compared to fibroblast cells. I identified ten compounds that showed more than 8-fold selectivity and in particular, dopamine receptor D4 (DRD4) antagonists (L-741,742 and PNU 96415E) selectively inhibited GBM growth in vitro and in vivo, and exhibited synergism with the current chemotherapeutic drug, temozolomide (TMZ).
Primary GBM tumors and GNS cells expressed functional DRD4 receptor and antagonism of DRD4 led to disruption in its downstream effectors PDGFRβ/ERK1/2, and mTOR signaling. Furthermore, DRD4 antagonism disrupts endolysosmal function compromising the autophagy-lysosomal degradation pathway leading to autophagic flux inhibition with accumulation of autophagic vacuoles, autophagy specific substrate p62, cholesterol and ubiquitinated proteins, followed by G0/G1 cell cycle arrest and apoptosis. The identification of DRD4 antagonists as GNS selective compounds revealed autophagy-lysosomal system as a vulnerable and important system for GBM cell survival and suggests modulation of dopamine signaling may hold therapeutic potential.
Interestingly, DRD4 antagonists L-741,742 and PNU 96415E were also identified as hits in the high content differentiation screen. I further characterized DRD4 antagonist induced differentiated cells, which showed VGLUT1 positive cells with increased expression of NERUOG2, CTIP2 and ETV1 identifying them as glutamatergic cortical deep layer V neurons.
Finally, DRD4, when inhibited in normal NSC, initiate differentiation, while in GNS cells, they are vulnerable and undergo cell death.
List of Abbreviations
Click to expand Abbreviations
5-HT - 5 hydroxytrptamine /serotonin
6-OHDA - 6 hydroxydopamine
ADHD - attention deficit hyperactivity disorder
AML - acute myeloid leukemia
AMPA - α-amino-3-hydroxy-5-mehtyl-4 isoxazolepropionic acid
βArr2 - β arrestin 2
BDNF - brain derived neurotrophic factor
bFGF - basic fibroblast growth factor
bHLH - basic helix-loop-helix
BIO-6 - bromoindirubin-3’-oxime
BLBP - brain lipid binding protein
BMP4 - bone morphogenetic protein 4
BSA - bovine serum albumin
CAMKII - Ca2 /calmodulin dependent protein kinase II
cAMP - cyclic adenosine monophosphate
CD - cluster of differentiation
CDKN1A - cyclin dependent kinase inhibitor 1A
cDNA - complementary DNA
ChAT - choline acetyltransferase
CI - combination index
CIMP - CpG island methylator phenotype
CNS - central nervous system
COMT - catechol-o-methyl transferase
CpG - cytosine and guanine separated by a phosphate
CSC - cancer stem cell
CTIP2 - coup-tf-interacting protein 2/BCL11B
CXCR4 - chemokine (C-X-C motif) receptor 4
DAPI-4’6 - diaminido-2-phenylindole
DARPP-32 - dopamine and cAMP regulated phosphoprotein-32/PPP1R1B
DAT - dopamine transporter
DG - dendate gyrus
DKK1 - dickkopf 1
DMEM - dulbecco’s modified essential medium
DMSO - dimethyl sulfoxide
CDKN1B - cyclin dependent kinase inhibitor 1B
DNA - deoxyribonucleic acid
dNTP - deoxyrnucleotide
DQ - dequenched
DR - dopamine receptor
DRD4 - dopamine receptor D4
DRIP - dopamine receptor interacting protein
E - epinephrine
EGF - epidermal growth factor
eGFP - enhanced green fluorescent protein
EGFR - epidermal growth factor receptor
ERK - extracellular signal regulated kinase
ETV1 - ets variant 1
FACS - fluorescence activated cell sorting
FBS - fetal bovine serum
FDR - false discovery rate
FGF - fibroblast growth factor
FOXG1 - forkhead box G1
G0 - Growth phase 0
G1 - Growth phase 1
GAPDH - glyceraldehyde 3- phosphate dehydrogenase
GBM - glioblastoma
GFAP - glial fibrillary acidic protein
GFP - green fluorescent protein
Gi - G protein, inhibitory
GIRKS - G protein coupled inward rectifying potassium channel
GLAST - glutamate-aspartate transporter
GNS - glioblastoma derived neural stem cells
GPCR - G protein couple receptor
Grb2 - growth factor receptor bound protein 2
Gs - G protein, stimulatory
GSEA - gene set enrichment analysis
GSK3 - glycogen synthase kinase 3
IC - inhibitory concentration
IDH - isocitrate dehydrogenase
IGFR - insulin-like growth factor receptor
IP3 - inositol triphosphate
IPC - intermediate progenitor cells
KLF2 - kruppel like factor 2
GABA - gamma-aminobutryic acid
KLHL12 - kelch-like family member 12
L1CAM - L1 cell adhesion molecule
LAMP1 - lysosomal associated membrane protein 1
LC3 - microtubule associated protein 1A/B light chain 3
LDA - limiting dilution assay
L-DOPA-L-3,4 - dihydroxyphenylalanine
LGE - lateral ganglionic eminence
MAOB - monoamine oxidase B
MAP2 - microtubule associated protein 2
MAPK - mitogen activated protein kinase
Mash1 - mammalian achaete scute homolog1/ASCL1
MDM2 - mouse double minute 2 homolog
MET - mesenchymal epithelial transition factor
MGE - medial ganglionic eminence
MGMT - O-methyl-guanine-methyltransferase
mRNA - messenger RNA
mTOR - mechanistic target of rapamycin
NCAM - neural cell adhesion molecule
Nck - NCK adaptor protein
NE - norepinephrine
NEC - neuroepithelium cells
NEUROG2 - neurogenin 2
NF1 - neurofibromatosis type I
Ngn - neurogenin
NMDA - N-methyl-D-aspartate
NS - neural stem cells
NSC - neural stem cells
NSG - NOD scid gamma (NOD.Cg-Prkdcscid Il2rg tm1Wjl/SzJ)
OB - olfactory bulb p53-tumor protein 53
PARP - poly ADP ribose polymerase
PCR - polymerase chain reaction
PDGFRA - platelet derived growth factor receptor A
PDGFRβ - platelet derived growth factor receptor-β
PFA - paraformaldehyde
nAChR - nicotinic acetylcholine receptor
PI3K - phosphoinositide-3-kinase
PKA - protein kinase A
PLC - phospholipase C
PLO - poly-L-ornithine
PPI - protein phosphatase 1
PTEN - phosphatase and tensin homolog
PVDF - polyvinylidene fluoride membrane
Ras - rat sarcoma viral oncogene
RB - retinoblastoma
RFP - red fluorescent protein
RGC - radial glial cells
RMS - rostral migratory stream
RNA - ribonucleic acid
rpS6 - ribosomal protein S6
RPS 18 - ribosomal protein S18
RTK - receptor tyrosine kinase
SATB2 - special AT rich sequence binding protein 2
SCID - severe combined immunodeficiency
PI - propidium iodide
SEM - standard error of the mean
SGZ - subgranular zone
shRNA - short hairpin
RNA SOX2 - Sry-box2
SVZ - sub ventricular zone
Tbr - t-box brain protein
TCGA - The cancer genome atlas
TEM - transmission electron microscopy
TH - tyrosine hydroxylase
TMZ - temozolomide
TPH - tryptophan hydroxylase
U2-OS - human osteosarcoma cells
VGLUT1 - vesicular glutamate transporter 1
VNTR - variable number of tandem repeats
VTA - ventral tegmental area
VZ - ventricular zone
WNT - wingless
SDS - sodium dodecyl sulfate
Chapter 1 Introduction
1.1 Glioblastoma
Glioblastoma (GBM) is the most common malignant brain tumor, which accounts for 15.6% of all primary brain tumors and 45.2% of primary malignant brain tumors (Ostrom et al., 2013). The incidence of GBM increases with age from 75-84 years and affects more men than women. GBM can occur in any part of brain including brain stem and cerebellum, but occur more commonly in frontal and temporal lobes. Based on the clinical history, GBM are often classified as primary or secondary. Primary GBM arise de novo with no previous brain lesion and grow very rapidly, and they represent 90-95% of GBM and occur more commonly in older patients. Secondary GBM accounts for only 5-10% of GBM and occurs in younger patients and with an average interval of 4-5 years for disease progression from lower grade astrocytoma to GBM(Ohgaki and Kleihues, 2005). Primary and secondary GBMs are usually indistinguishable on histological grounds but they show very different genetic alteration and genomics. The histopathological characteristic of GBM includes highly cellular, poorly differentiated pleomorphic astrocyte-like cells with high mitotic activity and nuclear atypia, microvascular proliferation and necrosis with pseudopalisading cells(Furnari et al., 2007). GBMs show inter- and intratumoral heterogeneity, which are properties making them exceedingly difficult to treat.
1.1.1 Glioblastoma therapy
GBM patients are diagnosed based on symptoms, neurological signs and neuroimaging. Since GBM grows rapidly, the most common symptoms are caused by increased pressure in the brain that includes headache, nausea, vomiting, but depending on location of the tumor they can have different symptoms. The current standard care of treatment includes maximum surgical resection, radiotherapy and concomitant or adjuvant chemotherapy with temozolomide (TMZ). Despite this multi modal approach, the median survival time remains 14.6 months with two-year survival rate of 26.5% and five-year survival rate less than 5%(Stupp et al., 2005). Patients whose tumors present epigenetic silencing of the DNA repair enzyme O-methyl-guaninemethyltransferase (MGMT) through promoter methylation show better outcome with TMZ treatment with overall median survival length of 21 months from 14 months of patient with unmethylated tumors(Hegi et al., 2005). Unfortunately, tumors progress in all patients regardless of the tumor characteristics. Recurrence may be treated with repeat surgery and concomitant treatment with antiangiogenic drugs such as bevacizumab(Friedman et al., 2009). Other chemotherapeutic drugs such as carmustine and lomustine provide marginal benefits. The dismal prognosis of the current therapies is attributed to the highly infiltrative nature of the tumor and the highly heterogeneous nature of the tumor cells which have different molecular profiles. Thus GBM remains an incurable disease with few therapeutic advances and demands more effective, targeted therapy.
1.1.2 Causes of glioblastoma
Like in many cancers, the cause for GBM is not known. But there are many studies that point to genetic mutations associated with different cells. The genetic mutation may be inherited by the environment or both. Only 5% of primary brain tumors are associated with inherited genes alone. GBM may also occur in the course of genetic diseases such as neurofibromatosis type I(Broekman et al., 2009) and tuberous sclerosis(Padmalatha et al., 1980). Exposure to certain chemicals such as petrochemicals, pesticides and formaldehyde poses a higher risk of developing brain tumor. Ionizing radiation and electromagnetic fields also increases the risk of developing brain tumor(Spinelli et al., 2010). There may be many environment and genetic factors that can cause GBM but in most cases, the cause is not known.
1.1.3 Genetics and molecular biology of glioblastoma
In the past two decades with the advancement in technologies to evaluate genetic and epigenetic changes, there has been tremendous influx of data describing the genomic alterations in many cancers including GBM. GBM being one of the most molecularly complex tumors, it was the first solid tumor type to undergo comprehensive genomic, epigenetic, transcriptional analysis by The Cancer Genome Atlas (TCGA), a US government funded project involving multiple institutions. In this effort, TCGA initially analyzed 206 and then 543 primary GBM samples to define and validate the core biological pathways deregulated in GBM and classify GBM into four molecular subgroups (Brennan et al., 2013; Cancer Genome Atlas Research, 2008; Verhaak et al., 2010). The main common alteration in gene coding sequence appears to target three main signaling pathways in GBM.
1.1.3.1 RTK/RAS/PIU3K signaling pathway
Receptor tyrosine kinases (RTK) are primary mediators of signal transduction and are often deregulated in many cancers including GBM. The main alteration of this pathway seen in GBM is the mutation or amplification of epidermal growth factor receptor (EGFR) present in 45% of all primary GBM, and amplification of platelet derived growth factor A (PDGFRA) present in 13% of GBM and MET present in 4% of GBM(Cancer Genome Atlas Research, 2008). Both EGF and PDGF play an important role in normal and tumor gliogenesis. Activation of EGFR and PDGFR signaling can enhance GBM growth through stimulation of the RAS/RAF/MEK/ERK pathways. An increased activity of RAS is observed in all GBMs however mutation in this gene is very rare. The up regulation of RAS could be from the activation of the upstream regulator such as EGFR and PDGFR and also from the loss of function of neurofibromatosis type I (NF1), present in 18% of GBM, which is a negative regulator for RAS pathway(Nissan et al., 2014). PI3K/AKT/PTEN/mTOR pathway is also activated in GBM through activation in RTK signaling (EGFR) and lesion in PIK3R1/PIK3CA and mutation or loss of PTEN which is present in 36% of GBM, a negative regulator of PI3K.
1.1.3.2 p53 pathway
p53 is a tumor suppressor and a transcription factor that coordinates cells response to stress by regulating genes involved in apoptosis, DNA repair and metabolism(May and May, 1999). This pathway is highly disrupted in GBM through mutation/deletion in TP53 (27.9%) and deletion of CDKN2A (ARF) (55%), which encodes for two distinct proteins (p16INK4a and p14ARF) that act as negative regulators of the cell cycle. p53 pathway is also affected indirectly through amplification of murine double minute 2(MDM2;11%) and MDM4(4%) which is an E-3 ubiquitin ligase complex that can repress p53 function through its exertion of degradative control. TP53 alterations are mutually exclusive with amplification of MDM family genes and CDKN2A.
1.1.3.3 RB pathway
This pathway plays a key role in the regulation of cell cycle and proliferation. The RB gene encodes for the retinoblastoma (RB) phosphoprotein. In quiescent cells, RB is in a hypophosphorylated (active) state and bound to E2F, preventing transcription of genes required for progression through the G1/S cell cycle phase. In proliferating cells, RB is phosphorylated (inactive) by CDK-cyclin complexes enabling E2F release and subsequent promotion of G1/S transition. The RB pathway is altered in 78% of primary GBMs either directly by mutation, deletion, or promoter methylation at the RB locus, or indirectly through alteration in RB positive and negative regulators. The most frequent event for this pathway was deletion in the cyclindependent kinase inhibitor 2A(CDKN2A)/CDKN2B locus on chromosome 9p21 (55% and 53% respectively) followed by amplification of the cyclin dependent kinase 4(CDK4) locus (14%). P16INK4A inhibits the association of CDK4/6 with cyclin D, which promotes G1/S transition. This complex phosphorylates RB, facilitating release of bound E2F, a G1/S transcription factor. A loss of p16INK4a allows CDK4/6 and cyclin D association and subsequently promotes the G1/S transition.
1.1.3.4 IDH1 mutation
In parallel to TCGA studies, Parson et al reinforced identification in the above genes and pathways in GBM. They also discovered mutations in a metabolism-related gene called IDH1. IDH1 gene encodes for isocitrate dehydrogenase I, an enzyme that catalyzes the oxidative decarboxylation of isocitrate to α-ketoglutarate and reduces NAD and NADP to NADH and NADPH respectively. IDH1 gene is mutated in 12% of GBMs. Mutation in IDH1 almost always affects the R132 codon and are more frequently detected among low grade glioma and secondary GBMs (70-75%) and very rare in primary GBM (5%), and IDH1 mutant GBMs are associated with increased overall survival (Parsons et al., 2008). Mutant IDH1 is reported to alter metabolism by favoring reduction of α-ketoglutarate to 2-hydroxyglutarate (2HG)(Dang et al., 2010), which in turn inhibits DNA and histone demethylase, hypermethylating large number of loci, ultimately altering gene expression leading to tumor growth.
1.1.4 Molecular classification of glioblastoma
GBMs are historically classified by clinical presentation as either primary or secondary based on the evidence of preexisting lower grade glioma. Recent genomic analysis also validated these two clinical groups as distinct molecular groups and has also identified extensive patient to patient inter-tumoral heterogeneity, further redefining histopathological classification of the disease. There have been several gene expression studies classifying GBM into several molecular subtypes including the initial description from Phillips and colleagues (Phillips et al., 2006), but the most recent and consensus classification comes from the integrated genomic and copy number analysis on a large cohort of 200 adult GBM from TCGA identified four different molecular subtypes: proneural, neural, classical and mesenchymal correlating to abnormalities in PDGFRA, IDH1, EGFR and NF1 respectively (Verhaak et al., 2010). Proneural subtypes are mostly characterized by abnormalities in PDGFRA and IDH1, associated with younger age and secondary GBMs. This subgroup is also enriched for genes involved in neural development such as DCX, DLL3, ASCL1, TCF4, SOX genes and oligodendrocyte development such as PDGFRA, NKX2-2 and OLIG2.
The neural subtype lacked a distinctive genetic profile and display gene expression similar to those found in normal brain tissue, with expression of neuronal markers such as NEFL, GABRA1, SYT1 and SLC12A5, many have dropped this group from the subtypes. The classical subtype was defined by the presence of most common genomic aberration seen in GBM, with 93% of samples harboring chromosome 7 amplification and chromosome 10 deletion accompanied with EGFR amplification and homozygous deletion of CDKN2A-p16 Ink4a/ARF locus. This subgroup also lacks additional abnormalities in TP53, NF1, PDGFRA or IDH1 and expressed neural precursor and stem cell marker gene from Notch and Sonic hedgehog signaling pathways. The mesenchymal subgroup is characterized by abnormalities in NF1, mutation/deletion or low levels of NF1 mRNA expression, with high expression of mesenchymal (CHI3L1 and MET) and astrocytic (CD44 and MERTK) markers. Furthermore, this classification system is further refined based on characterization of DNA methylation patterns, as proneural GBM into glioma-CpG island methylator phenotype (GCIMP) positive and G-CIMP negative GBM subsets, which corresponds strongly with IDH1 mutations(Brennan et al., 2013; Noushmehr et al., 2010). Only the G-CIMP subset of proneural subgroup was reported to have better prognosis, with other subgroups being highly similar.
1.2 Developmental neurobiology, neurogenesis, neural stem cells
Understanding early development of the mammalian brain and neurogenesis, the process by which neurons are generated from the neural stem cell or progenitor cells, has great importance for regenerative medicine, and also provides insight into understanding the origins and molecular mechanisms governing GBM. In early development of the vertebrate embryo, the neural fate is induced in ectoderm by the underlying notochord to give rise to the neural plate. The neural plate subsequently folds to become the neural tube and undergoes patterning for future distinctive central nervous system (CNS) region. Thus neural tube is specified to generate the prosencephalon, mesencephalon and rhombencephalon, which give rise to the future forebrain, midbrain and hindbrain respectively. The prosencephalon is comprised of two parts, the telencephalon, which gives rise to the cerebrum and the diencephalon, which generates the thalamus, hypothalamus and the posterior portion of the pituitary gland.
1.2.1 Neurogenesis in the developing cortex
The most studied neurogenic niche in the developing CNS is the cerebral cortex. The mammalian cerebral cortex has six layers and each layer contains neurons that share a characteristic morphology, connection and gene expression pattern(Hevner et al., 2003). The neurons of the cerebral cortex are broadly divided into two categories; projection neurons that transmit signals to other cortical or subcortical regions with the excitatory neurotransmitter glutamate, and interneurons that regulate local circuitry with the inhibitory neurotransmitter gamma ammunobutyric acid (GABA).
Although these two neuron populations intermix within the mature cortex, they are generated from different regions of the telencephalon. Early in development, just like the rest of the CNS, the cerebral cortex starts from a simple neuroepithelial sheet at the anterior neural tube called telencephalon. The excitatory projection neurons arise from the neuroepithelium cells (NEC) of the dorsal telencephalon (pallium), while the inhibitory interneurons are generated in the ventral telencephalon (subpallium), which then migrate tangentially into the dorsal telencephalon consisting of immature cortex(Anderson et al., 1997; Gorski et al., 2002; Molyneaux et al., 2007; Rakic, 1978).
Importantly, this precise coordination of neurogenesis and cell migration is controlled by both intrinsic and extrinsic factors. For example, the proneural bHLH transcription factors neurogenin2 (Ngn2) are expressed in the dorsal telencephalon and are required for proper specification of projection glutamatergic neurons, whereas Mash1/Ascl1, which is predominantly expressed in the ventral telencephalon, is required for proper specification of GABAergic interneurons(Britz et al., 2006; Guillemot and Joyner, 1993; Hand et al., 2005; Parras et al., 2002). The cytoarchitecture of the neocortex can be defined by its glutamatergic cell components. In the developing mouse cortex, the dividing NECs comprise the entire neuroepithelium at embryonic days 8-9. NECs are bipolar, with an apical and a basal process contacting the ventricular and pial surfaces respectively.
They also express the SRY-related HMG-box transcription factor Sox1(Zhao et al., 2004). NECs divide symmetrically to self renew and to generate an adequate pool of founder progenitors. The initial proliferative phase affects both lateral and radial extension and has significant impact on the final surface area and thickness of the cortex(Florio and Huttner, 2014). At the onset of neurogenesis, embryonic day 10 to 12, these NECs undergo a transition to become radial glial cells (RGCs). The transition of NECs to RGCs are instructed through several extrinsic factors such as Notch1 and FGF signaling and intrinsic factors such as Sox1(Gaiano et al., 2000; Sahara and O'Leary, 2009; Suter et al., 2009). These RGCs maintain NECs features with adherens junctions and apical-basal polarity with long basal process that span the entire thickness of cortex. These RGCs express glial markers such as GLAST (Glutamate-aspartate transporter) and BLBP (Brain lipid-binding protein). RGCs are the principal progenitor cells of the cerebral cortex and it also serve as scaffolds for the orientated migration of later born neurons through their elongated processes(Noctor et al., 2001; Rakic, 1972). They can self renew by symmetric division but primarily undergo asymmetric neurogenic division, which produce a new RGC and either a neuron (direct neurogenesis), or an intermediary type of progenitor cell called intermediate progenitor cells (IPC) that then give rise to neurons (indirect neurogenesis) (Hansen et al., 2010; Kowalczyk et al., 2009; Noctor et al., 2004).
Ultimately at the last stages of neuron production, RGCs undergo terminal symmetric division giving birth to two neurons. The prevalence of indirect neurogenic divisions increase markedly as neurogenesis progress. IPC are transiently amplifying progenitors characterized by the expression of the transcription factor Tbr2(Sessa et al., 2008). IPCs delaminate from the ventricular zone (VZ) to settle in the subventricular zone (SVZ), where they divide symmetrically to self renew before undergoing a terminal division that give rise to two neurons. The final neuronal output is sequentially impacted by the initial pool size of founder progenitors NECs, by progressive switch from symmetric autoreplicative to neurogenic division, and finally the duration of the neurogenic phases, which presents significant variation between species.
In the mouse, SVZ progenitors comprising of IPCs undergo at most two rounds of division (Noctor et al., 2004), whereas in human and other primates, they undergo significantly more rounds to division(Fietz et al., 2010). This is the major difference observed between lissencephalic species such as rodents and gyrencephalic species such as humans. Additionally, the primate SVZ is subdivided into two layers of filamentous structure: the inner SVZ (ISVZ), which is juxtaposed to the VZ, and the more basal or outer SVZ (OSVZ) (Hansen et al., 2010). Secondly, the ISVZ contains only Tbr2 positive IPC as in the mouse SVZ, the OSVZ contain additional type of progenitor cells that are similar to ventricular RGCs and are called basal RGCs or oRGC. These cells are distinguished by being unipolar with only an apical or a basal process(Betizeau et al., 2013). oRGCs are originally generated from ventricular RGCs by asymmetric division most frequently characterized by horizontal or sometime an oblique division plane. They can in turn give rise to new oRGCs and IPCs as well.
As neurogenesis begins, RGCs undergo successive rounds of asymmetric, self renewing divisions, giving rise to all the diverse subtypes of cortical excitatory neurons in a defined temporal sequence. The first cohort of terminally differentiated neuron are pioneer layer I neuron consisting of Cajal-Retzius (CR) cells that forms a transient structure called preplate (PPL). Cajal-Retzius cells express secretory glycoprotein called Reelin (Reln). Layer I Cajal-Retzius neurons serve as essential scaffold for the construction of the neocortical cytoarchitecture regulating radial migration in subsequent-born projection neurons through diffusive cues. Approximately 75% of these scaffolding cells are eliminated during early postnatal period, a proportion of Cajal-Retzius cells survive in the postnatal neocortex(Soda et al., 2003). Following the disposition of the preplate cells consisting of Cajal-Retzius cells, RGCs begins to produce projection layer neurons through sequential round of cell cycles. New neurons are successively generated and migrate radially using RGCs fibres from their place of origin at the ventricular surface past the pre-existing neurons to occupy the more superficial layers thus resulting in an inside-out lamination of the neocortex. Thus the neuronal birthdate is highly correlated with final laminar fate, in which neurons that occupy the same radial position are typically generated within the same temporal window and share common projections targets.
In this way deep layer (DL) neurons are generated early, which include layers V and V1 that consist mainly of corticofugal projection neurons that project to subcortical targets. Specifically, layer V neurons project to the brainstem and spinal cord, and express Fezf2 and Ctip2(Chen et al., 2008; Molnar and Cheung, 2006) and subset of these neurons express Er81/Etv1(Yoneshima et al., 2006). In turn layer VI neurons establish corticothalamic projection neurons and express Tbr1, Zfpm2 and Sox5(Hevner et al., 2001; Kwan et al., 2008). The upper layer (UL) neurons are generated later, which includes layer II/III projection neurons and layer IV thalamorecipient neurons processing higher order information through intracortical connections. Layer II/III express the transcription factor Cux1/2, Brn1/2, Satb2 and project their neurons to the ipsilateral and contralateral cortex, thereby establishing bilateral cortical connections(Britanova et al., 2008; Nieto et al., 2004). Layer IV neurons are recipient cells for thalamocortical inputs and act as gateway for processing information from periphery sensory organs. In contrast to other layer neurons, Layer IV neurons have very limited specific markers that include Rorb, Unc5d and Kcnh5 (Eag2) (Schaeren-Wiemers et al., 1997; Zhong et al., 2004). After neurogenesis, RGCs switch to gliogenesis, producing astrocytes and oligodendrocytes (Noctor et al., 2001). Some of these RGC precursors also stay behind and eventually contribute to the pool of adult neural stem cells (Bonfanti and Peretto, 2007).
1.2.2 Neurogenesis in the adult brain
Neurogenesis persists in adult mammals in specific brain regions called neurogenic niches. In adult mouse brain, the main neurogenic regions are the subependymal zone of the lateral ventricles, also known as ventricular-subventricular zone (V-SVZ) and the subgranular zone (SGZ) of the dendate gyrus in the hippocampus(Altman and Das, 1965; Doetsch et al., 1999; Ming and Song, 2011). In the human adult brain, these neurogenic regions have been also shown to be active, where V-SVZ regions are thought to contribute new neurons to the striatum and the SGZ region contributes new neurons to the dendate gyrus (Eriksson et al., 1998; Ernst et al., 2014). This addition of new neurons to the complex circuitry of the adult brain reveals its crucial function in memory, behavior and regeneration, which is the focus of intensive research. The neural stem cells (NSC) in V-SVZ are identified as astroglial cells (B1 cells), similar to RGCs in embryonic development(Doetsch et al., 1999; Mirzadeh et al., 2008). In both embryonic and adult brain, NSCs are specialized form of glia that resides in neurogenic niches(Kriegstein and Alvarez-Buylla, 2009).
In contrast, the embryonic NSCs are inherently transient and continually changing their developmental potential and location over time, where as the adult VSVZ NSCs are more stable and present in a well defined niche that includes ependymal cells, mature vasculature, axonal terminals. This unique niche provides multiple regulatory controls for the production of neurons within fully assembled adult brain. Similar to RGCs, B1 cells retain epithelial feature that has apical processes that contact the ventricle and end feet on blood vessels(Kriegstein and Alvarez-Buylla, 2009). This elongated structure allows B1 cells to bridge all compartments of the V-SVZ. Consistent with their astrocytic morphology and ultrastructure, B1 cells express glial markers such as glial fibrillary acidic protein (GFAP), glutamate aspartate transporter (GLAST) and brain lipid binding protein (BLBP).
Recently, it has been shown that B1 cells can exist in either quiescent or activated state(Codega et al., 2014; Mich et al., 2014), where quiescent B1 cells do not express Nestin, an intermediate filament protein that has long been considered as marker of NSC while the activated B1 cells express Nestin. These activated B1 cells give rise to transit amplifying precursors (C cells), which then divide symmetrically approximately three times before becoming migratory neuroblasts (A cells)(Doetsch and Alvarez-Buylla, 1996; Ponti et al., 2013). These type A cells then divide once or more while on route to the olfactory bulb and migrate within a network of interconnecting path, forming the rostral migratory stream (RMS), where they differentiate into different subtypes of interneurons. Adult hippocampal neurogenesis is not extensively characterized as in the V-SVZ neurogenesis. The generation of DG is unique from developmental point of view. While V-SVZ is seen as a continuation of the embryonic ventricular zone (VZ) of the telencephalon, the formation of DG involves generation of a dedicated progenitor cells source away from the VZ and in close proximity to the pial surface.
This additional proliferative zone remains active during postnatal stages and eventually becomes the SGZ, which is site of adult hippocampal neurogenesis (Altman and Bayer, 1990; Pleasure et al., 2000). In SGZ of dendate gyrus, the adult NSCs are also radial glial like cells called type-I cells that populate the border between the hilus and the inner granule cell layer, which express markers of NSC and divide rarely(Seri et al., 2001). When activated type-1 cells give rise to intermediate progenitor cells, which exhibit limited number of cell division before generating neuroblast(Berg et al., 2015). These neuroblasts migrate tangentially along SGZ and differentiate exclusively into granule neurons, which are then integrated into the hippocampal circuits(Sun et al., 2015).
Like RGC in the embryo, NSCs in both V-SVZ and SGZ express GFAP, Nestin and Sox2 and they directly contact the blood vessels. However, both adult NSC populations have restricted potential each generating a unique neuronal subtype and one type of glia as shown recently by genetic fate mapping and clonal lineage tracing method. In adult hippocampus in vivo, NSCs in the SGZ give rise to neurons and astrocytes but not oligodendroctyes (Bonaguidi et al., 2011), while NSC in V-SVZ has shown to generate neurons and oligodendrocytes (Calzolari et al., 2015; Ortega et al., 2013). Therefore, in adult brain whether endogenous NSC with an intrinsic tri-potent potential exist or not, or whether they are intrinsically tripotent but suppressed by niche remains a fundamental unanswered question.
1.3 Cancer stem cells, brain tumor stem cells, clinical relevance
Cancer is caused by a series of aberrant genetic alteration and epigenetic modifications that over time results in the loss of cell cycle control and DNA damage checkpoints leading to an increased cell proliferation potential. In the process of this transformation from a normal to a cancerous cell state, the cell acquires specific characteristics including indefinite replicative ability, sustained proliferative signals, evasion of cell death and the immune system, development of neoangiogenesis, and ultimately an ability to invade and metastasize(Hanahan and Weinberg, 2011). Cells within the individual tumor undergo natural selection and diverge in a process of cancer evolution. It has been shown that cancer tissues are heterogeneous similar to organs, with multiple cell types that interact with each other and with extracellular matrix. They are heterogeneous not just in cellular morphology and tumor histology, but heterogeneous in cell surface markers, genetic abnormalities, growth rates and response to therapy. Much evidence points to the existence of multiple tumor cell subpopulations within single cancers. The cancer stem cell model of cancer development proposes that only a subpopulation of cancer cells have the potential to generate new tumors containing heterogeneous populations of cancer cells, where as the stochastic model proposes that all cancer cells have ability to give rise to new tumors.
1.3.1 Cancer stem cell model
The idea that cancers retain features of embryological development has been proposed more than 150 years ago, and the modern idea of cancers having caricatures to normal tissue organization has been shown with the seminal studies of teratocarcinoma by Pierce (Pierce et al., 1960), and in mammary carcinoma by Rudland (Bennett et al., 1978). All these studies suggested that tumor cells that were more differentiated were generated by “tumor stem cells” similar to normal tissue stem cells.
A study by Pierce and Wallace in 1971 indicated the presence of a cellular hierarchy in the tumor, where they found that undifferentiated malignant cells give rise to benign well differentiated cells(Pierce and Wallace, 1971). Based on these studies, it was believed that cancer stem cells (CSC), with deregulated self-renewal and differentiation were responsible for tumor initiation and progression. Early studies in leukemia, based on normal studies in the hematopoietic system, showed clear evidence that majority of leukemia blast were postmitotic and it needed to be replenished from a small population of highly proliferative cells(Clarkson et al., 1967).
Later with the development of fluorescence-activated cell sorting techniques (FACS), combined with refinement in xenograft techniques in immune deficient mice, and quantitative methods to measure tumor propagating potential, set the stage for the first purification of tumor initiating cells or cancer stem cells (CSC). In 1994 Lapidot and Dick used CD34 and CD38 to prospectively isolate CSC in acute myeloid leukemia (AML). They demonstrated that only CD34 CD38- subpopulation of AML cells gave rise to leukemias when injected in severe combined immunodeficiency (SCID) mice (Lapidot et al., 1994). This was the first prospective isolation of a CSC. They later confirmed that CD34 CD38- grafts recapitulate the heterogeneity of the patient samples from which they were derived, further demonstrating that AML is organized as a hierarchy with CD34 CD38- CSC at the apex (Bonnet and Dick, 1997).
This initial studies in AML set the foundation for the identification and prospective isolation of CSC in many cancers including breast(Al-Hajj et al., 2003), brain(Singh et al., 2004), pancreatic(Hermann et al., 2007), prostate(Collins et al., 2005), head and neck(Prince et al., 2007) and colorectal(O'Brien et al., 2007). All these studies demonstrated that tumors are hierarchically organized- that not all cells have the potential to initiate and propagate tumor growth, similar to developmental hierarchies seen in normal tissue where stem cells reside at the apex and are responsible for generating progeny that contribute to cancer growth. CSCs are defined functionally as a potently tumorigenic, self-renewing population in vivo with the ability to differentiate and generate mature cell types reflective of the original tumor phenotype.
Of note, the definition and characterization of a CSC has no implications regarding its tumor cell-of-origin. For many cancers, CSC represent distinct populations that can be prospectively isolated from the rest of the tumor cells and can be shown to have clonal long term repopulation and self renewal capacity (Clarke et al., 2006). There is also some evidence suggesting that certain cancer cells exhibit plasticity by reversibly transitioning between a stem and non-stem cell state although this remains debated. Regardless, the stemness state is the main contributor to tumor growth and survival after therapy. It has been hypothesized that conventional cancer therapy reduces the tumor bulk but fail to prevent tumor recurrence and complete remissions due to incomplete eradication of CSC population. Therefore, CSC represents a potential target for better therapeutic intervention (Figure 1.1). However, not all cancers may follow a stem cell hierarchy(Quintana et al., 2008).
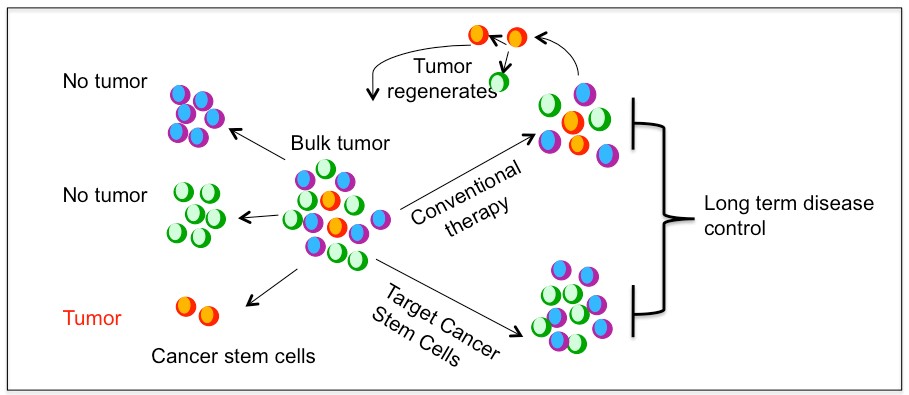
Figure 1.1. Cancer stem cell model and treatment approaches
1.3.2 Brain tumor stem cells
The first prospective isolation of human neural stem cells (NSC) using the CD133 cell surface marker (Uchida et al., 2000), prompted a search for brain tumor cells that shared similar characteristics to normal NSC. Using a similar premise as in leukemia CSCs, which shared many properties with their normal hematopoietic stem cells, the assay condition used for identification and characterization of normal NSC were used to address if self-renewing multipotent cells could be isolated from primary brain tumors.
Like normal NSCs, subpopulations of cells isolated from primary brain tumors also form neurosphere (clonal) colonies that are passagable when cultured at low densities in serum free medium containing epidermal growth factor (EGF) and basal fibroblast growth factor (bFGF) (Ignatova et al., 2002). Notably, these clonally derived neurospheres demonstrated core properties of self-renewal and ability to differentiate into neurons, astrocyte and oligodendrocytes and can regenerate tumor when injected subcutaneously or intracranially into immunodeficient mice (Galli et al., 2004; Hemmati et al., 2003; Ignatova et al., 2002; Singh et al., 2004).
Dirks and colleagues, in 2003, demonstrated that these stem cell characteristic were prospectively found to exist exclusively in the subpopulation of tumor cell expressing the CD133 stem cell marker(Singh et al., 2003). These primitive cells expressed stem cell markers like nestin, and has multipotent differentiation potential similar to normal NSC. When primary patient tumor cells were injected in vivo, as few as 100 CD133 cells had formed tumors while as many as 1x10⁵ CD133- tumor cells could not form tumors. Importantly, CD133 fraction recapitulates the histopathological features and cellular heterogeneity of the patient original tumors. These results led to identification of CSC in gliomas being initially defined by expression of cell surface marker CD133. However, subsequent studies showed that subpopulation of CD133- cells are also able to form tumors, and not all tumors express CD133, demonstrating the patient to patient heterogeneity of gliomas (Beier et al., 2007; Wang et al., 2008).
There are other reports indicating additional markers enriched for CSC subpopulation including CD15(Son et al., 2009), integrin α6(Lathia et al., 2010), CD36, A2B5(Ogden et al., 2008), L1CAM(Bao et al., 2008) and CXCR4(Ehtesham et al., 2009). Although all these markers further enhanced our understanding of CSC function and regulation, no single marker can definitively identify or define CSC. Due to this lack of definitive markers, functional validation is essential to ensure that the enriched cells truly exhibit the functional characteristic of stem cells. Various method both in vitro and in vivo are employed to assess the stem cell characteristic of enriched cells such as self renewal and ability to reproduce the complexity and heterogeneity of the original tumor. The gold standard for CSC determination is the ability of a limiting dilution of cells to recapitulate the complexity of the original patient tumor when transplanted orthotopically.
Finally, brain tumor stem cells can be enriched in serum free medium growth condition similar to normal NSC, as adherent monolayer culture on a poly-L-ornithine (PLO) /laminin matrix, and are potently tumourigenic with as few as 100 cells capable of initiating tumors that recapitulate heterogeneity of patient tumor(Pollard et al., 2009). We called these cells as GBM derived neural stem cells (GNS) in this thesis.
1.3.3 Clinical relevance of cancer stem cell model
In cancers that follow a CSC model, there are considerable clinical implications of functional differences between tumorigenic and non-tumorigenic populations. There exists a close relationship between CSCs, tumorigenesis and drug resistance in glioblastoma (Bao et al., 2006; Chen et al., 2012), breast cancer(Diehn et al., 2009; Li et al., 2008) and many other cancers, therefore targeting these CSC is hypothesized to enable more effective cancer therapy. The potential importance of a CSC model is realized in cancers where tumors expressing higher levels of a stem cell signature is highly predictive of patient outcome as shown in breast (Liu et al., 2007), colon (Merlos-Suarez et al., 2011), glioblastoma (Murat et al., 2008) and leukemia (Eppert et al., 2011), medulloblastoma (Vanner et al., 2014).
Similarly, brain cancer patients whose tumor cells self-renew and form tumourspheres in vitro have worse outcomes (Laks et al., 2009; Pallini et al., 2008). Cells with long term propagating potential will be positively selected and may therefore increase in frequency with cancer progression and greater stemness features may reflect more advanced and aggressive disease(Kreso and Dick, 2014). Another emerging feature of CSC is the resistance to conventional therapies in multiple cancers including GBM, where CSC fractions are more resistant to therapy compared to non-CSC (Chen et al., 2012; Ishikawa et al., 2007; Kreso et al., 2013).
As a result, stem cells are enriched after therapy and are likely the cause for relapse. These emerging evidence of stemness to prognosis and therapy failure implicate that therapeutic targeting of determinants of stemness might be an effective means to eradicate CSC and prevent relapse. However, targeting only self renewing CSC may not to be sufficient if non-stem cells have considerable proliferative potential or can revert to stem cell state. For example, in mouse glioma, genetic ablation of quiescent nestin temozolomide resistant cells prolong survival however when combined with ablation of cycling cells showed greater benefit (Chen et al., 2012). In this thesis, we attempt to identify compound that selectively effect human GBM derived neural stem cells (GNS) compared to normal human NSCs or fibroblasts.
1.4 Neurotransmitters/Neurochemicals
Neurotransmitters or neurochemicals are endogenous chemical messengers that are synthesized by a neurons and released into a synapse upon stimulation. They can transmit signals to a target cells; neurons, muscle cells or another effector cells, through binding to their respective receptors. Traditionally, neurotransmitters can be divided into three types based on the chemical structures as amino acid, monoamine and peptides. Amino acid neurotransmitters include glutamate, gamma aminobutryric acid (GABA) and glycine. Monoamine neurotransmitters include dopamine, norepinephrine, epinephrine, serotonin, histamine and melatonin. Peptides include substance P, neurotpeptide Y, opioids etc. Further, there are purines that includes adenosine triphosphate (ATP), adenosine, ATP and others including acetylcholine.
In this thesis we refer to all neurotransmitters as neurochemicals, as the term neurochemical appears more inclusive to all fast synaptic neurotransmitters as well as slow acting neuromodulators, which generally mediates neurotransmission through second messenger via metabotropic receptors (eg. dopamine) and has long lasting effects and diffuse into large areas of the brain.
1.4.1 Neurochemicals in normal neurogenesis
The thought that neurochemicals are primarily associated with synaptogenesis in mature neurons has been challenged and a crosstalk between neurochemicals and neurogenesis is beginning to emerge, suggesting neurochemicals are involved in the formation of neurons, not just in the function of neurons. There are several reports identifying new roles of neurochemicals in cell fate determination in a wide range of species both within and outside the CNS. Neurochemicals and their receptors are present and functionally important in organisms without a nervous system. For example, GABA and glutamate have been shown to regulate cell behavior in sponges (Ellwanger et al., 2007), and the antagonistic relationship between GABA and glutamate signaling in spore induction in Dictyostelium was established prior to the evolution of synaptic communication in CNS (Fountain, 2010).
Furthermore in mammals, GABA signaling in early embryos was seen long before the onset of neurogenesis (Andang et al., 2008). After the onset of developmental neurogenesis, neurochemicals form the chemical environment of neural cells impacts neurogenesis including proliferation, migration and differentiation in the developing telencephalon, ventral midbrain and retina(Heng et al., 2007; Kim et al., 2006; Martins and Pearson, 2008). Based on all these observations we can hypothesize that ancient function of neurochemicals, prior to the emergence of their role in neurotransmission, is critical to brain development in regulation of neurogenesis and later plasticity.
1.4.1.1 Neurochemicals in developmental neurogenesis
Cortical development involves precise coordination of neurogenesis and cell migration, where dorsally derived projection neurons migrate radially and ventrally derived interneurons migrate tangentially to populate the cortical plate as described earlier. Importantly, this tightly orchestrated process of neurogenesis and cell migration is crucial to brain development and later functions, where defects in cortical development may lead to mental retardation and changes in neurotransmitters levels have been observed in inherited complex neurological disorders such as autism (Lam et al., 2006), schizophrenia (Rehn and Rees, 2005) and epilepsy (Ben-Ari, 2006).
This tightly coupled and coordinated neurogenesis and cell migration is influenced by both intrinsic and extrinsic factors. Neurochemicals comprise the chemical environment of developing cortex and expression of functional neurochemical receptors have been reported in migrating neurons regulating the migration of both projection neurons and interneurons (Benitez-Diaz et al., 2003; Heng et al., 2007; Lujan et al., 2005; Nguyen et al., 2001). Specifically, amino acid neurotransmitters comprise the chemical environment of cortical progenitors and implicated in the regulation of their proliferation and cell cycle exit (Haydar et al., 2000). Several studies showed role of glutamate signaling in regulating cell migration by ventricular zone (VZ) cells. Dissociated cells from cortical VZ cells showed expression of functional N-methyl-D-aspartate (NMDA) receptors, and pharmacological manipulation of NMDA receptors has demonstrated its control over radial migration of VZ cells (Behar et al., 1999).
Furthermore, the NMDA receptor role in controlling radial migration from VZ cells was demonstrated using embryonic slices. Similarly, GABA signaling also demonstrated a role in regulating VZ cell migration. GABA is present in gradient fashion from low to high from VZ to the cortical plate (CP) and its receptor GABAA receptor has been detected in VZ as well as CP cells (Behar et al., 2000). Pharmacological manipulation using GABA A-C antagonist on embryonic brain slices impedes radial migration of VZ cells into the SVZ and showed GABAB receptor is required for regulating migration from SVZ to CP and GABAA receptor is required for arrest of cell migration at the CP (Behar et al., 2000). These studies showed cells of cortical VZ differentially integrate GABA and glutamate signaling through specific receptor subtype for the control of cell proliferation and radial migration (Figure 1.2A).
Additionally, glycine receptor signaling may also influence migrating neurons in developing cortex (Flint et al., 1998). Neurochemicals also regulate the tangential migration of interneurons in the developing telencephalon. There is increasing evidence of role of GABA signaling in the regulation of tangential migration by embryonic interneurons (Cuzon et al., 2006; Lopez-Bendito et al., 2003). GABA is present in the main migratory routes of the developing cortex and the embryonic interneurons express GABA receptors. Studies using tissue transplantation and brain slice cocultures demonstrated the importance and requirement of GABAA receptor signaling in migrating interneurons to cross the corticostriatal junction to populate the cortex (Cuzon et al., 2006).
Furthermore, GABA signaling through its GABAB receptor also influences the behavior of tangentially migrating interneurons as well as their choice of migratory route into the cortex. Besides GABA, other neurotransmitters such as dopamine have demonstrated to modulate tangential migration. Dopamine in the basal forebrain through its D1 receptors promote migration of GABAergic interneuron into the cortex, while D2 receptors have the opposite effect, impairing their migration from medial ganglion eminence (MGE) and caudal ganglion eminence (CGE)(Crandall et al., 2007; Ohtani et al., 2003). Dopamine, also through its D1and D2 receptors, have opposing effects on proliferation of neuronal progenitors from the lateral ganglion eminence. Altogether, these data suggest role of dopamine through D1 and D2 receptor in regulation of crucial cellular steps required for development of telencephalon.
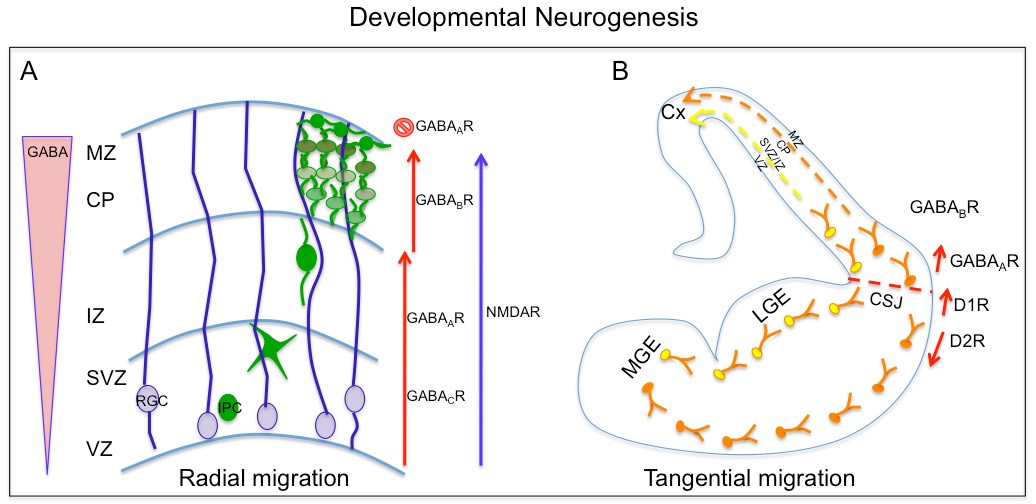
Figure 1.2. Neurochemicals in developmental neurogenesis
A. A schematic diagram showing GABA and glutamate’s role in radial migration of newborn excitatory neurons from radial glial cells (RGC) at ventricular zone to cortical plate (CP). B. Dopamine and GABA regulate tangential migration of interneurons generated in medial ganglion eminence (MGE) to cortical plate.
1.4.1.2 Neurochemicals in adult neurogenesis
Adult neurogenesis, confined to the SVZ of lateral ventricle and SGZ of dendate gyrus, is the life-long continuous production and functional integration of new neurons into existing neuronal network of CNS. In these locations, the brain can modify responses to external stimuli, as well as to learn and remember. Neurogenesis is under precise spatial and temporal control that can be modulated by both internal and external stimuli. Neurochemicals such as dopamine, serotonin and acetylcholine that are secreted by small group of neurons can affect neuronal activity through large brain areas. They have been shown to have long-range effects through neuronal projections into the SVZ. Neurochemicals such as GABA and glutamate, primarily confined to the synapse and responsible for fast synaptic transmission, have demonstrated effects on SVZ proliferation and neurogenesis (Berg et al., 2013). However, extra niche source of these neurochemicals remain to be explored.
Furthermore, there is also accumulating evidence that diseases and pathologic and physiologic states such as Alzheimer’s disease, seizures, sleep and pregnancy influences SVZ cell proliferation. Dopaminergic neurons originating from the substantia nigra have been shown to extend its projections into SVZ in rodents and primates (Freundlieb et al., 2006; Hoglinger et al., 2004). Dopamine receptors are also expressed in the precursor cells in the SVZ cells predominantly type C cells and type A neuroblast (Diaz et al., 1997; Hoglinger et al., 2004). As dopaminergic neurons project its axon into SVZ and the precursor cells in SVZ express dopamine receptors, it is conceivable that dopamine released from these afferents controls neurogenesis. Dopamine can impact neurogenesis at several developmental stages and in regions including the adult SVZ. Ablation of dopaminergic neurons in rodents by injection of selective neurotoxin such as 6hydroxydopamine (6-OHDA) or 1-methyl-4-phenyl-1,2,3,6-tetrahydropyridine (MPTP), resulted in decreased SVZ proliferation and OB neurogenesis, while administration of the dopamine agonists or precursor levodopa restores SVZ proliferation to near normal (Baker et al., 2004; Hoglinger et al., 2004; Winner et al., 2009; Yang et al., 2008).
However, there are conflicting reports on actual effects on dopamine on SVZ cell proliferation and neurogenesis (Berg et al., 2011; Kippin et al., 2005; Wakade et al., 2002). In vivo pharmacological manipulation using agonists or antagonists of selective dopamine receptors led to significant increases or decreases in SVZ neurogenesis in rodents as measured using injections of the S-phase marker bromodeoxyuridine (BrdU). In a study in which the dopamine receptor antagonist haloperidol was administered for 14 days an increase in proliferation and in number of label retaining cells (stem-like cells) in a dopamine D2 receptor dependent manner was shown (Kippin et al., 2005).
Another study using D3 receptor ligand reported no effect. There are discrepancies noted between studies and it may be due to the age and species of the animals, selectivity of the agonists or antagonists, activation of distinct subtype of dopamine receptors, at different developmental stages, and dopamine signaling may have different effect on stem cells and transient amplifying cells type C cells. There are reports suggesting that the dopamine-induced activation of SVZ neurogenesis is in part mediated through EGF dependent (Lao et al., 2013; O'Keeffe et al., 2009) or ciliary neurotrophic factor (CTNF) (Emsley and Hagg, 2003; Yang et al., 2008), both of which are known to promote proliferation in the SVZ. Considering the role of substantia nigra in reward, addiction and movement, we can speculate that SVZ cell proliferation and neurogenesis may be regulated by addictive behaviors and new movement based learning paradigms.
Furthermore, postmortem studies in human have identified dopaminergic fibers in contact with epidermal growth factor receptor (EGFR)-positive cells in the SVZ, which were presumably type C cells (Borta and Hoglinger, 2007; Hoglinger et al., 2004). Parkinson’s disease (PD), which is characterized by the loss of dopaminergic neurons in the substantia nigra, showed decreased neurogenesis in an animal model generated by ablating dopaminergic neurons in substantia nigra. In addition, examination of postmortem brains of PD patients have also shown decreased number of proliferative cells in the SVZ (Hoglinger et al., 2004). Serotonin (5-HT), another monoamine, is synthesized by neurons in the raphe nuclei, which regulates many aspects of behaviors including mood, sleep, appetite, reproductive activity and cognition. There are seven families of 5-HT receptors (5-HT1-7) and all except 5-HT3 are G protein coupled receptors. 5-HT3 is a ligand gated cation channel. There are several reports indicating serotonin and its receptors regulating cell proliferation and neurogenesis in SVZ(Banasr et al., 2004; Brezun and Daszuta, 1999).
A recent study has demonstrated that serotonergic axons originating from raphe nuclei form a dense plexus covering most of the wall of lateral ventricles contacting both ependymal cells and type B1 cells(Tong et al., 2014). B1 cells also express 5HT 2C and 5A receptors, and subraependymal release of 5HT increases SVZ cell proliferation, which is mediated primarily by 5HT2C receptor. Ablation of raphe nuclei results in decreased SVZ proliferation indicating 5HT axons directly interact with NSC to regulate neurogenesis (Tong et al., 2014). Also, pregnant mice have higher levels of serotonergic innervation in the SVZ that has been suggested to be responsible for increased SVZ proliferation
Interestingly, serotonergic projections originating from the raphe nucleus are also found in the DG. Depletion of these neurons leads to decreased proliferation in the DG and is rescued by grafting of fetal raphe neurons suggesting serotonin has stimulating effect on neurogenesis in DG(Brezun and Daszuta, 1999). GABA is the main inhibitory neurotransmitter released primarily by interneuron in the adult brain. It acts through activation of ionotropic ligand gated GABAA or GABAC receptors and Gprotein coupled GABAB receptors. The SVZ is located along the striatum, which is predominantly composed of GABAergic neurons. In addition, nitric oxide containing GABAergic striatal neurons project into the SVZ. These neurons may provide an activity dependent GABAergic control of SVZ neurogenesis.
Furthermore, vesicular GABA transporter expression (VGAT) has been reported in the SVZ in agreement with the presence of GABAergic inputs form the striatum. GABA has significant impact on several phases of SVZ neurogenesis such as proliferation of astrocyte like stem cells and type A neuroblasts, neuroblast migration. Migrating neuroblasts spontaneously release GABA in a non-vesicular fashion, which tonically activate GABAA receptors on progenitor cells (Liu et al., 2005; Nguyen et al., 2003). This GABA dependent depolarization of neural precursors inhibits cell proliferation and neuronal differentiation thus functioning in part as negative feedback signal derived form neuroblast, down-regulating their own production. This inhibition of stem cell proliferation by GABA A receptor is mediated through a mechanism involving phosphorylation of the histone variant H2AX(Fernando et al., 2011). The same mechanism was also observed in the GABA mediated control of the embryonic stem cell proliferation. Interestingly, type B1 and C cells secrete the diazepam-binding inhibitor protein (DBI), which competitively inhibits GABA from binding to GABA receptors, increasing the proliferation and neurogenesis of SVZ (Alfonso et al., 2012).
In the adult dendate gyrus, tonic GABA release from parvalbumin-positive interneuron maintains quiescent state of adult NSC through γ2 subunit containing GABAA receptor (Song et al., 2012). Glutamate is an excitatory neurotransmitter, GABA’s counterpart, and is also known to affect SVZ neurogenesis. Glutamate signals through ionotropic AMPA, kainite and NMDA receptors as well as metabotropic glutamate receptors mGlur1-8 receptors. In the SVZ, glutamate receptors such as mGluRs and kainate have been observed on Type A neuroblast cells but not on Type B and C cells (Di Giorgi-Gerevini et al., 2005; Platel et al., 2010). The source of glutamate appears to be astrocytes in SVZ, which is found to express vesicular glutamate transporter 1 (Vglut1) (Platel et al., 2010). Glutamate in SGZ is better characterized. Glutamatergic input in DG comes from dendate granule cells, neurons in layer II of the entorhinal cortex and contralateral hilar mossy cells (Kumamoto et al., 2012; Witter, 2007). NMDA and AMPA receptors were not detected on RGL cells but in vivo administration of agonist of NMDA receptor reduces proliferation while an antagonist increases proliferation of progenitor cells in DG (Cameron et al., 1995; Kitayama et al., 2003).
Ablation of entorhinal cortex leads to increased proliferation suggesting the glutamate source for the DG. Acetylcholine was the first neurotransmitter discovered and is produced by cholinergic neurons present in small number but its afferents are spread throughout the brain. Cholinergic signaling is important in the modulation of various brain states including learning, memory consolidation, attention and sleep. Its receptor includes ionotropic nicotinic and metabotropic muscarinic ACh receptors. Cholinergic input involving a population of choline acetyltransferase (ChAT) neurons are reported to be present in SVZ niche and these neurons are morphologically distinct from other striatal neurons (Paez-Gonzalez et al., 2014). Optogenetic manipulation of subependymal ChAT neurons have demonstrated that they are sufficient to increases neurogenic proliferation, partly through synergizing with fibroblast growth factor (FGF) receptor activation.
Studies have shown that lesion in cholinergic inputs decreases the number of newly born neurons in the OB. Similarly, activation of cholinergic signaling with donepezil enhanced the survival of newly born OB neurons (Kaneko et al., 2006). In contrast, knockout of nicotinic beta-2 animals show increased survival of newly born neurons in the OB. Thus, acetylcholine has a complex effect on neuronal survival in the OB. In dendate gyrus, cholinergic input from the medial septum and fibers expressing choline acetyltransferase has been observed in close proximity to progenitors (Kaneko et al., 2006). Muscarinic acetylcholine receptors have been seen on RGLs (type B cells) and ablation of cholinergic neurons in the adult brain lead to reduced proliferation in the SGZ (Mohapel et al., 2005). Taken together, all these studies indicated that the SVZ and SGZ are recipients of brain neural circuit and neural activity can influence adult neurogenesis (Figure1.3). However, the understanding on activation of different neuronal pathways and the regulation of neuronal production remains to be elucidated. Here in this thesis, we attempt to understand neurochemical’s influence on directing human NSC fate by using a small molecule approach in vitro.
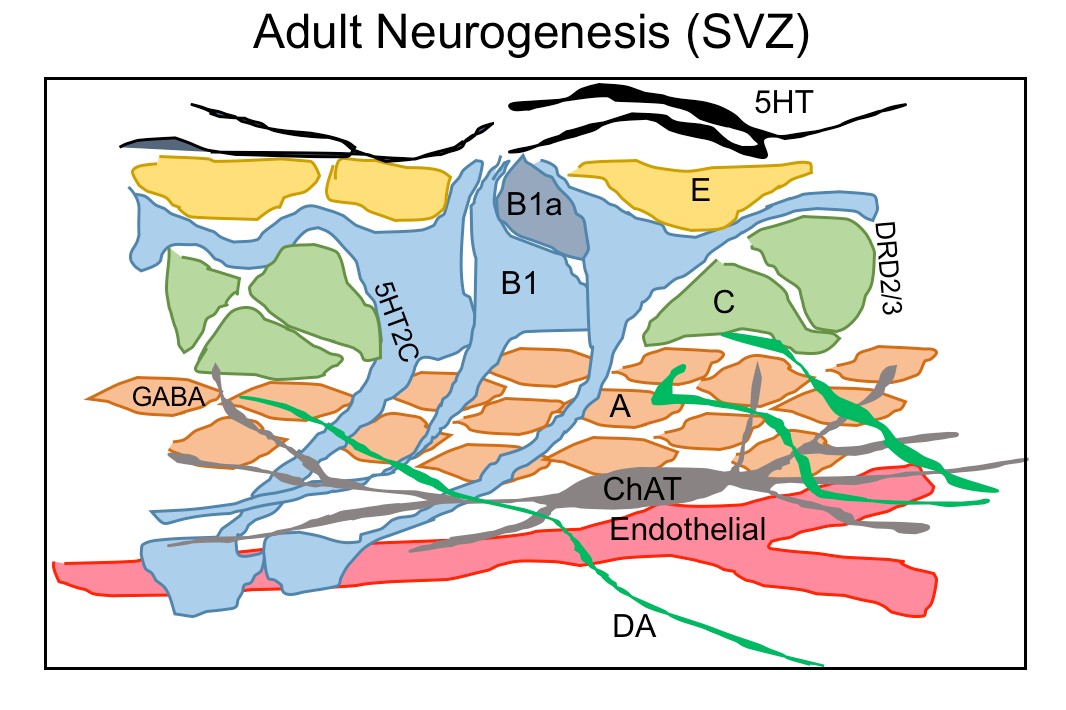
Figure 1.3. Neurochemicals regulate adult neurogenesis in SVZ
A schematic diagram showing the ventricular-subventricular zone organization of astrogial neural stem cells (B1), which give rise to activated B1 (B1a) that generates transit amplifying cells (C) and then migrating neuroblasts (A). A rich network of different neurons projects their axons into SVZ neurogenic niche such serotonergic axon (5HT) contacting B1 cells and ependymal cells(E), choline acetyltransferase(ChAT) neurons and dopaminergic terminals(DA) extending into SVZ region contacting type C and A cells.
1.4.2 Neurochemicals in cancer
All organs and body parts are innervated by peripheral nerves, which connects it to CNS and orchestrate tissue homeostasis by releasing neurochemicals. A tumor is not a completely independent entity; it depends strongly on its microenvironment. The communication between tumor cells and the microenvironment drives the process of tumor progression. Tumor growth and progression depends highly on the formation of blood vessels (angiogenesis) and lymphatic vessels (lymphanangiogenesis) in tumor microenvironment (Alitalo et al., 2005; Folkman et al., 1971).
Likewise, the role of infiltrating nerves in tumor microenvironment is beginning to emerge. Aside from the role of nerve fibers attracting cancer cell to invade and migrate, it has been proposed that cancer cells stimulate their own innervation termed as neoneurogenesis (Palm and Entschladen, 2007). Tumor cells can exploit the neurochemicals released by nerve fibers to stimulate tumor growth and dissemination, and alternatively tumors cells can stimulate neurite growth by releasing neurotrophic growth factor and axon guidance molecules (Ayala et al., 2006). The neuronal influence on tumor growth was initially described several decades ago and the presence of nerve endings within the tumors has been shown in bladder (Seifert et al., 2002), prostrate(Magnon et al., 2013; Ventura et al., 2002), breast (Tsang and Chan, 1992) and pancreatic (Kayahara et al., 2007).
But the landmark studies that clearly demonstrated the involvement of nervous system in tumor progression comes from the work of Magnon and colleagues, who demonstrated that autonomic nerve sprouting in prostrate tumors is essential for prostrate cancer progression (Magnon et al., 2013). Both sympathetic and parasympathetic nerves were required throughout the prostrate cancer development in mouse. The early phase of tumor development was preventable by sympathectomy or genetic deletion of β-adrenergic receptors and tumor were also infiltrated by parasympathetic cholinergic fibers that promotes cancer dissemination.
Furthermore, in human prostrate cancer, the density of nerves was directly correlated to the Gleason score and tumor progression. Another study on gastric cancer in a mouse model also showed that denervation of the stomach by surgical or pharmacological neurotoxic agents dramatically reduced tumor incidence and progression, through inhibition of WNT signaling and subsequent suppression of stem cell expansion mediated through cholinergic signaling (Zhao et al., 2014). There are also numerous studies that showed role of neurochemicals and their receptors in stimulating cancer cell growth through activation of corresponding signaling pathways. Cancer incidence and progression seems to be strongly dependent on psychosocial factors. Stress can induce the release of neurochemicals that will further influence tumor development and progression (Antoni et al., 2006; Thaker et al., 2006).
The most studied neurochemicals for their role in cancer growth and progression is catecholamine, stress mediators. The most common catecholamine, epinephrine (E) and norepinephrine (NE), secreted mainly from adrenal medulla and sympathetic nerves respectively, have been linked to stress induced tumor growth and progression. NE and E exert their functions through α and β adrenoreceptors. These neurochemicals can modulate cell proliferation, survival and migration through the activation of β-adrenergic receptors shown in ovarian (Thaker et al., 2006), breast (Badino et al., 1996), and colon (Masur et al., 2001) cancer models. Dopamine, another catecholamine neurochemical precursor in synthesis of NE and E, has an opposite effect to that of epinephrine and norepinephrine. Dopamine is reported to have inhibitory effect on cancer growth such as breast and colon cancer (Chakroborty et al., 2008; Chakroborty et al., 2004). However, dopamine by itself doesn’t effect the proliferation and survival of cancer cells rather its inhibition is mediated indirectly through inhibiting VEGF- induced angiogenesis and prolactin secretion, a growth factor for cancer cells (Basu et al., 2001; Clevenger et al., 1995).
These effects of dopamine are mainly mediated by dopamine D2 receptor, which are expressed in tumor endothelial cells. However, the role of dopaminergic system in cancer growth is not clear and has no consensus. Acetylcholine is the neurochemical of parasympathetic nerve and its activity is mediated by nicotinic and muscarinic acetylcholine receptors. The role of cholinergic signaling in regulation to cancer was first demonstration of the potential role of autonomic nervous system in cancer. Cigarette smoking is involved in causing many cancers and nicotine is the one of the main component that is related to addiction. Nicotine induces its biological effects through binding to nAChRs. Nicotine and its byproduct, tobacco specific nitrosamine 4 (methylnitrosamino)-1-(3pyridyl)-1-butanone (NNK) were shown to influence cell proliferation through nAChRs in lung (Schuller, 1989), colon (Wong et al., 2007) and breast cancers (Jimenez and Montiel, 2005). Similarly, amino acid neurotransmitters like glutamate and GABA have been shown to influence many cancers. The discovery of the neural impact in prostrate and gastric cancer sheds a new light on the role of autonomic neurotransmitters on tumor cell growth, as nerve fibers release these neurochemicals directly into the vicinity of cancer cells to stimulate their survival, proliferation and ability to spread. However, how generalize the neural involvement in cancer progression is not well understood. Brain tumors originate in a neurochemical rich milieu, but very little is known about its impact on brain tumor growth. In this thesis, we investigate neurochemicals’ role in brain tumors using a small molecule approach.
1.5 Dopamine and its receptors
Dopamine is a monoamine neurotransmitter, which control a variety of functions in human CNS including cognition, emotion, motor activity, feeding. Dopamine also plays an important physiological role in regulating retinal processes, olfaction, hormonal regulation, renal functions and cardiovascular functions (Carlsson, 2001; Missale et al., 1998; Vallone et al., 2000). Dysregulation of dopaminergic system is linked to several pathological conditions such as Parkinson’s disease, schizophrenia, attention-deficit hyperactivity disorder (ADHD), bipolar disorder and depression (Niznik and Van Tol, 1992; Seeman, 2006).
In the human CNS, dopamine is predominantly synthesized in the neurons of four major dopaminergic pathways namely nigrostriatal, mesolimbic, mesocortical and tuberoinfundibular pathways (Anden et al., 1964; Dahlstroem and Fuxe, 1964). Dopamine is synthesized from the amino acid tyrosine in a two step enzymatic process, where the first limiting reaction is the conversion of tyrosine into L-3,4-dihydroxyphenylalanine (L-DOPA) catalyzed by tyrosine hydroxylase (TH). The second step involves production of dopamine by decarboxylation of DOPA by aromatic L-amino acid decarboxylase (AADC) (Vallone et al., 2000). Dopamine also serves as a potential intermediate substrate in the biosynthesis of catecholamine such as epinephrine and norepinephrine in other neurons and adrenal medulla. Unlike excitatory or inhibitory neurochemicals, dopamine is a neuromodulator that alters the response of a target neuron to other neurochemicals and that can alter synaptic plasticity. Dopamine does not mediate fast synaptic transmission but modulates it by triggering slow acting effects through signaling cascades.
1.5.1 Structural characteristics of dopamine receptors
Dopamine exerts its physiological function in the CNS and periphery by five distinct but closely related dopamine receptors, which belong to a family of G protein coupled receptors (GPCR) namely D1, D2, D3, D4 and D5 (Beaulieu and Gainetdinov, 2011). Biochemical studies on dopamine receptors based on the stimulation of cyclic adenosine monophosphate (cAMP) production and ligand binding assays led to the classification of dopamine receptors into two subgroups. In 1978, Spano and group demonstrated that dopamine receptors could exits in two distinct subgroups and that only one subgroup was positively coupled to adenylate cyclase (AC) (Spano et al., 1978), and this subsequently led to classification of D1 and D2 subtypes based on ability to modulate cAMP production and pharmacological properties (Kebabian and Calne, 1979).
Based on their structural, pharmacological and biochemical properties, dopamine receptors are now classified as D1-like receptors (D1 and D5) and D2-like receptors (D2, D3 and D4) (Andersen et al., 1990; Niznik and Van Tol, 1992). The subfamilies of D1-like and D2-like receptors share high level of homology of their transmembrane domain and have distinct pharmacological properties. The D1-like receptors activate adenylate cyclase (AC) through Gαs/olf family of G protein to increase cAMP levels and are found exclusively in postsynaptically on dopamine-receptive cells. The D2-like class of receptors inhibits AC through Gαi/o family of G proteins and inhibits cAMP production and are expressed in both postsynaptically on dopamine target cells and presynaptically on dopaminergic neurons(Rondou et al., 2010; Sokoloff et al., 2006).
The two subtypes are also different at the level of genetic structure, primarily in the presence of introns in their coding sequences. The genes encoding D1-like receptors lacks introns and share 80% homology in their transmembrane domain, while genes encoding D2-like receptors are interrupted with introns; six introns in D2, five in D3 and four in D4 (Gingrich and Caron, 1993). D2 receptor shares a 75% homology with the D3 receptor and 53% homology with the D4 transmembrane domain (Missale et al., 1998). The NH2-terminal domain of all dopamine receptors has similar number of amino acid residues and carries a variable number of consensus N-glycosylation sites; D1 and D5 possess two sites, D2 has four and D3 has three and D4 has only one potential N-glycosylation sites.
The COOHterminal tail for the D1-like receptors are about seven times longer than the D2-like receptors. The D1-like receptors has short third intracellular loop, typical for receptors interacting with Gstimulatory (Gs) proteins to stimulate cycle AMP production, whereas the D2-like receptors has a long third intracellular loop typical for receptors interacting with G-inhibitory (Gi) protein, to inhibit cyclic AMP production.
The third intracellular loop is the responsible for the G protein coupling and signal transduction(Missale et al., 1998; Pivonello et al., 2007). The genetic organization of D2-like receptors with presence of introns provides the basis of receptor splice variants. For example, the D2 receptors exist in two main variants, the long isoform D2L and the short isoform D2S, generated by an alternative splicing of an 87bp exon between intron 4 and 5. (Giros et al., 1989; Monsma et al., 1989) The two D2 isoforms differ in the presence or absence of 29 amino acid residues in the third intracellular loop and has similar pharmacological but different functional characteristics. The D3 receptor was reported to have splicing variant of non-functional proteins. The D4 receptor shows the existence of polymorphic variations within the coding sequence, having 48bp repeats of two (D4.2), four (D4.4), seven (D4.7) or eleven (D4.11) fold repeat sequence(Van Tol et al., 1992). Therefore, the D4 receptor variants differ in their length of the third cytoplasmic loop and have two, four, seven or eleven repeat of the same insert of 16 amino acids residue in their protein structure. The D5 receptor has two related pseudogenes, which share a 95% homology with gene and encode for truncated nonfunctional forms of the receptor.
1.5.2 Functional characteristics of dopamine receptors
Dopamine receptors mediate the effect of dopamine and dopaminergic compounds through a number of different signaling mechanisms. In general, dopamine receptor function is known to signal through G-protein that contain nucleotide binding Gα subunit and a heterodimeric Gβγ subunits, which mediates signaling through modulating the levels of cAMP and protein kinase A (PKA) activity. The D1-like receptors are coupled to Gαs/olf proteins and stimulate the activity of AC and production of cAMP. In contrast, the D2-like receptors are coupled to Gαi/o proteins and inhibits the production of cAMP(Kebabian and Greengard, 1971). Growing evidence suggests dopamine receptors can signal through other pathways independent of AC modulation depending on the brain area, physiological and pathological conditions.
1.5.2.1 cAMP mediated dopamine receptor signaling
cAMP mediated signaling is the canonical pathway activated by dopamine receptors. cAMP is an important second and ubiquitous messenger for many signaling pathways and can influence various effectors such as PKA and other exchange proteins activated by cAMP (Epac1 and EPac2). Among all the PKA substrates affected by dopamine receptors such as CREB, ionotropic glutamate receptors (AMPA and NMDA), ion channels, the most extensively studied molecule is the 32-kDa dopamine and cAMP regulated phosphoprotein (DARPP-32/PPP1R1B). DARPP-32 is a multifunctional phosphoprotein that acts as an intermediate component of multiple neurochemical signaling including dopamine(Svenningsson et al., 2004). Phosphorylation of DARPP32 at Thr34 by PKA induces the inhibition of the protein phosphatase 1 (PP1) (Hemmings et al., 1984).
In contrast, phosphorylation of DARPP-32 on Thr75 by cyclin dependent kinase 5 (CDK5) induces the inhibition of PKA causing a feedback loop in the activation of the PKA (Bibb et al., 1999). The direct regulation of DARPP-32 phosphorylation at Thr34 by dopamine receptor has been shown in vivo studies where in D1 expressing neuron, enhanced dopamine receptor stimulation results in increased phosphorylation of DARPP-32, whereas stimulation of D2 receptor reduces the phosphorylation of DARPP-32 at Thr34, as a consequence of reduction in the PKA activation(Bateup et al., 2008). Furthermore, the activation of PKA or inhibition of PP1 mediated by PKA, may cause direct changes in the phosphorylation of two subunits of ionotropic glutamate receptors GluA1 (AMPA) and GluN2B (NMDA), which are involved in glutamatergic signaling (Greengard et al., 1999) (Figure 1.4).
The recent interesting development of cAMP mediated dopamine signaling is its regulation of mRNA translation mechanism, where either D1 receptor activation or blocking D2 receptor by haloperidol increased the phosphorylation of the ribosomal protein S6 (rpS6) on Ser235/236 and Ser240/244 (Santini et al., 2009; Valjent et al., 2011). The rpS6 is a component of the small 40S ribosomal subunit implicated in mRNA decoding. RpS6 is phosphorylated at multiple site comprised between Ser235 and Ser247 by p70rpS6 kinase (S6K), which is a major downstream effector of the mammalian target of rapamycin complex1(mTORC1). Phosphorylation of rpS6 at the dual site Ser 235/236 occurs also independently of mTORC1, via the p90 ribosomal S6 kinase (RSK), which are activated by the ERK pathway. In both studies, increased phosphorylation of rpS6 was mediated through activation of PKA and subsequent inhibition of PP1 by DARPP-32, and activation via D1 receptor was dependent on mTOR pathway while haloperidol study was independent of mTOR and ERK pathway. The mechanism of dopamine receptor mediated regulation of rpS6 on mRNA translation is still in an early stage.
1.5.2.2 cAMP independent dopamine receptor signaling
Dopamine receptors can also exert their biological effect through alternative signaling pathways such as transactivation of receptor tyrosine kinases (RTKs), direct interaction regulating calcium channels, Na -K -ATPase, Gβγ mediated activation of PLC, and regulation of L- and N-type calcium channels, as well as G protein coupled inwardly rectifying potassium channels (GIRKS), Gαq coupled regulation of PLC and IP3 (Beaulieu and Gainetdinov, 2011). Interestingly, all G protein mediated signaling converge on, among many other targets, phosphorylation of two subunits of ionotropic glutamate receptors GluA1 and GluN2B, which are involved in glutamatergic transmission (Jenkins et al., 2014)(Figure 1.3). D2-like receptor can signal through alternative mechanisms involving the multifunctional adaptor protein β-arrestin 2 (βArr2). Arrestins are family of four molecular adaptor proteins that were originally characterized for their role in mediating GPCR desensitization and internalization (Lohse et al., 1990).
In addition, βArr1 and βArr2 are known to act as molecular scaffolds for kinases and phosphatases. Dopamine D2 receptor is shown to signal through βArr2 mediated mechanism in the regulation of serine/threonine kinase Akt and glycogen synthase kinase (GSK3) supported by direct in vivo biochemical observations in pharmacological and genetic models of enhanced dopaminergic neurotransmission (Beaulieu et al., 2005). D2-like receptors are also known to activate cell proliferation related pathways such as mitogen activated protein kinase (MAPK)/ERK1/2 pathway shown in various cell lines (Beom et al., 2004), and ERK pathways can also be activated through the D2R-β-arrestin complex once the receptor is internalized(Lefkowitz and Shenoy, 2005). Dopamine receptors are also known to transactivate many RTKs. RTK are a major family of cell surface receptor involved in many functions in both neuronal and non-neuronal cell types. RTK activation generally lead to activation of several downstream signaling pathways such as PI3K/Akt, Ras/MAPK and PLC mediated signaling.
In addition to direct activation by their ligands, RTKs can also be transactivated by GPCRs. The dopamine receptors are reported to transactivate RTK such as the platelet derived growth factor β receptor (PDGFRβ), insulin-like growth factor 1 receptor (IGFR1), epidermal growth factor receptor (EGFR) and BDNF receptor, neurotrophic tyrosine kinase, receptor type 2 (TrKB) (Chi et al., 2010; Iwakura et al., 2008; Swift et al., 2011). However, the mechanisms by which dopamine receptors transactivate RTKs are not fully understood. Release of EGF appears to be play a role in transactivation of EGFR by D2 receptor (Yoon and Baik, 2013).
RTKs are coupled to signaling mechanism that can elicit different cellular responses, which are beyond direct effect of G protein or arrestin mediated cellular responses. For example, although stimulation of D2 receptor leads to βArr2 dependent inactivation of Akt, the opposite has been seen where Akt is activated by D2 receptor stimulation attributed by transactivation of IGFR and concomitant activation of PI3K-mediated signaling by IGFR.
A B 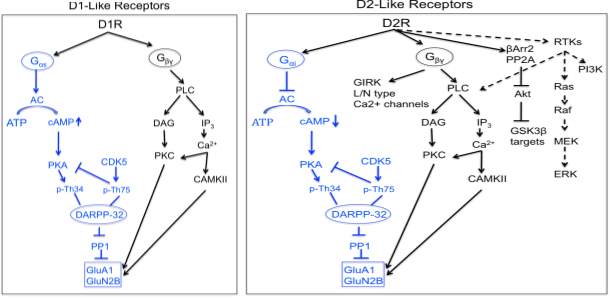
Figure 1.4. D1-like and D2-like receptor mediated signaling
1.5.3 Dopamine D4 receptor
In 1991, Van Tol and group first identified and cloned the dopamine D4 receptor (DRD4) gene (Van Tol et al., 1991). Subsequently, DRD4 gene was reported to contain considerable variation in human gene and documented to be among the most highly polymorphic genes in human genomes(Chang et al., 1996; Lichter et al., 1993; Van Tol et al., 1992). Because of its highly polymorphic nature and its association with many neurological disorder and behavior, there was great interest in this gene. DRD4 is located on the chromosome11 (11p15.5), contains four exons and transcription site at 400-500bp upstream, whereas the promoter sequence is located further upstream of the transcription site (Kamakura et al., 1997; Van Tol et al., 1991). The DRD4 gene contains a large number of polymorphism in its coding sequence and most extensive in exon3 region that codes for the third intracellular loop (IC3) of the receptor (Van Tol et al., 1992). This polymorphism consists of a variable number of 48bp tandem repeats (VNTR) existing as 2-11 repeats denoted as D4.2 to D4.11, the length of each variant is (no of repeats X 16 amino acids). The DRD4 allele frequencies of the different variants are very heterologous where the most frequent variant is D4.4 (64%) followed by D4.7 alleles (21%) and the D4.2 (8%) (Chang et al., 1996). However, there is a difference in the allele frequency among different population. For example, in Asian population D4.7 allele occur occasionally (<1%), whereas D4.2 allele is more frequent (18%). Interestingly, D4.7 alleles are reported to be five to ten times younger than the common D4.4 alleles but have increased in frequency by positive selection(Ding et al., 2002).
1.5.3.1 Dopamine D4 receptor signaling
D4 is a D2-like receptor primarily known to activate through Gαi/o protein inhibiting AC and thereby reduces intracellular concentration of the second messenger cAMP. The VNTR polymorphism in the IC3 of D4 receptor appears to be important region for AC coupling and G proteins (Kazmi et al., 2000; Oldenhof et al., 1998). For example, D4.7 receptor variant has two to three fold lower potency for dopamine mediated coupling to AC than the D4.2 and D4.4 receptors(Asghari et al., 1995). While D4.10 receptor is two to threefold more potent in AC coupling than the D4.2 receptors (Jovanovic et al., 1999). Activation of D4 receptor inhibits AC and reduces cAMP level, which is an important and ubiquitous second messenger that further inhibits downstream effectors such as PKA and DARPP-32. DARPP-32 is an intermediate in many signaling pathways activated by various neurochemicals, integrating their action and provides link to other effectors and transcription factors (Le Novere et al., 2008).
Furthermore, D4 receptor activation has been shown to activate NFkB, an important transcription factor that plays a role in inflammation (Zhen et al., 2001), to induce kruppel-like factor-2 (KLF2), a critical regulator of quiescence in T-lymphocytes (Sarkar et al., 2006) and c-Fos expression, which upon dimerization with c-jun forms the transcription factor AP-1 that activates transcription of gene involved in proliferation, differentiation, defense against invasion and cell damage (Bitner et al., 2006) (Figure 1.5). D4 receptor also modulates many signaling pathway in addition to AC, including phopholipases, ion channels, MAP kinases and NA /H exchange. Many of these pathways are regulated by Gβγ protein subunits that are released by receptor activation of Gαi/o proteins. D4 receptor activity influences the intracellular calcium levels through different mechanism depending on the cell types (Rondou et al., 2010), and increase in calcium levels leads to the activation of CaMKII, which in turn regulate other targets such as AMPA receptors. D4 receptor also influences different types of potassium channels. D2 and D4 receptor interact with G protein coupled inwardly rectifying potassium channel;kir3 (GIRK), an important regulator of cellular excitability, the opening which reduces the firing rate of neurons(Lavine et al., 2002).
Dopamine was shown to stimulate D4.2, D4.4 and D4.7 receptors and modulate GIRK currents through Gi/o proteins in Xenopus oocytes(Wedemeyer et al., 2007). D4 receptors can also induce arachidonic acid release (Piomelli et al., 1991)and affect the activity of Na /H exchangers, which regulate intracellular pH, extracellular acidification and cell volume (Felder et al., 1990). D2-like receptors are also reported to activate cell proliferation related pathways such as mitogen activated protein kinase (MAPK) signaling, more specifically the extracellular signal regulated kinase ERK1 and ERK2 (Narkar et al., 2001). Furthermore, this ERK activation upon dopamine D4 receptor stimulation is dependent on transactivation of PDGFβ receptor (Oak et al., 2001) and D4 receptor can also transactivate intracellular PDGFβ receptors (Gill et al., 2010). However, there was no difference in the magnitude or duration of ERK activation amongst different D4 variants (D4.2, D4.4 and D4.7).
In vivo studies have demonstrated that this transactivation of PDGFβ receptor by D4 receptor leads to depression of excitatory glutamatergic transmission mediated through NMDA receptors(Kotecha et al., 2002; Oak et al., 2001). Although the precise mechanism of D4 receptor transactivation of PDGFβ receptor is not clear, these finding suggests an important role of RTKs in the regulation and communication of dopamine and glutamate signaling in CNS, defects of which have been implicated in neurological disorders such as ADHD and schizophrenia. Dopamine D4 receptor also modulate GABA signaling in pyramidal neurons of prefrontal cortex by decreasing the functional GABAA receptor level at the plasma membrane by decreasing its transport through actin depolymerization(Graziane et al., 2009; Wang et al., 2002). Dopamine receptor interacting protein (DRIP) have been characterized in D2-like receptors, where GPCR like dopamine receptors are concentrated in a specialized distinct microdomain such as lipid rafts or caveolae to enhance the speed and specificity of GPCR signaling by recruiting different signaling components to form dynamic complexes that contributes to fine tuning of the downstream signaling complexes. Dopamine D4 receptor contains a proline rich sequences in the polymorphic regions of IC3, which can interact with SH3 domain containing proteins(Oldenhof et al., 1998). A strong interaction has been detected with Grb2 and Nck, two adaptor proteins capable of recruiting multi-protein complexes to the receptor and influencing cell proliferation, cell movement, axon guidance etc. Mutant receptor with removal of this putative binding site can still bind dopamine and G protein but fails to couple with AC. Furthermore, the SH3 domains of the D4 receptor are involved in control of receptor internalization. D4 receptor also interacts with another DRIP such as GIRK, which modulates ion passage in response to D4 stimulation.
Interestingly, a more specific DRIP to D4 receptor but not to other dopamine receptor subtypes is the BTB-Kelch protein KLHL12, that binds specifically to the polymorphic region of the D4 receptor and function as a substrate specific adaptor in a Cul3-based E3 ubiquitin ligase complex for subsequent ubiquitination of the D4 receptor(Rondou et al., 2008) (Figure 1.5). Dopamine D4 receptor is also reported to form oligomers that plays a role in receptor biogenesis and different polymorphic variant has different affinities (Van Craenenbroeck et al., 2011).
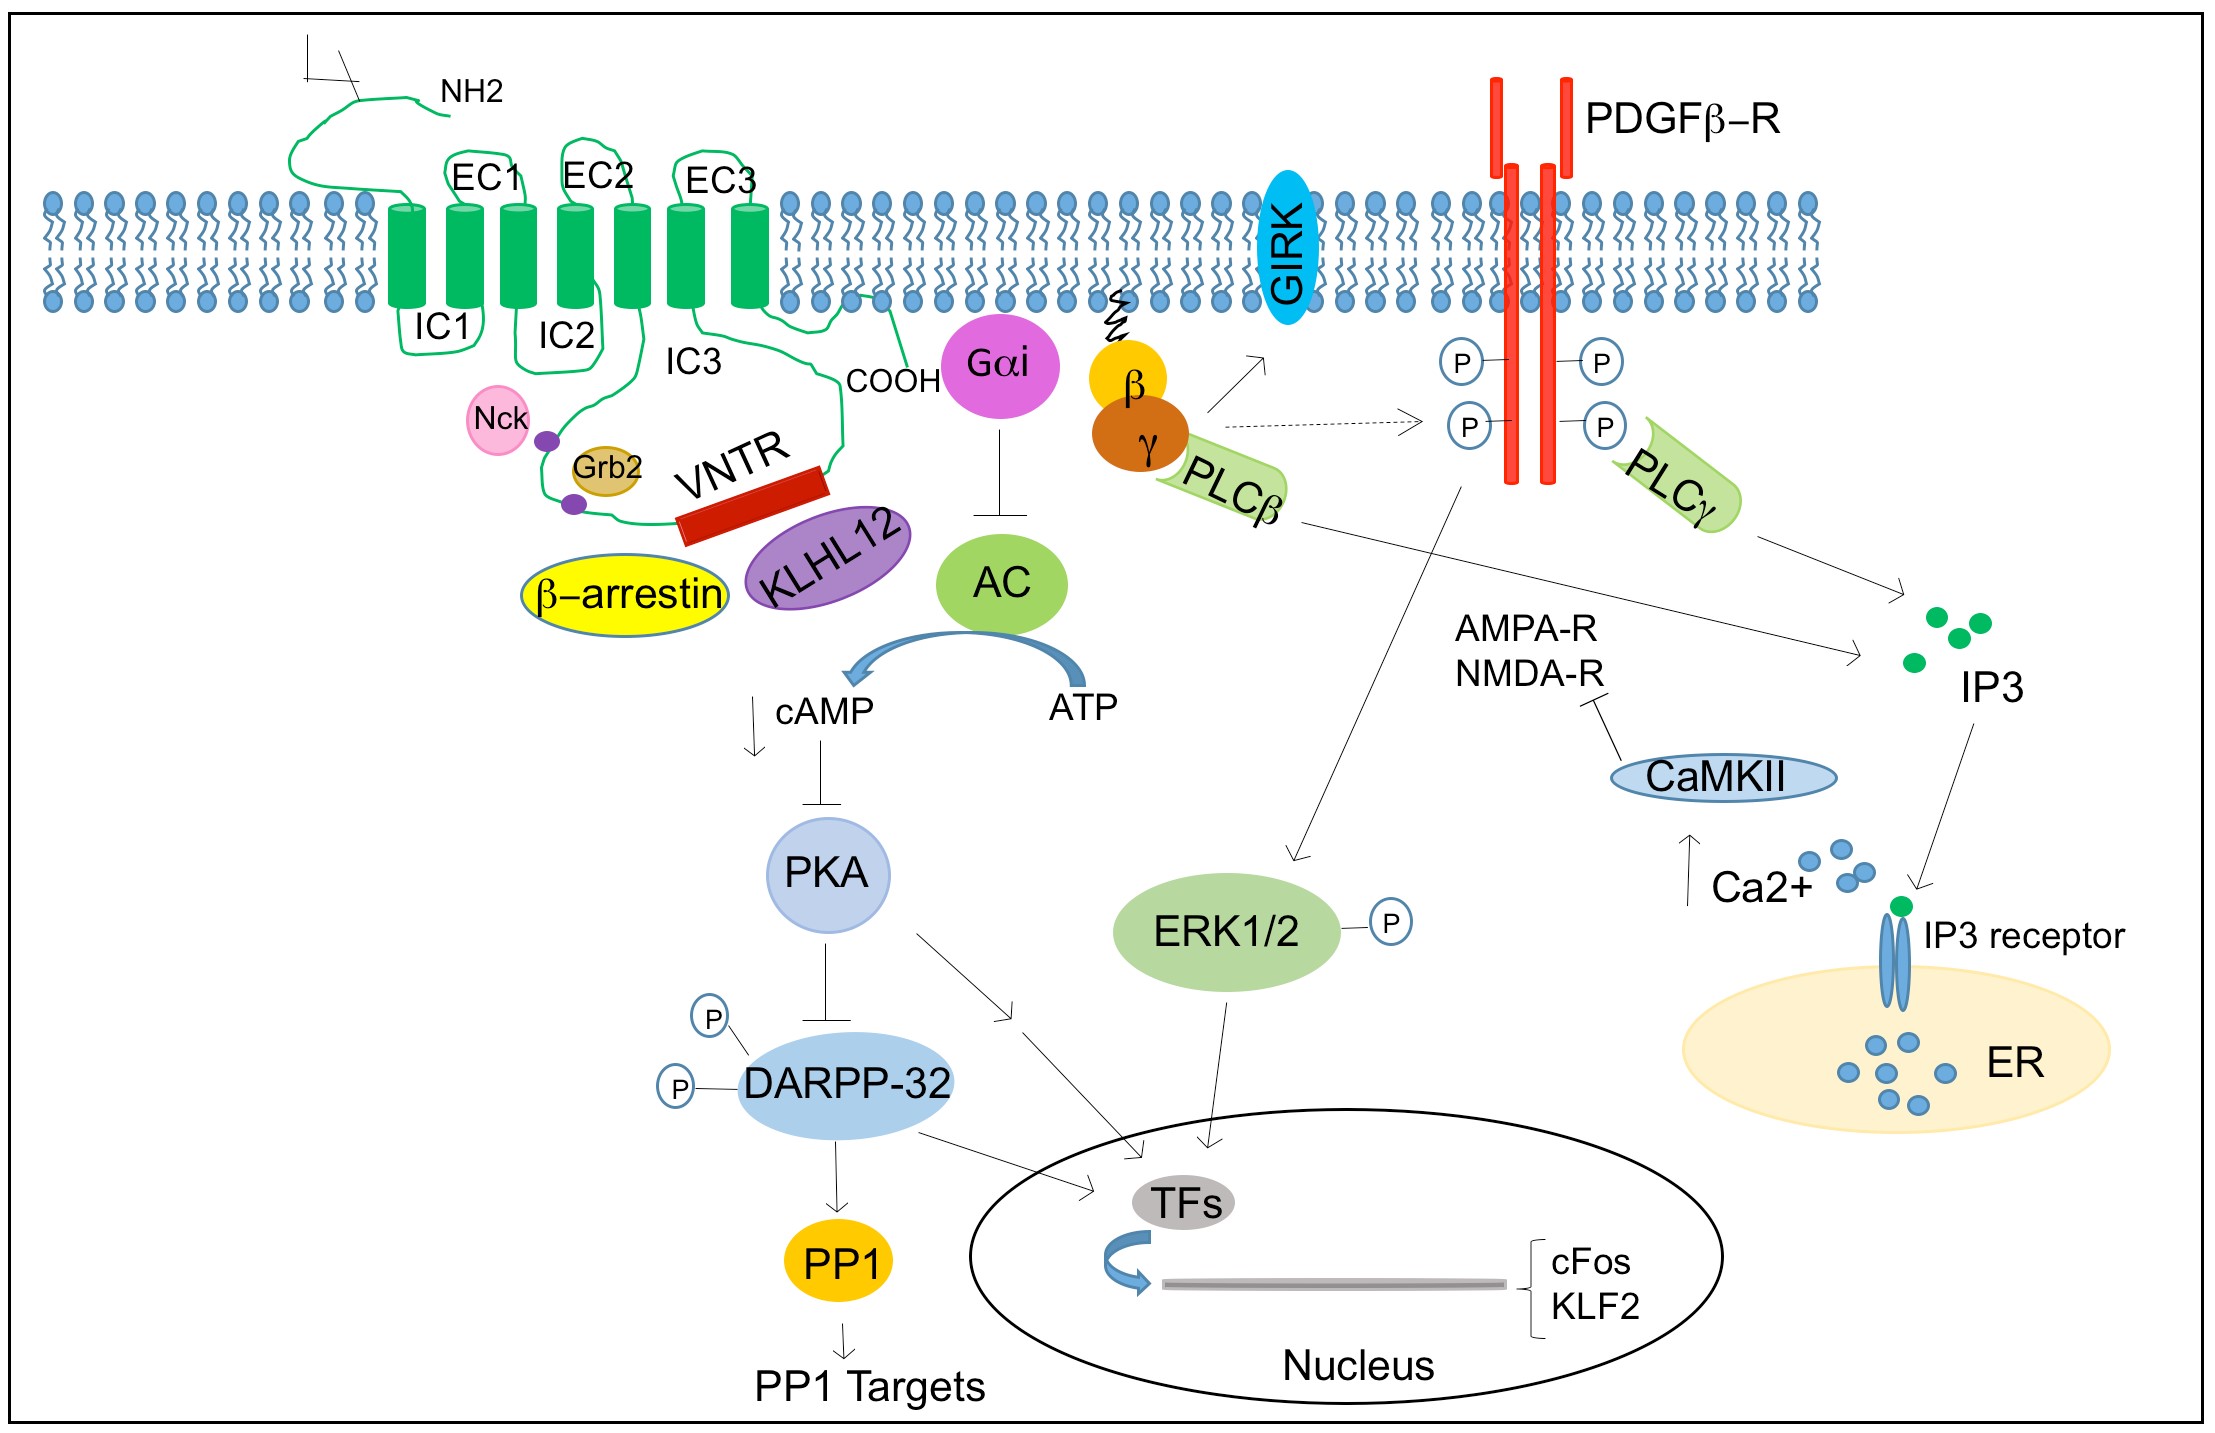
Figure 1.5. D4 receptor mediated signaling
1.5.3.2 Regulation of D4 receptor
Receptor functions are generally regulated by variety of systems including agonist induced receptor desensitization and internalization, regulation by gene expression and biosynthesis of the receptor. Similar to GPCRs, the functionality of dopamine receptor is regulated by agonist induced desensitization and internalization of receptor. Studies of D2-like receptors have shown that continuous stimulation with agonists leads to phosphorylation of the D2 receptor, leading to uncoupling of G proteins and subsequent arrestin recruitment and internalization that is dynamin dependent endocytosis (Macey et al., 2004).
However studies on desensitization of D4 receptor are rare and studies on several cell lines indicated that D4 receptor is not strongly regulated through desensitization or internalization mechanism compared to other GPCR such as γ2 adrenergic receptors (Cho et al., 2006; Spooren et al., 2010). The mechanisms regulating DRD4 gene expression are far from being understood. Some studies suggested up regulation of DRD4 in striatum of schizophrenia patients, although other studies showed decreased expression(Helmeste and Tang, 2000; Oak et al., 2000). Furthermore, folding efficiency is demonstrated to be rate limiting in biogenesis of the receptor (Van Craenenbroeck et al., 2011) and antipsychotic drug can function as pharmacological chaperones in upregulating receptor expression by stabilizing it in the ER (Van Craenenbroeck et al., 2006).
1.5.3.3 Expression profile of D4 receptor
Dopamine receptors have broad expression patterns in the brain and in the periphery. All dopamine receptors are present in all targets of dopamine in CNS. D4 receptor is found in various brain regions but is less abundant than D2 receptor and distribution of D4 expression overlaps with D2 receptor expression suggesting a redundancy of these two receptor subtypes. D4 receptor is most abundant in retina (Cohen et al., 1992), cerebral cortex, amygdala, hippocampus, hypothalamus but sparsely in the striatum as assessed by Northern blot and RTPCR (Matsumoto et al., 1995; Valerio et al., 1994), in situ hybridization (Lidow et al., 1998; Meador-Woodruff et al., 1994; Meador-Woodruff et al., 1997) and ligand binding assay (Defagot et al., 2000; Primus et al., 1997) and immunohistochemistry (Mrzljak et al., 1996; Rivera et al., 2002). Interestingly, these studies found D4 receptor in both pyramidal and non-pyramidal cells of the cerebral cortex particular layer V, and in the hippocampus. Outside of CNS, D4 receptor is found in the cardiac atrium, lymphocytes and kidney.
1.5.3.4 Physiological role of D4 receptor in the brain
Dopamine is not a simple excitatory or inhibitory neurotransmitter but a neuromodulator, a mediator of slow synaptic transmission that alters the response of the target neurons to other neurotransmitters thus altering synaptic plasticity. Dopamine through binding to D4 receptor can control the activity of glutamate receptors (NMDA and AMPA), which mediate corticostriatal neurotransmission. Dopamine D4 receptor has been reported to have the unique ability to perform phospholipid methylation that can affects ion channels, important for modulation of neuronal firing activity (Kuznetsova and Deth, 2008), where impairment in methylation contributes to disorders of attentions. The D4 receptor knockout mouse has been generated to study the in vivo role of D4 receptor (Rubinstein et al., 1997). The D4 mutant mouse showed a reduction in locomotion and behavioral response to novelty(Dulawa et al., 1999; Glickstein and Schmauss, 2001). This finding is of great interest because few studies have suggested association between D4 VNTR polymorphism (D4.7) and human personality trait of novelty seeking (Benjamin et al., 1996; Ebstein et al., 1996).
D4 mutant mice also showed enhanced activity of cortical pyramidal neurons, and experiment with pharmacological agents indicated that D4 receptor has inhibitory role in frontal cortex glutamatergic activity (Rubinstein et al., 2001). D4 mutant mouse also showed more sensitivity to the stimulation of locomotor activity induced by ethanol, cocaine and methamphetamine although the mutant mice have hypoactive locomotor phenotype (Rubinstein et al., 1997). In general, the specific physiological roles played by D4, D3 and D5 receptors in the brain are largely unknown.
1.5.3.5 Dopamine D4 receptor related diseases
DRD4 has been widely implicated in neurological and psychiatric disorders such as ADHD, schizophrenia, Tourette’s syndrome and novelty seeking. A great deal of interest was shown towards DRD4 following reports when DRD4 level was found to be six fold higher in post mortem brains of schizophrenia patients compared to control (Seeman et al., 1993) and a high degree of affinity of antipsychotic drug clozapine was observed in DRD4 (>10fold) compared to other D2 like receptor (Van Tol et al., 1991). Dopamine D4 receptor polymorphism is strongly associated with ADHD, where D4.7 variant showed an increased risk of developing ADHD where as D4.4 is protective (Faraone et al., 1999; LaHoste et al., 1996; Li et al., 2006). D4.7 variant is also associated with other neurological complex behaviors such as Tourette’s syndrome (Comings et al., 1999) and personality trait of novelty seeking (Ebstein et al., 1996). A single nucleotide polymorphism in the promoter region of D4 gene C-521T is also reported to be associated with novelty seeking (Ronai et al., 2001). However, there are other studies that failed to confirm the association with novelty seeking (Jonsson et al., 1997). The D4 receptor has been also linked to schizophrenia, a complex neuropsychiatric disorder (Catalano et al., 1993; Lung et al., 2002; Talkowski et al., 2008).
There are other accumulating evidences that suggest association of dysbindin, neuregulin1, dystrobrevin-binding protein1(DNTBP1) as a risk factor for schizophrenia. The observation that D2 receptors are blocked by classical neuroleptic compounds led to the theory that dopamine plays an essential role in the pathogenesis of schizophrenia. However, many studies following possible association between D4 and schizophrenia have not led to a strong links and failed to demonstrate the correlation between D4 polymorphism and clozapine response (Rao et al., 1994; Tanaka et al., 1995). Regardless, a lot of evidence supports the hypothesis that reduction in positive systems following treatment with antipsychotic is mediated through blocking D2 receptors. Although exclusive blockade at the D4 receptor may not be sufficient for antipsychotic action, it might result in an improved symptomatic profile in combination the D2 receptor blockade.
1.6 Hypothesis and specific aims
Neurochemicals are now being appreciated to have an important role in neurogenesis, in the formation of neurons other than its function in synaptic transmission. Given the close similarities between GBM stem cells and neural stem cells, and the emergence and growth of GBMs in the rich neurochemical milieu of the brain, these neurochemical signaling pathways may profoundly impact tumor growth. I hypothesized that interrogation of neurochemical space and its influence in patient derived GBM neural stem cell (GNS) using small molecules would reveal many novel regulatory mechanisms, which could then be exploited for therapeutic applications.
Specific Aim 1: To interrogate neurochemicals’ role in GBM and identify GNS selective compounds. A library of 680 neuroactive compounds was screened against a panel of patient derived GNS cells, human neural stem cells (NS) and fibroblasts to identify GNS selective compounds. Selective compounds were further validated in vitro and in vivo.
Specific Aim 2: To characterize the mechanism of action for the GNS selective compounds and determine the mechanisms that confer the selectivity. The mechanism of action for the GNS selective compound was determined through an unbiased approach using genome wide expression array and a phospho-kinase array. Selective compounds were validated for its target by genetic knockdown experiments.
Specific Aim 3: To investigate if modulation of neurochemical signaling can direct NS cells fate into specific neuronal lineages. A high content screen was developed to capture neurochemicals influence on NS cells differentiation into neurons and astrocytes, and proliferation. Human NS cells were screened with a library containing 680 neuroactive compounds to identify compounds with differentiation potential and further validate and characterize the fate of differentiated cells. Chapter 2 Interrogation of neurochemicals’ role in glioblastoma stem cell growth (I conducted all experiments and data analysis described in this chapter except the in vivo experiment, where I got assistance from Lilian, Kevin, Michelle and Milly with animal handling, and Veronique Voisin and ChangJiang Xu with TCGA data analysis)
2.1 Introduction
Glioblastoma (GBM) is the most common malignant primary brain tumor in adults and has proven resistant to all therapeutic strategies attempted to date. The median survival time for GBM patients is 15 months even with standard care of treatment including surgery, radiation and chemotherapy (Furnari et al., 2007; Stupp et al., 2005). The alkylating agent temozolomide (TMZ) is the only chemotherapeutic of any benefit, and it is effective only transiently in a subset of patients (Brennan et al., 2013; Hegi et al., 2005). Therefore, there is an urgent need for identification of novel targets and better therapeutic approaches for treatment of GBM. A prerequisite to identifying new therapeutics is a better understanding of the diversity of mechanisms that govern GBM growth. GBM growth is initiated and maintained by small subpopulations of tumorigenic cells termed GBM stem cells, which have a phenotype similar to normal neural stem cells (NSCs) (Beier et al., 2007; Galli et al., 2004; Singh et al., 2003; Singh et al., 2004).
GBM stem cells contribute to tumor progression and resistance to therapy (Bao et al., 2006; Chen et al., 2012), such that longterm disease control is likely to require elimination of this driver population, in addition to the more differentiated tumor bulk. These GBM stem cells are best prospectively identified from fresh tumors and interrogated directly in vivo, but tumorigenic cells that show similar properties to directly isolated cells can be grown in a defined media (herein called GBM derived neural stem cells, GNS cells) which then can be used for screening(Pollard et al., 2009). A deeper understanding of the regulatory mechanisms that govern the proliferation and survival of GBM stem cells will be essential to developing rational new therapies.
In a previous screen of an unbiased bioactive small molecule library on mouse NSCs, neurochemical signaling pathways significantly impacted proliferation and survival of normal NSC populations (Diamandis et al., 2007). As tumorigenic GBM cells display many characteristics of NSCs, this observation raised the intriguing possibility that known neuromodulators might also affect tumorigenic GNS cells. Neurochemicals are endogenous chemical messengers that mediate the synaptic function of differentiated neural cells in the mature CNS.
Recent studies suggest an important role of neurochemicals, for example gamma-aminobutyric acid (GABA) and glutamate, in regulating NSC fate both in early development (Andang et al., 2008; Martins and Pearson, 2008; Schlett, 2006) and in adult neurogenesis (Berg et al., 2013; Ge et al., 2006; Hoglinger et al., 2004; Song et al., 2012). GABA regulates adult mouse hippocampal NSCs by maintaining their quiescence through the GABAA receptor (Song et al., 2012), yet can also promote embryonic NSC proliferation (Andang et al., 2008), suggesting context specific functions. These effects may reflect influences of local or more distant neuronal activity on the NSC niche. Consistent with this idea, dopamine afferents project to neurogenic zones and depletion of dopamine decreases the proliferation of progenitor cells in the adult subventricular zone (SVZ) through D2-like receptors (Hoglinger et al., 2004). Dopamine is also present in early neuronal development in the lateral ganglionic eminence (LGE) and modulates LGE progenitor cell proliferation (Ohtani et al., 2003). Serotonin signaling similarly contributes to the SVZ NSC niche (Tong et al., 2014). Neurochemicals and their receptors have also been implicated in the growth and progression of many non-CNS cancers (Dizeyi et al., 2004; Schuller, 2008; Weddle et al., 2001). The mechanisms whereby neurochemicals affect cancer growth is not understood, but given that GBM arises in the rich neurochemical milieu of the mature CNS, it is highly plausible that neurochemical pathways may play a role in promoting GBM growth and tumour progression.
Consistent with this proposition, a very recent study on optogenetic manipulation of cortical neuronal activity in a mouse GBM xenograft model showed a definite influence of neuronal activity on GBM growth (Venkatesh et al., 2015). As well, a very recent study suggests antidepressants may affect survival of lower grade models of GBM (Shchors et al., 2015). The neurochemicals that make up the rich extracellular milieu of the brain that GBM arises from have not been exploited for therapeutic applications. Modulation of neurochemical signaling offers great promise for GBM therapy because large number of agonists and antagonists have been developed against various neurochemical signaling pathway, which are selected to access CNS and overcome blood brain barrier, and many are clinically approved for neurological disorders that may be readily deployed for GBM therapy. In this chapter my aim was to interrogate the role of neurochemicals in regulating the growth of GBM stem cells.
I hypothesized that a systematic survey of known neuroactive compounds against GBM stem cells could reveal novel targets and regulatory mechanisms, outside of traditional chemotherapies. Importantly, the extensive previous development of neurochemical modulators for psychiatric disorders and other CNS-specific diseases would allow the immediate redeployment of approved drugs for oncologic applications. Towards to this end, neurochemical modulators from all different classes were screened against primary in vitro cultures of human GBM-derived NSCs, referred to as GNS cells (Lee et al., 2006; Pollard et al., 2009) and human fetal NSC (NS) and human fibroblast (BJ) to identify selective compounds. Identification of GNS selective compounds will reveal the vulnerability of GBM stem cells that can be exploited for therapeutic purposes.
2.2 Materials and Methods
Cell culture and primary tumor cells
GNS and NS lines were grown as adherent monolayer culture on Primaria tissue culture dish coated with poly-L-ornithine (PLO) and laminin, in a serum free medium supplemented with epidermal growth factor (EGF) and basal fibroblast growth factor (FGF) as described previously (Pollard et al., 2009). Neurocult media (Stem Cells Technologies) was supplemented with 10ng/µl EGF, 10ng/µl FGF, N2 and B27. Cells were passaged by enzymatic digestion using Accutase. Primary patient samples were obtained with approval from research ethics committees and appropriate patient consent. Tumor cells were freshly dissociated from patient sample in artificial cerebrospinal fluid followed by treatment with enzyme cocktail (1.33mg/ml trypsin, 0.67mg/ml hyaluronidase and 0.1 mg/ml kynurenic acid) at 37oC(Singh et al., 2003; Singh et al., 2004). BJ fibroblast, Daoy and C8-D1A and U-2 OS (ATCC) were maintained in DMEM with 10% FBS.
Compound Library
The neurotransmitter library was purchased from BIOMOL international (now integrated into Enzo life sciences). The library contains 680 compounds covering thirteen classes of neurotransmitters; adrenergics, cholinergics, dopaminergics, serotonergics, ionotropic glutamatergics, metabotrophic glutamatergics, GABAergics, purinergics and adenosine, histaminergics and melatonin ligands, opioids and sigma ligands. The compounds were supplied in DMSO at 10mM concentration in 96-well medium deep plates and stored at -80oC. All compounds for retesting were purchased from Tocris Bioscience.
Chemical screen
Cells were seeded in laminin and poly-L-ornithine (PLO) coated 384-well black clear bottom plates at a density of 2000 cells per well. Compounds were added at a concentration of 5 µM using Biomek FXP automation workstation and incubated with cells for five days at 37oC. Cell viability was assessed by measuring Alamar Blue incorporation according to the manufacturer’s protocol (Invitrogen). Percent growth inhibition was calculated relative to the control DMSO wells.
Secondary screen/dose response curve
The potency and selectivity of hits from primary screen was tested in 8-point two- fold dilution series ranging from 50 µM-0.39 µM concentrations with more lines of GNS, NS and fibroblast. Experimental conditions were same as in primary screen. IC50 was calculated based on an approximate observed value. Fold selectivity was calculated as IC50 of BJ/IC50 of any GNS cells with lowest IC50.
Combination/synergy screen
2000 GNS cells were seeded in 96 well plate and treated with combination of 6-point 2-fold dose series of either L-741,742 (6.25 µM-0.39 µM) or PNU 96415E (25 µM-1.56 µM) with 10-point 2-fold dose series of temozolomide (100 µM-0.39 µM) in 60-point combination doses. Cells were incubated with combination of two drugs for five days and checked for cell viability by Alamar blue assay. Combination index (CI) plot and CI value was calculated for 5-point dose series in each combination using program COMPUSYN. Data points taken for COMPUSYN analysis are temozolomide (100, 50, 25, 12.5 and 6.25 µM) in combination with either L-741,742 (6.25, 3.12, 1.56, 0.78 and 0.39 µM) or PNU 96415E (25, 12.5, 6.25,3.12 and 1.56 µM).
Patient derived xenograft
All mouse procedures were approved by the Hospital for Sick Children’s Animal Care Committee. For subcutaneous xenograft, 2x10⁵ GNS cells in 200 µl of PBS and matrigel (1:1) were injected subcutaneously into flanks of non-obese diabetic/severe combined immunodeficient (NOD/SCID) female mice. 8 mice (2 tumors per mouse except for one mouse in control group that has one tumor) were maintained for each group; control (15 tumors), L741,742(16 tumors) and PNU 96415E (16 tumors). L-741,742 and PNU 96415E were dissolved in 40% 2 hydroxy β-cyclodextrin (Sigma). Mice were treated three days after tumor implantation. Both L-741,742 and PNU 96415E were treated at 20mg/kg i.p for 5days on two days off until end point. Control group was injected with 40% 2 hydroxy β-cyclodextrin. Tumor growth was monitored with microcalipers until tumor volume reached 17mm in any one tumor from any group and all mice were sacrificed at the same end point. Dissected tumor volume was measured and mass was determined by weighing. For intracranial xenografts, 5x10³ GNS cells were injected in the forebrain of NSG mice. Mice were treated one week after tumor implantation with L-741,742 (25mg/kg) five days on two days off for two weeks. TMZ (25 or 12.5 mg/kg) was treated for the first week through gavage. Mice were sacrificed when presented with dome head and neurological symptoms. For the combination experiment, data from two experiments were pooled and performed statistical analysis using Prism.
In vitro Limiting dilution assay (LDA)
Limiting dilution assay was performed as described previously(Tropepe et al., 1999). Primary tumors were dissociated into single cell suspension and seeded in 96 well plate with 10 point-2 fold serial dilution starting from 2000cells -4 cells/ well, 6 wells for each dilution per plate. Each well was score for neurosphere formation after 14 days of incubation. Percent of wells not containing spheres for each cell density was calculated and plotted against the cells per well and regression lines were plotted and x-intercept value at 0.37 was calculated at 95% confidence interval using Sigma Plot, which gives the number of cells required to form at least one neurosphere.
Short hairpin construct and transfection
5 µg of short hairpin targeting DRD4 (RHS4533-EG1815; TRCN0000014453; Thermo Scientific) or control shRNA construct targeting eGFP (RHS4459;Thermo Scientific), and another set of short hairpin against DRD4 from Origene (TL313054A&B) or control non effective scramble shRNA (TR30021) were transfected in 1X10⁶ GNS cells using the Amaxa Nucleofector kit (VPG-1004) and Nucleofector II electroporator (Amaxa Biosystem) according to manufacturer’s protocol. After 24h transfection, cells were briefly selected with puromycin for 48h and then seeded for proliferation assay without selection. I maintained two wells from each transfection after electroporation; one well was lysed to check for knockdown by western blot and the other well seeded for a proliferation assay.
Western blots
Cells were lysed in a denaturing lysis buffer with protease and phosphatase inhibitor as described previously. Protein fragments were separated on sodium-dodecyl-sulfate (SDS) polyacrylamide gel by electrophoresis and transferred onto polyvinylidene fluoride (PVDF) membrane. PVDF membranes were blocked with 5%milk or bovine serum albumin (BSA) for one hour followed by incubation with primary antibody overnight at 4oC and secondary antibody for one hour at room temperature. Secondary antibodies were conjugated to horseradish peroxidase and detected with chemiluminescence. Western blots were performed using following antibodies; anti-DRD4 antibody at 1:750 (Millipore# MABN125), anti-β-actin at 1:10,000 (Sigma), anti-active caspase3 at 1:200 (Abcam#ab2302).
Immunohistochemistry
Primary patient tumor samples or mouse GBM xenograft tumors tissues were fixed overnight in 4%PFA, paraffin embedded and serial sectioned. Sections were deparaffinized and rehydrated through an alcohol gradient to water for antigen retrieval in 10mM citrate buffer pH 6.0 in a microwave pressure cooker. Endogenous peroxide activity was blocked with 3%(v/v) peroxide in methanol for 15 min at room temperature and nonspecific binding was blocked with 2% (v/v) normal goat or horse serum (vectorlabs) in PBS with 2% (w/v) BSA for 30 min. Primary antibodies; anti-DRD4 at 1:750 (Millipore# MABN125), anti-LC3B at 1:1500 (Cell Signaling #3868), anti-p62 at 1:1000 (BD Bioscience) and anti-mono and polyubiquitinylated protein conjugates (FK2) at 1:1000 (Enzo Life Sciences) was incubated overnight @ 4°C. Appropriate secondary antibody; biotinylated, avidin-linked peroxidase), DAB (Vectastain Universal Elite ABC kit, Vectorlabs) and Alexa-568 were used to detect binding of the primary antibody. Normal rabbit serum was used for control sections.
cAMP assay
GNS cells (G362) was seeded at a density of 5000 cells/well in 96-well plate and incubated overnight. Cells were either untreated (DMSO) or pretreated with 30µM of A412997 for 30 minutes and added 30µM of forskolin, and incubated for 20 minutes. Cells were lysed and followed as per protocol Cyclic AMP XPTM Assay kit (Cell Signaling #4339).
2.3 Results
2.3.1 Identification of GNSUselective compounds
To identify compounds that selectively inhibit the growth of GNS, I established proliferation assays for three different cell types: GNS cells, human NS and the BJ human fibroblast cell line. GNS cells are patient-derived tumor cells which display many characteristics of normal NS cells including expression of the markers Nestin and SOX2, and the ability to self-renew and to partially differentiate (Pollard et al., 2009). Thus NS cells serve as a well-matched control for their neoplastic GNS counterparts. To eliminate compounds with non-specific cytotoxic effects, I defined NS-selective hits as those that target both NS and GNS cells, but not fibroblasts. I then filtered for compounds that showed more activity towards GNS cells compared to NS cells, and termed these as GNS-selective compounds.
1. A library of 680 neuroactive compounds was screened against three GNS lines, two NS lines and the BJ fibroblast line at a concentration of 5µM for five days. Primary hits were defined as compounds that caused greater than 20% growth inhibition compared to the DMSO control. The total hit rate in all cell populations ranged from 2.6-6.5% (Figure 2.1A). Of all the neurochemical classes, compounds known to modulate dopaminergic (27%), cholinergic (17%), adrenergic (18%) and serotonergic (9%) pathways were enriched in the total hits, suggesting that these pathways may play a specific role in regulating NS cell growth (Figure 2.1B). These pathways were also the main enriched hits when normalized to each neurochemical class, defined as the number of hits per number of compounds in each class (Figure 2.1C). Additionally, sigma receptors showed high activity in my screen and interestingly sigma receptor genes showed the highest expression compared to other neurochemical receptors (Figure 2.1C and Figure 2.2).
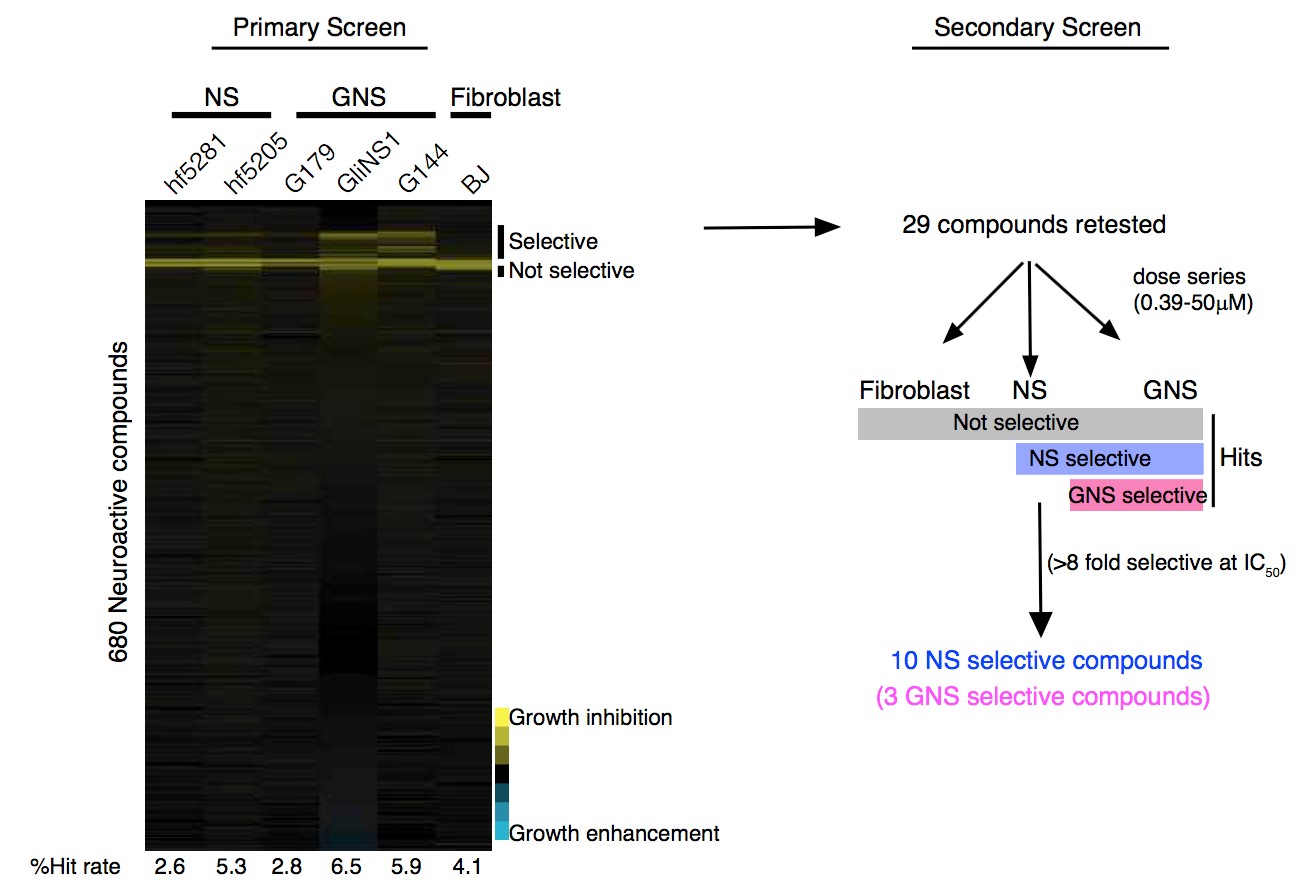
2. C
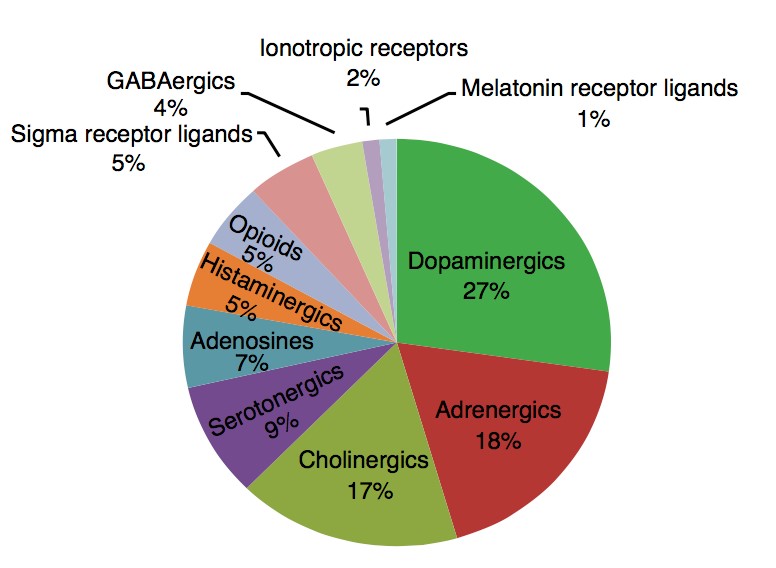
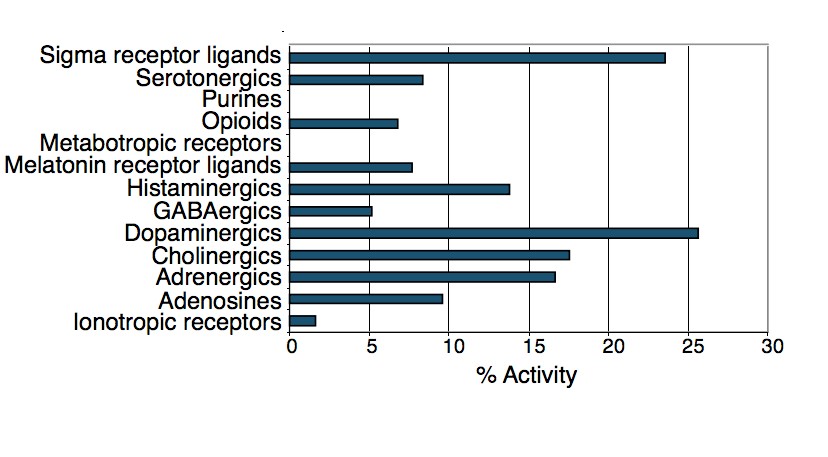
Figure 2.1. Identification of GNS-selective compounds
A. An outline of the primary and secondary screens. Primary screen data is presented in a heatmap showing growth inhibition of each compound (5µM) across the six cell lines screened. Secondary screens were done in dose series to determine the fold selectivity (IC50 of BJ/IC50 of any NS or GNS cells with the lowest IC50). B. Percentage of different neurochemical classes enriched in the total hits. C. Percent activity (hits) of each neurochemical class. Number of hits/total number of compounds present in the library of each class.
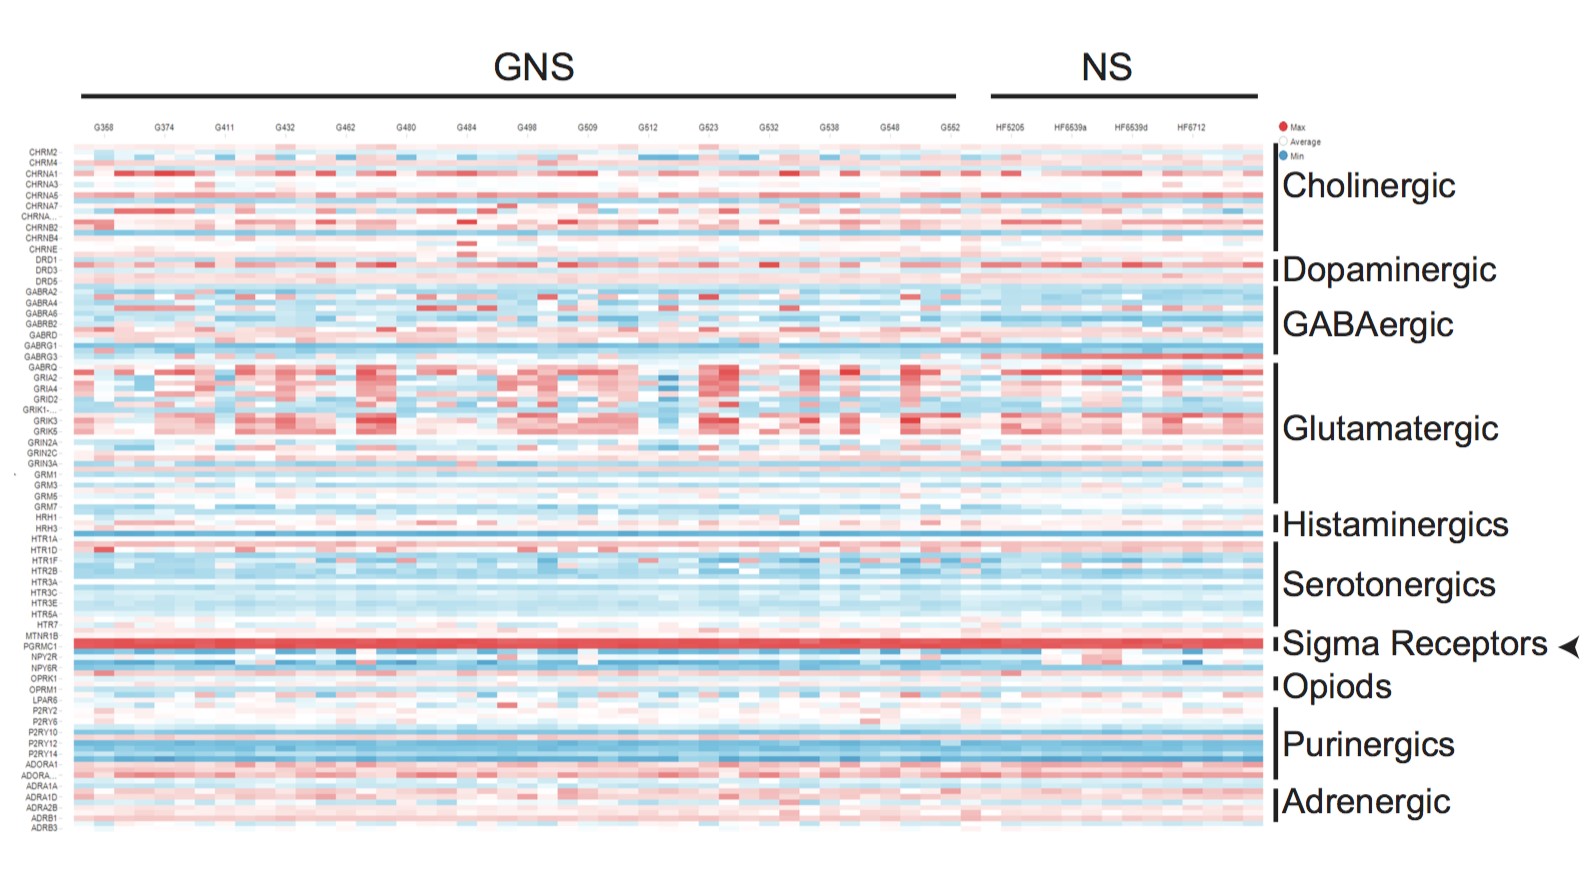
Figure 2.2. Gene expression pattern of different neurochemical receptors across various GNS and NS cell lines
A heat map of neurochemical receptor genes for 13 different classes across panel of GNS and NS cells. Gene expressions of sigma receptors are highlighted with an arrow. From the primary screen hits, 29 compounds were chosen that showed a selective effect on GNS and NS cells compared to fibroblasts and were retested in a dose response series (0.39-50µM) in the same cell populations as in the primary screen (Table 2.1). From this secondary screen, ten compounds were selected that showed more than 8-fold selectivity towards GNS and NS cells compared to fibroblasts. These ten NS-selective compounds were PNU-96415E, L-741,742, Ifenprodil tartrate, LY-165,163, MDL-72222, Tropanyl 3,5-dimethylbenzoate, N,N-Diethyl-2(4-(phenylmethyl)phenoxy) ethanamine, (±)-Tropanyl-2-(4-chlorophenoxy)butanoate, MG-624 and Ivermectin (Table S2.1, Figure 2.3). The ten NS-selective compounds were enriched for dopaminergic, serotonergic and cholinergic classes (Figure 2.3) suggesting these pathways as potential targets for GBM.
To further validate selectivity, each compound was retested in three further non-NS control cell lines, namely Daoy cells (human medulloblastoma), U-2 OS (human osteosarcoma) and C8-D1A (mouse astrocyte cells). The ten compounds were 8-128 fold more active against NS or GNS cells compared to BJ fibroblasts (Table S2.1). Notably, three of the compounds PNU 96415E, L-741,742 and ifenprodil tartrate, showed 8-fold selectivity against GNS cells compared to NS cells (Table S2.1) and were termed GNS-selective compounds. Two of these compounds, PNU 96145E and L-741,742, represent DRD4 antagonists and were chosen for further investigation.
Table 2.1: List of 29 hits retested from the primary screen to identify NS selective compound compared to fibroblast
| DRUG NAME | Fold Selectivitya | Class | Activity |
| 5-Iodotubercidin | 6 fold | Adenosine | Adenosine kinase inhibitor |
| Ifenprodil tartrate | 16 fold | Glutamatergic/ Adrenergics | NMDA receptor antagonist/Alpha1 adrenergic antagonist |
| RS 17053 HCl | 4 fold | Adrenergics | Alpha 1A adrenergic |
| antagonist | |||
| (±)-Isoproterenol HCl | Not active | Adrenergics | Beta adrenergic agonist |
| (-)-Cyanopindolol hemifumarate | Not active | Adrenergics | Beta adrenergic antagonist |
| Ivermectin | 16 fold | Cholinergics | Allosteric modulator of alpha 7 nicotinic receptor |
| MG-624 | 64 fold | Cholinergics | Alpha 7 nicotinic antagonist |
| (-)-N-Phenylcarbamoyleseroline | Not active | Cholinergics | Choline acetyltransferase inhibitor |
| (±)-Tropanyl-2-(4chlorophenoxy)butanoate | 32 fold | Cholinergics | Stimulates acetylcholine release |
| R( )-SKF-81297 | 0 | Dopaminergics | D1 dopamine agonist |
| R(-) Propylnorapomorphine HCl | 2 fold | Dopaminergics | D2 dopamine agonist |
| L-741,742 HCl | >8 fold | Dopaminergics | Dopamine D4 antagonist |
| Fluphenazine 2HCl | 4 fold | Dopaminergics | Dopamine antagonist |
| Thioridazine HCl | 6 fold | Dopaminergics | Dopamine antagonist |
| 3-a-[(4-Chlorophenyl) phenylmethoxy] tropane HCl | 2 fold | Dopaminergics | Dopamine uptake inhibitor |
| GBR-12909 | 4 fold | Dopaminergics | Dopamine uptake inhibitor |
| GBR 13069 2HCl | 4 fold | Dopaminergics | Dopamine uptake inhibitor |
| GBR 12935 2HCl | 4 fold | Dopaminergics | Dopamine uptake inhibitor |
| PNU 96415E | >16 fold | Dopaminergics | Dopamine D4 receptor antagonist |
| Astemizole | 0 | Histaminergics | H1 Histamine antagonist |
| N,N-Diethyl-2-[4- (phenylmethyl)phenoxy]ethana mine | >64 fold | Histaminergics | Histamine antagonist |
| BNTX maleate | 2 fold | Opoids | Delta 1 opioid antagonist |
| LY-165,163 | >16 fold | Serotonergics | Serotonin 5-HT 1A agonist |
| SB 216641 HCl | 2 fold | Serotonergics | Serotonin 5-HT 1B antagonist |
| MDL-72222 | 8 fold | Serotonergics | Serotonin 5-HT 3 antagonist |
| Tropanyl 3,5-dimethylbenzoate | >32 fold | Serotonergics | Serotonin 5-HT 3 antagonist |
| RS 39604 HCl | 2 fold | Serotonergics | Serotonin 5-HT 4 antagonist |
| 1-Methyl-4-[2-(2-naphthyl)ethenyl]-pyridinium iodide | 6 fold | Sigma receptor | Sigma receptor ligand |
| cis-(±)-N-Methyl-N-[2-(3,4dichlorophenyl)ethyl]-2-(1pyrrolidinyl)cyclohexamine 2HBrb | 16 fold | Sigma receptor | Sigma receptor ligand |
1. Fold selectivity= IC50 of BJ/IC50 of NS or GNS with lowest number.
“>” Indicates IC50 not seen even at highest concentration tested (50 µM) in BJ cells thus may be more selective than the number indicated.
2. Not available for further retest
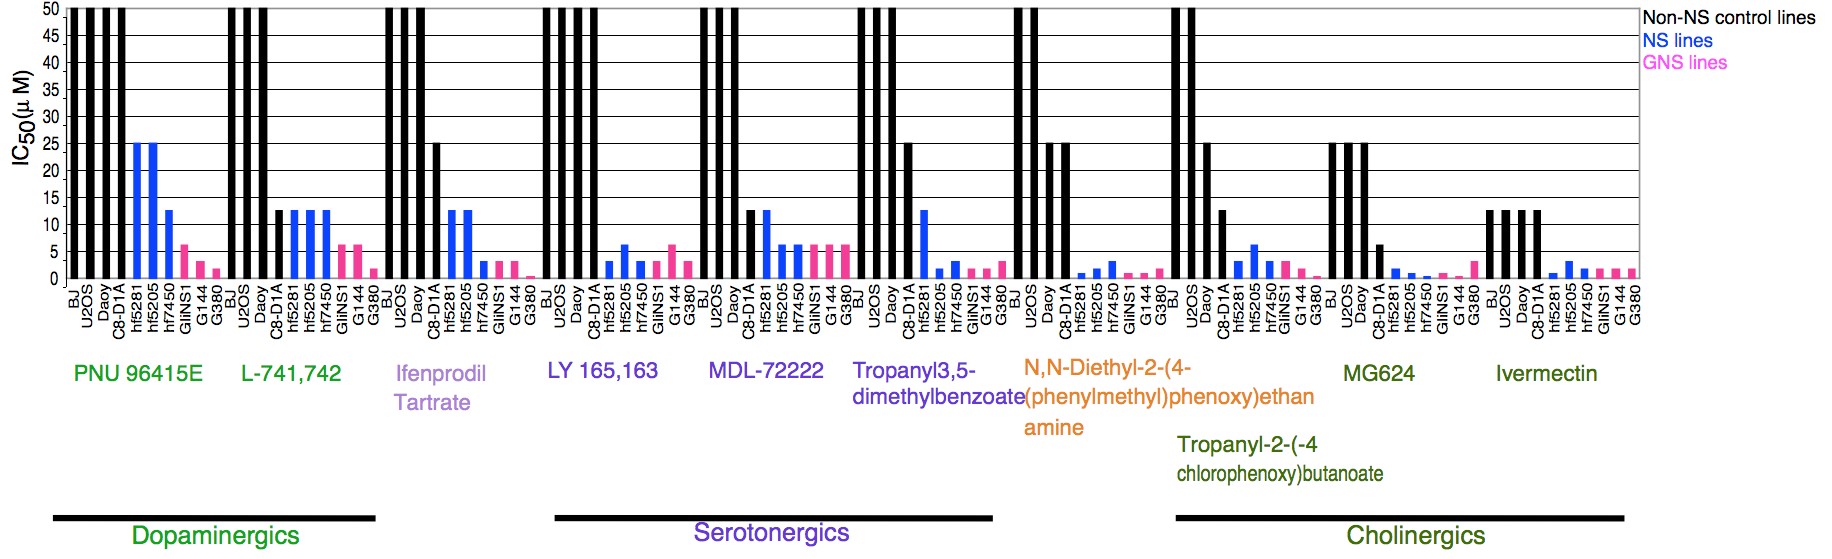
Figure 2.3. The ten NS selective compounds and their IC50 (µM) across different cell lines
The ten NS selective compounds are grouped under their neurochemical classes.
2.3.2 DRD4 antagonists selectively inhibit GNS growth and reduce clonogenic potential of primary GBM tumor cells
I next re-tested PNU 96145E and L-741,742 along with other commercially available DRD4 antagonists (L-745,870 and PD 168568) for their effects on a larger panel of six GNS and four NS lines. All of the DRD4 antagonists showed selectivity toward GNS cells with differing potency (IC50), in the order of L-741,742 (1.5-6.2µM)> L-745,870(3.1-6.2µM) > PNU 96415E(6.25µM) > PD168568 (25-50µM). L-741,742 and PNU 96415E are specific DRD4 antagonists and showed the greatest selectivity towards GNS cells (Figure 2.4). PNU 96415E displayed robust selectivity towards GNS cells compared to NS cells and non-NS control cells, the latter of which were not sensitive even at the highest concentration tested (50µM) (Figure 2.4A). L-741,742 was the most potent GNS inhibitor but showed variable effects on different GNS cells. L-745,870 exhibited selectivity towards GNS but was less potent (Figure 2.4C), while PD 168568 showed modest selective effect at higher concentration (data not shown). A B
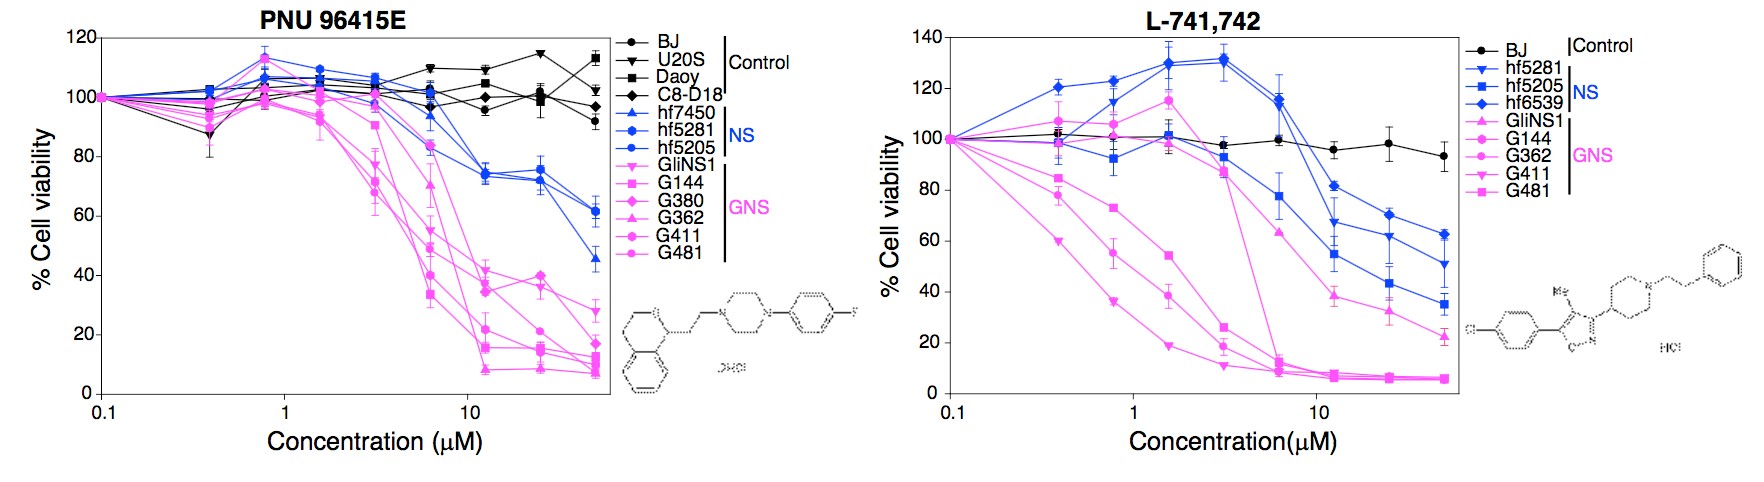
C D
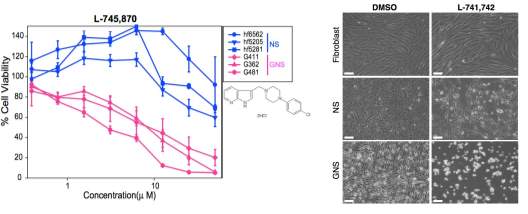
Figure 2.4. DRD4 antagonists are GNS selective
- Percent cell viability of 4 Non-NS control cell lines, 3 NS and 6 GNS lines upon treatment with PNU 96415E in dilution series from 0.39µM-50µM. Controls n= 3 mean ± SEM, NS lines n=5-15 mean± SEM, GNS lines n=3-12 mean± SEM.
- Percent cell viability of BJ fibroblast, 3 NS and 5 GNS lines upon treatment with L-741,742 in dilution series from 0.39µM-50µM. BJ n=3 mean ± SEM, NS lines n=3-11, mean ± SEM, GNS lines n=3-7, mean ± SEM.
- Percent cell viability of 3 NS and 3 GNS lines upon treatment with L-745,870 in dilution series from 0.39 µM-50 µM. NS lines n=3-11 mean ± SEM, GNS lines n=3-11 mean ± SEM.
- Phase contrast image of differential response of GNS (G411) cells and NS (hf5205) cells and fibroblast (BJ) upon L-741,742 (10 µM) treatment after 5 days. Scale bar (100µm)
To confirm that the effect of DRD4 antagonism was not merely specific to GNS cell lines, L741,742 and PNU 96415E were tested in freshly isolated GBM patient tumor cells using a primary in vitro limiting dilution assay (Figure 2.5). Tumor samples were dissociated into a single cell suspension and directly seeded prior to treatment with L-741,742 (10µM), PNU 96415E (25µM) or DMSO control for 14 days before scoring wells for presence/absence of neurosphere colonies. A massive reduction in frequency of colony forming cells after treatment with L-741,742 (40-83 fold reduction) and PNU 96415E (19-29 fold reduction) (Figure 2.5) was observed. These data strongly suggest that both L-741,742 and PNU 96415E inhibit the clonogenic potential of fresh primary tumor cells, and may therefore effectively target the stem cell population in each patient tumor.
A B
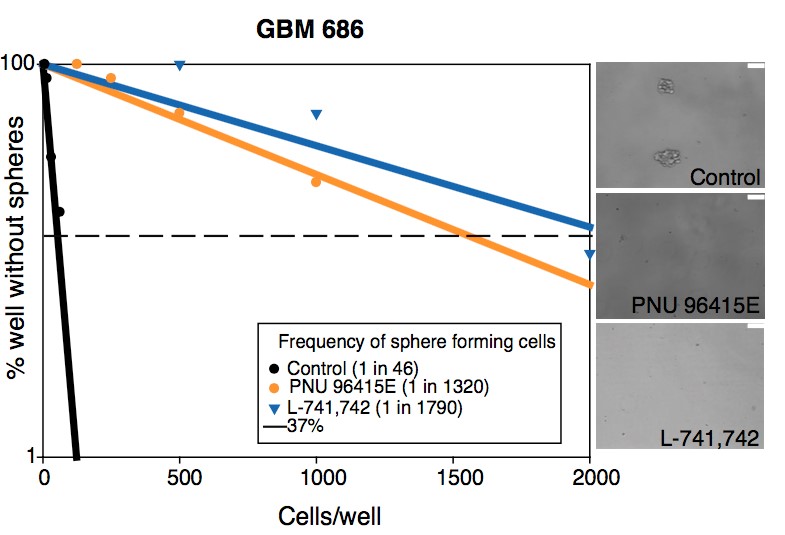
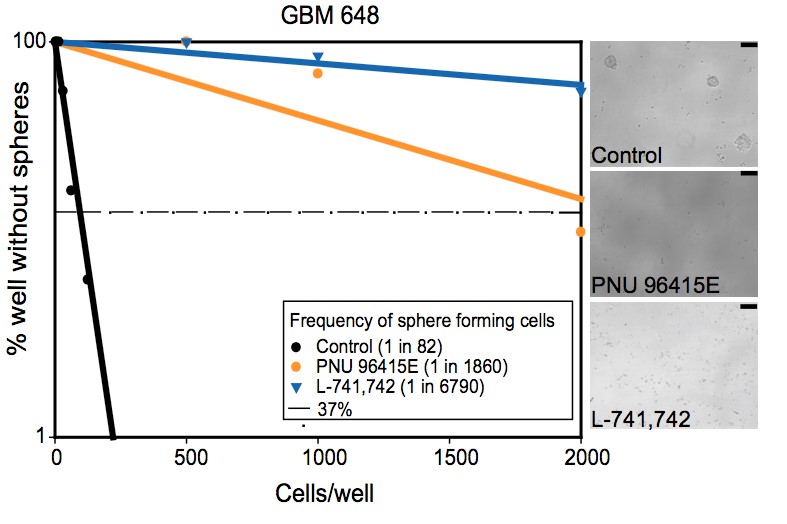
C
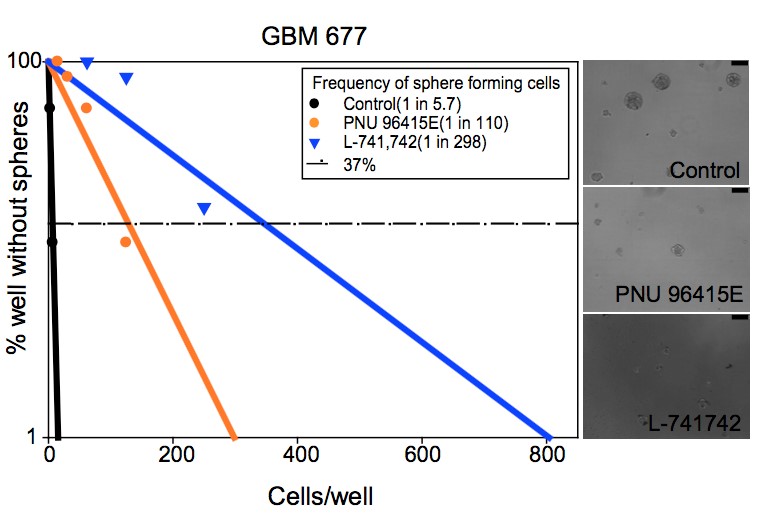
Figure 2.5. DRD4 antagonists reduced the clonogenic potential of primary patient tumor cells
A-C. Linear regression plot of in vitro LDA for freshly dissociated GBM patient tumor (GBM686, GBM648, GBM677) treated with L-741,742 (10µM), PNU 96415E (25 µM) and DMSO. Representative phase contrast image of neurospheres at day 14 in well seeded with 2000 cells. Scale bar (100µm).
2.3.3 DRD4 antagonists are synergistic with TMZ
Next, I evaluated the effect of DRD4 antagonists in conjunction with the commonly used chemotherapeutic agent TMZ to assess the clinical potential of this drug pair combination. Synergy was tested in both G362 and G481 cells using the combination of TMZ with either L741,742 or PNU 96415E. L-741,742 and PNU 9641E exhibited striking synergism with TMZ in vitro GNS cells (Figure 2.6 A-B). The degree of synergism was quantified using the combination index (CI) method (Chou, 2010), for which a CI value of 1 indicates additivity, a value of < 1 indicates synergism and a value > 1 indicates antagonism. The lowest CI value for L-741,742 in combination with TMZ in G481 and G362 was 0.28 and 0.29 respectively, and for PNU 96415E in combination with TMZ was 0.32 and 0.56 respectively (Figure 2.6 C-D). Based on these in vitro data, both DRD4 antagonists might enhance the therapeutic efficacy of TMZ in patients.
A B
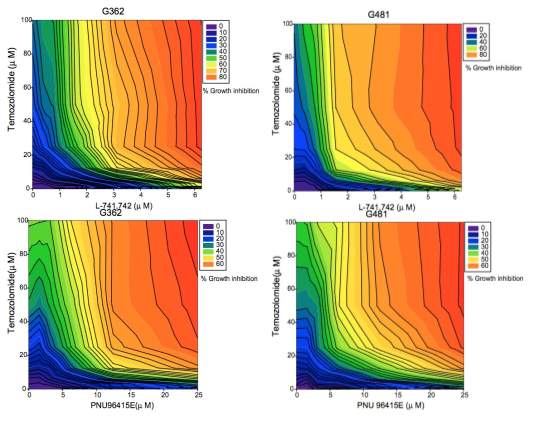
C D
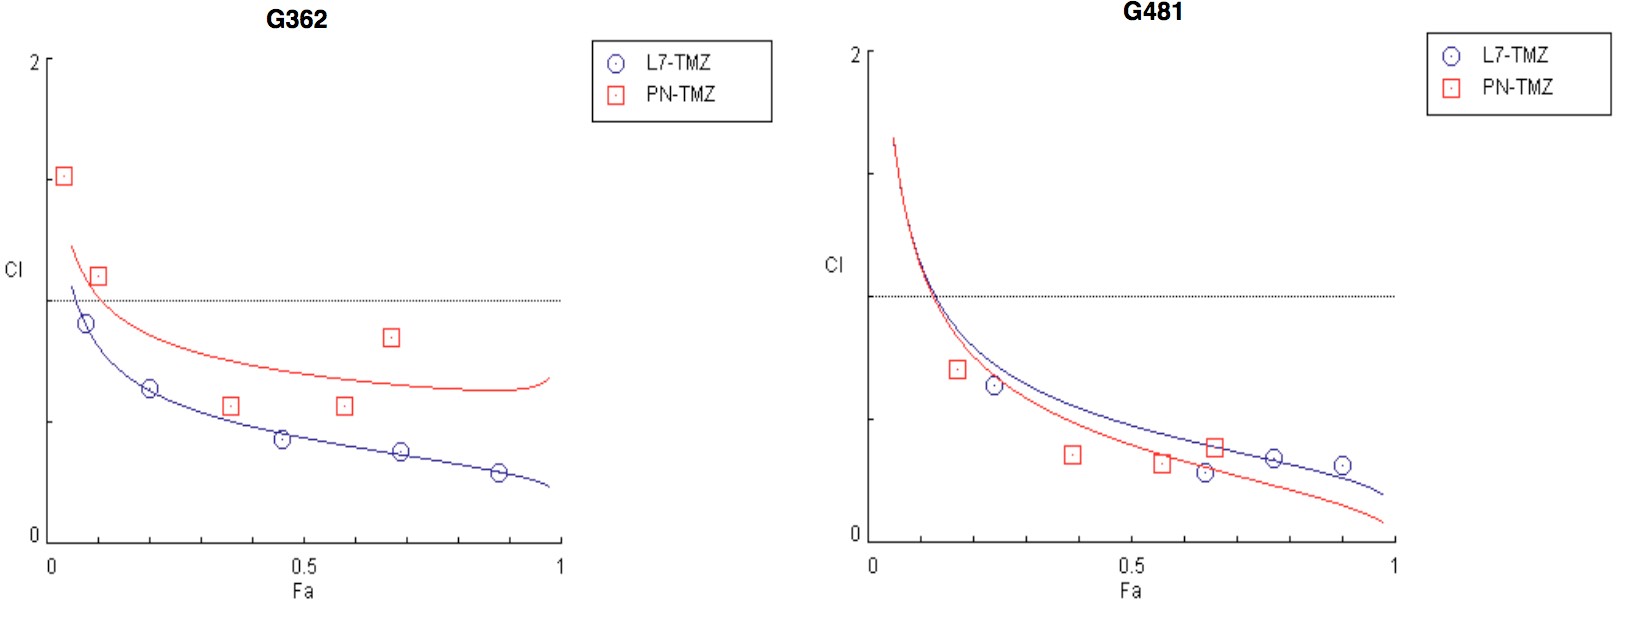
Figure 2.6. DRD4 antagonists are synergistic with temozolomide
A&B. Growth inhibition plot for G362 and G482 cells treated with TMZ in combination with L741742 or PNU 96415E respectively. C&D. Combination index plot for TMZ with L-741742 (L7) or PNU 96415E (PNU) in G362 and G482 cells respectively. Combination index (CI) plotted against fractions affected (Fa) analyzed using software COMPUSYN.
2.3.4 DRD4 antagonists inhibit GBM xenograft growth in'vivo
To validate the effects of L-741,742 and PNU 96415E in vivo, I first validated their effect in a subcutaneous tumor model, where GNS cells were injected into the flanks of immunocompromised NOD scid gamma (NSG) mice and treated with PNU 96415E (20mg/kg), L741,742 (20mg/kg), or vehicle until tumors reached our institutional volumetric cutoff of 17mm in any one mouse (Figure 2.7A). The effect of PNU 96415E and L-741,742 treatments were tested by three different measures. Measurement of tumor volume over time course revealed much slower growth in the treated groups compared to the vehicle control group (Figure 2.7 B). The average tumor weight at the end point was reduced by 44.3% with PNU-96415E treatment and 40.9% with L-741,742 treatment (Figure 2.7C). A
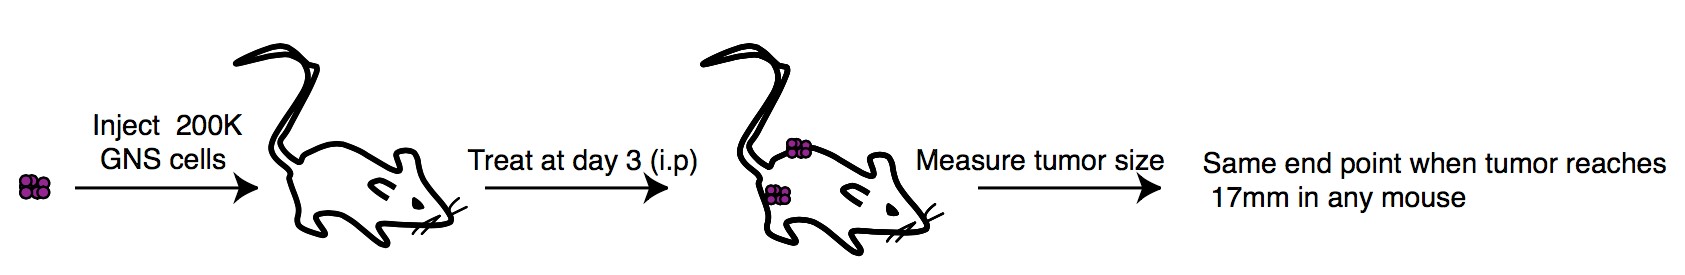
B C
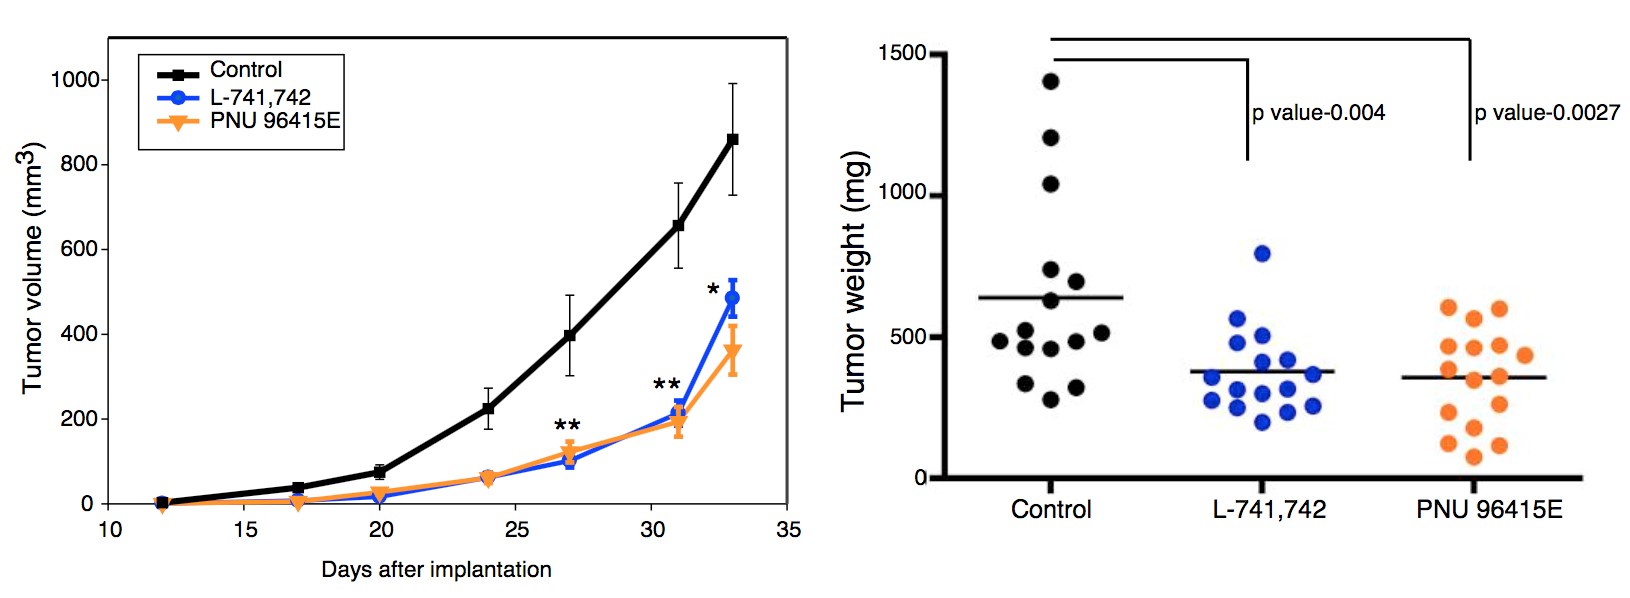
D E
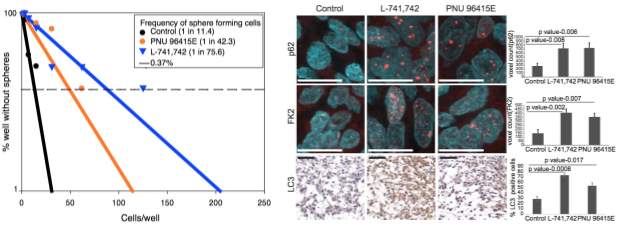
F G
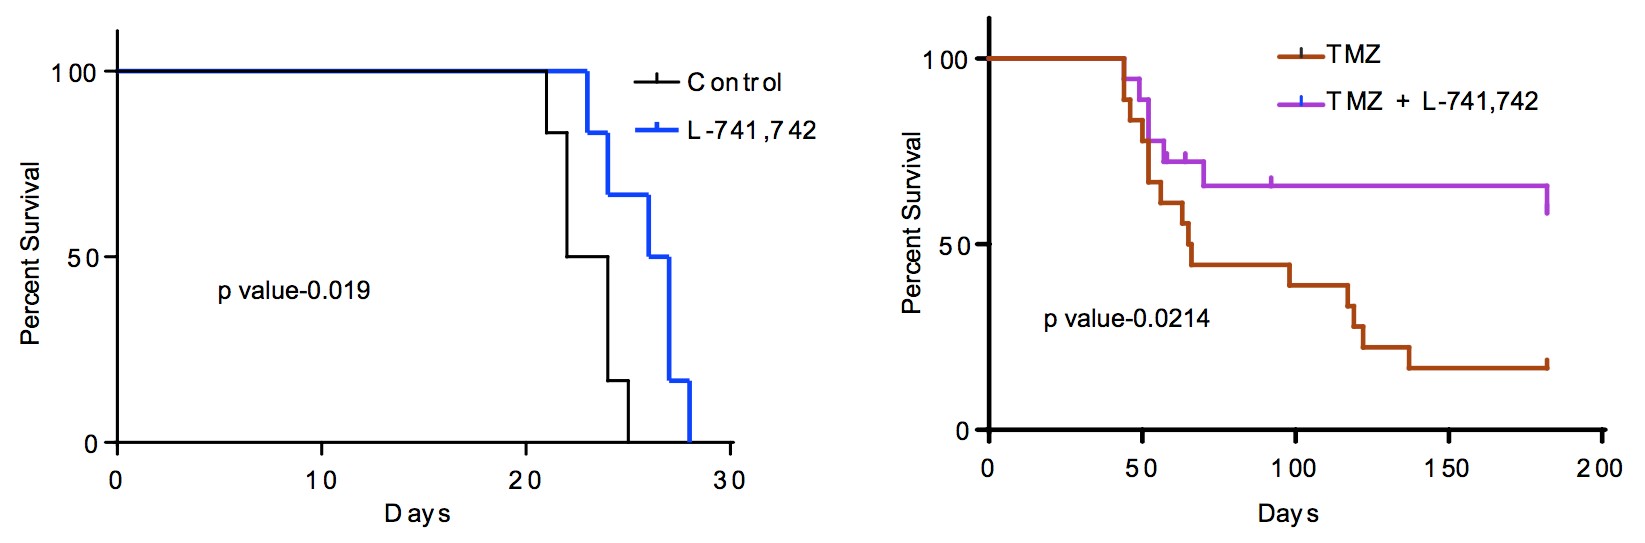
Figure 2.7. DRD4 antagonists inhibit GBM xenograft growth in vivo
A. A schematic of in vivo subcutaneous xenograft model. B. Growth curve of subcutaneous implanted tumor (G362) over period of time, Control n= 15, mean ±SEM, PNU 96415E n=16, mean ±SEM, L-741,742 n=16, mean ±SEM. ** p value <0.005, *p value <0.05 unpaired onetailed t-test. C. A dot plot showing tumor mass of each tumor from the three treatment groups at end point. Control n= 15, mean ±SEM, PNU 96415E n=16, mean ±SEM, L-741,742 n=16, mean ±SEM. Significance analyzed by t-test unpaired one-tailed. D. Linear regression plot of in vitro LDA for an in vivo treated tumors. Average of each group was taken for the plot, neurospheres scored for 18 wells (6 wells from each tumor). E. Immunohistochemistry staining and quantification for anti-p62 and anti-FK2 (ubiquitin conjugate) and LC3 in in vivo treated tumor. Scale bar-p62 and FK2 (11µm) and LC3(50 µm). N=3 sections, mean ±SEM. F. DRD4 antagonists inhibit xenograft tumor growth in vivo. Kaplan-Meier survival curve of intracranial xenograft mice (G362) treated with L-741,742 (25mg/kg). N=6 per group. Significance was performed using log rank (Mantel-Cox) test. G. Kaplan-Meier survival curve of two pooled intracranial xenograft experiment (G362) treated with L-741,742 in combination with TMZ and TMZ alone. Significance was performed using log rank (Mantel-Cox) test. N=18 per group and censorship/endpoint at day 182
Mice censored were sacrificed from other non-brain tumor symptoms. Control and treated tumors were then dissociated and subjected to primary in vitro limiting dilution assays to determine if L-741,742 and PNU-96415E affected the clonogenic capacity of the in vivo treated tumor cells. A substantial reduction in frequency of colony forming cells was observed in both treatment groups compared to controls (Figure 2.7D), suggesting a reduction in the stem cell fraction of treated tumors. The colony forming cell frequency was reduced in treated groups by 4-7 fold, from 1 in every 11 cells in the vehicle treated tumors to 1 in every 43 cells in PNU 96415E treated tumors or 1 in every 76 cells in L-741,742 treated tumors (Figure 2.7D). I further validated the effect of PNU 96415E in vivo using an independent GNS cell line (G411) and observed a similar reduction in tumor growth rate and end-point size (Figure S2.1). Additionally, increased level of both p62, ubiquitinated protein substrate(FK2) and LC3was observed in the treated tumors (Figure 2.7E) confirming the in vivo mechanism.
To better assay the clinical potential of DRD4 antagonists, the effect of L-741,742 was validated in an intracranial xenograft model. Mice were treated one week after tumor implantation when the tumor size is substantial (Figure S2.1-C). The DRD4 antagonist alone had a modest but significant benefit in survival over control (Figure 2.7F). However, when combined with TMZ, data from two in vivo experiments demonstrated that L-741,742 significantly improve survival compared to TMZ alone (Figure 2.7G). Together, these data from two different human patientderived xenograft models provide a strong basis for further exploration of DRD4 antagonism and /or inhibition of autophagic flux as a new avenue for GBM therapy.
2.3.5 Primary GBM tumor and GNS cells express functional DRD4 receptor, with higher expression linked to a worse prognosis
To determine if DRD4 antagonists exert their effects directly through the DRD4 receptor, I first confirmed that DRD4 was expressed in both GNS and NS cells by western blot (Figure 2.8A). I further confirmed that GBM patient tissue samples also expressed DRD4 as shown by both immunohistochemistry and western blots (Figure 2.8B-C, S2.2). DRD4 is therefore expressed on GNS cells but appears to be expressed also on tumor bulk and non-tumorigenic progeny. To assess DRD4 function in GNS cells, I measured a known downstream readout of the receptor activity. DRD4 is a dopamine D2-like receptor that inhibits adenylate cyclase and decreases cAMP levels (Rondou et al., 2010). GNS cells were treated with forskolin to activate adenylate cyclase, and then assessed whether activation of the DRD4 receptor by the DRD4-specific agonist A412997 could block the forskolin-induced cAMP response. Forskolin treatment in GNS cells increased cAMP concentration by 2.1 fold and pretreatment with DRD4 agonist A412997 blocked this response by 31.3%, confirming that DRD4 functions as expected in GNS cells (Figure 2.8D). Primary tumor and tumor-derived GNS cells thus express DRD4 and can respond to DRD4-dependent signals.
A B
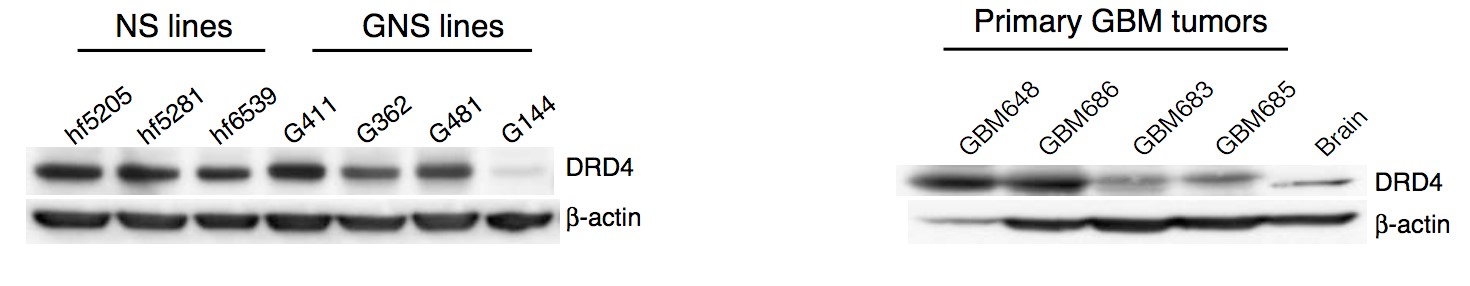
C D
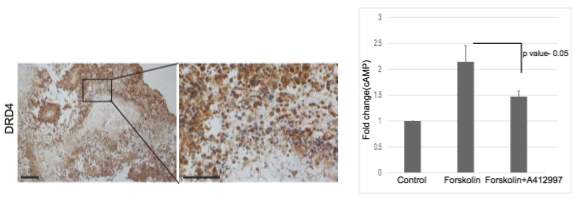
Figure 2.8. Primary GBM and GNS cells express functional DRD4 receptor
A&B. Western blot analysis for anti-DRD4 and anti-β-actin across different NS and GNS lines, and primary GBM patient tumor samples respectively. C. Immunohistochemistry staining for DRD4 in primary patient tumor samples (GBM742). Scale bar (100µm and 50µm) respectively. D. Fold change of cAMP levels in G362 cells treated with forskolin (30 µM) alone and pretreatment with DRD4 specific agonist A412997 (30 µM) followed by forskolin treatment. N=3, mean ±SEM.
In order to probe the clinical relevance of DRD4 expression I probed The Cancer Genome Atlas (TCGA) data on GBM gene expression and found that patients expressing highest DRD4 level have shorter survival than those patients expressing lower DRD4 level (Figure 2.9A-C). A similar pattern was seen with TH (tyrosine hydroxylase) expression (Figure 2.9D), the ratelimiting enzyme for dopamine synthesis. Furthermore, DRD4 was not methylated in GBM samples (Figure 2.9E), suggesting active expression.
A B C
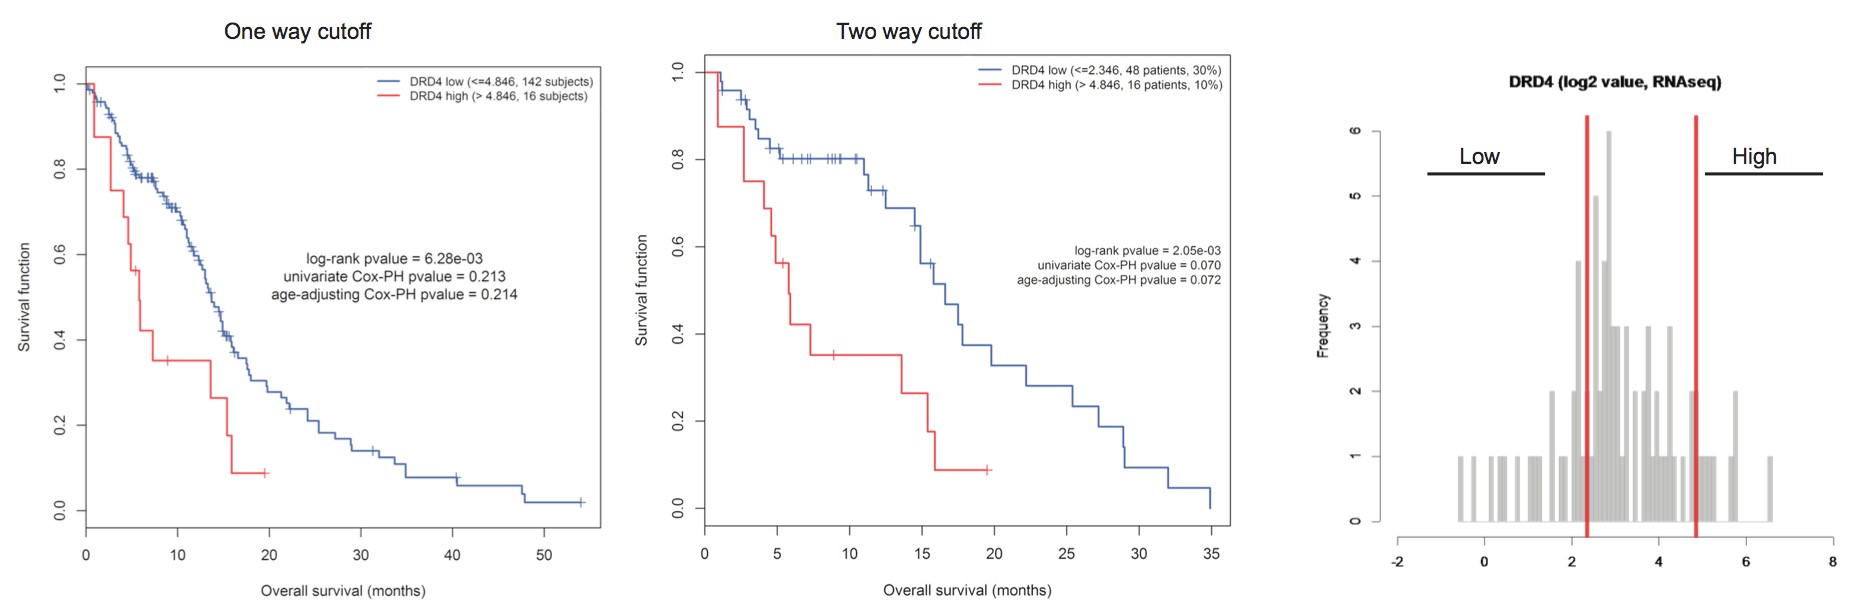
D E
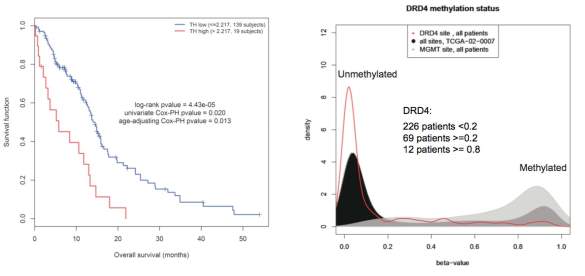
Figure 2.9. The TCGA data on GBM sample show patient with highest DRD4 expression
has worst prognosis, and DRD4 gene is not methylated
A. Kaplan-Meier overall survival (OS) curve of patients with highest DRD4 expression (RNAseq) compared to remaining low DRD4 population using one cut off. B. Kaplan-Meier overall survival (OS) curve of patient with the highest and lowest DRD4 expression (RNAseq) using two cut offs. C. Histogram representing the DRD4 expression distribution across all GBM patient and its cutoff used for OS curve. D. Kaplan-Meier overall survival curve of patient showing highest tyrosine hydroxylase (TH) compared to the remaining low expression population using one cut off. E. Density function of the beta-value of the DRD4 related CpG site across all patients. The 2 gray curves are positive control used to localize the positive methyaltion peak: density function of MGMT related CpG site and density function of all sites for patient TCGA-02-2007
2.3.6 Loss of DRD4 function suppresses GNS growth
To validate DRD4 as a therapeutic target in GBM and determine if loss of its function phenocopies the effect of PNU 96415E and L-741,742, I performed shRNA-mediated knockdown experiments and measured the effect on cell proliferation. I tested five lentiviral shRNA constructs out of which only one shRNA-DRD4 constructs (shRNA-DRD4-4) caused consistent knockdown at 72 hours post transfection (Figure 2.10A). I confirmed reduced DRD4 expression after transduction of the shRNA-DRD4 construct in two separate GNS lines (Figure 2.10B-C). This knockdown was accompanied by a significant reduction in proliferation compared to control shRNA-eGFP transfected cells (Figure 2.10D-E). Moreover, DRD4 knockdown cells are less sensitive to DRD4 antagonists (L-741,742) than control shRNA-eGFP transfected cells validating selectivity of the compounds to DRD4 (Figure 2.10F). Altogether, these results confirm the inferred role for DRD4 function in GNS cell growth.
A
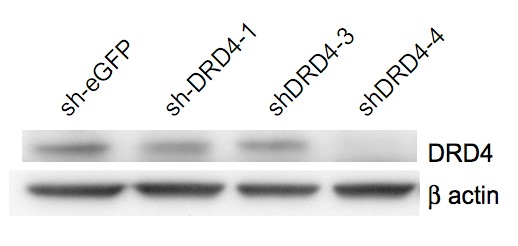
B C
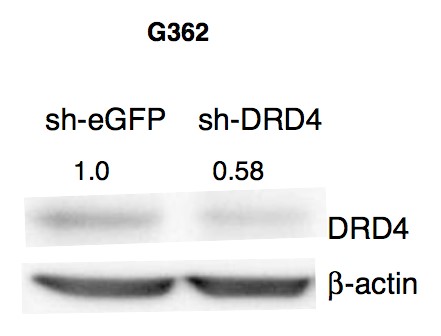
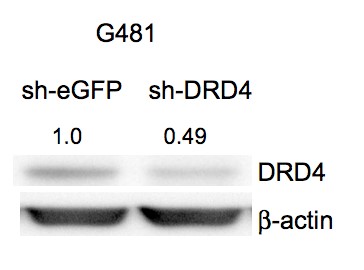
D E
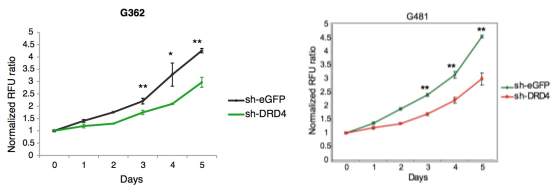
F
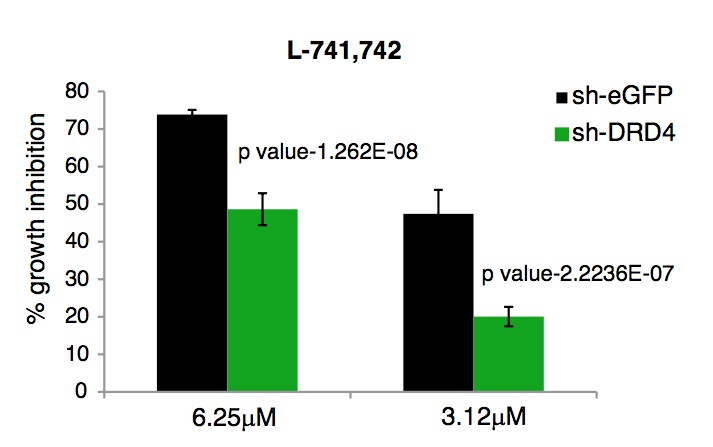
Figure 2.10. Loss of DRD4 function phenocopies DRD4 antagonist’s effects
A. Western blot analysis for anti-DRD4 and β-actin in GNS (G362) cells transiently transfected with various short hairpins against DRD4 post 72h. B&C. Western blot analysis for anti-DRD4 and anti-β-actin in G362 and G482 cells, transiently transfected with shRNA against DRD4 and eGFP at 72h post transfection. D&E. Cell viability assay for G362 and G481 cells transiently transfected with shRNA-DRD4 and shRNA-eGFP measured over 5days. N=3, mean ±SEM. * p<0.005, ** p<0.0005, unpaired one-tailed t-test. F. Percent growth inhibition of G362 cells transiently transfected with shRNA-DRD4 and shRNA-eGFP treated with L741,742 for 3 days. N=3, mean ±STDEV.
2.4 Discussion
Neurochemicals and modification of their receptors influence neural stem cell behavior both during development and adulthood, and they may mediate neuronal activity-related modification of the production of neurons and glia. The fact that the brain contains cell populations capable of extensive proliferative capacity also suggests a link between dysregulation of neurogenesis and the emergence of CNS tumors. Brain tumors contain subpopulations of cells that resemble stem cells functionally, but which show dysregulated self renewal ability and differentiation capacity, and resistance to current therapies. Understanding the stemness behavior of brain tumors is predicted to lead to new strategies to treat these treatment refractory diseases. The parallels between normal neural stem cells and their neoplastic counterparts suggest that modification of neurochemicals may also influence the proliferation and survival of brain tumor stem cells.
In this thesis, I investigated whether neurochemical signaling activity influences the growth and survival of human GNS cells. This study represents the first systematic and unbiased interrogation of all neurochemical classes on human GNS cell growth. Of the 13 neurochemical classes, compounds modulating dopaminergic, serotonergic and cholinergic pathways predominantly affected GNS cells. Each of these neurochemical classes have been previously implicated in regulating NS cells during brain development and adult neurogenesis (Diaz et al., 1997; Hoglinger et al., 2004; Mohapel et al., 2005; Tong et al., 2014; Whitaker-Azmitia, 1991).
Importantly, compound modulating sigma receptors have high activity in the screen and have relatively the highest gene expression level compared to other neurochemical receptors suggesting sigma receptors could potentially influence the GNS growth. I identified ten compounds (PNU-96415E, L-741,742, Ifenprodil tartrate, LY-165,163, MDL-72222, Tropanyl 3,5-dimethylbenzoate, N,N-Diethyl-2-(4-(phenylmethyl)phenoxy)ethanamine, (±)-Tropanyl-2(4-chlorophenoxy) butanoate, MG-624 and Ivermectin) that showed selective effective in NS and GNS cells compared to other non-NS control cells suggesting these ten compounds could have potential therapeutic value and may reveal new therapeutic targets.
In particular, I have demonstrated that the specific DRD4 antagonists L-741,742 and PNU 96415E selectively inhibit the growth of GNS cells and reduce the colony forming potential of freshly dissociated GBM cells suggesting these compound may potentially target the stem cell population of the tumor. Both these compounds inhibited tumor growth in in vivo patient-derived xenograft model and are synergistic with current chemotherapeutic drug, temozolomide.
Importantly, primary patient tumor and patient tumor derived GNS cells expressed functional DRD4 and knockdown of DRD4 phenocopied DRD4 antagonist, suggesting DRD4 could be potential target for GBM. Dopamine is a catecholamine synthesized by neurons predominantly in the midbrain region but have diffuse cortical projections. Dopamine signals are transmitted through five G proteincoupled receptors classified into two groups: the D1 like receptors (D1 and D5) that stimulate adenylate cyclase, and the D2 like receptors (D2, D3 and D4) that inhibit adenylate cyclase. Dopamine signaling is dysregulated in diverse neurological and psychiatric diseases including Parkinson’s, schizophrenia and drug addiction.
In addition to serving a key neurotransmitter function, dopamine has been implicated in regulation of endogenous neurogenesis during brain development (Borta and Hoglinger, 2007; Diaz et al., 1997; Ohtani et al., 2003) and adult neurogenesis in the SVZ by activating D2-like receptors on transit amplifying progenitor cells (Coronas et al., 2004; Hoglinger et al., 2004; Lao et al., 2013). In post-mortem brains of Parkinson’s patients, a disease characterized by depletion of dopamine, a reduction of proliferating cells in the SVZ has been observed (Hoglinger et al., 2004).
These reports suggest an important role for dopamine signaling in the regulation of normal neurogenesis. Little is known about how modification of dopamine signaling can affect brain tumor stem cell behavior. Here, this thesis demonstrates an important role for dopamine-DRD4 signaling in the growth and survival of GNS cells. The primary screen uncovered a number of DRD2 specific antagonists (thioridazine, trifluoperazine) as hits. Consistently, a recent genome wide shRNA screen in a GBM cell line (U87MG) identified a role for DRD2 in GBM growth(Li et al., 2014). However, DRD4 antagonists showed better selectivity for GNS cells in my screen compared to DRD2 antagonists (Figure S2.3). Epigenetic suppression of DRD4 in pediatric CNS tumors has been reported (Unland et al., 2013), however DRD4 is not methylated in TCGA GBM samples and mutations in DRD5 and DRD3 genes occur in a small fraction of GBM samples (Brennan et al., 2013). The TCGA data on GBM gene expression show patients expressing highest DRD4 level have shorter survival than those patients expressing lowest DRD4 level. A similar pattern was seen with TH (tyrosine hydroxylase) expression, the rate-limiting enzyme for dopamine synthesis.
Finally, dopamine receptor antagonists may have activity against other cancer stem cell types, including in leukemia (Sachlos et al., 2012) and lung cancer (Yeh et al., 2012). In conjunction with my findings, these studies suggest that dopamine receptor antagonists will prove to be useful probes for the study of GBM growth and survival, and potentially other cancer types. Finally, this interrogation on the influence of neurochemical space in GBM by small molecule approach revealed dopaminergic, serotonergic, cholinergic and sigma receptor as potential targetable pathways in GBM and in particular, the dopamine D4 receptor.
Supplemental Figures
Table S2.1. IC50(µM) of the ten NS selective compounds across four Non-NS control lines, three NS and three GNS lines and their fold selectivity
 |
 |
 |
 |
 |
 |
 |
 |
 |
 |
Fold Selectivit y (NS selective )a | Fold Selectivit y (GNS selective )b | |
| Ifenprodil tartrate | 50 | 50 | 50 | 25 | 12.5 | 12.5 | 3.12 | 3.12 | 3.12 | 0.39 | 128 | 8 |
| LU 741,742,HCl | >5 0 | 50 | >5 0 | 12.5 | 12.5 | 12.5 | 12.5 | 6.25 | 6.25 | 1.56 | >32 | 8 |
| PNU 96415E | >5 0 | >5 0 | >5 0 | >50 | 25 | 25 | 12.5 | 6.25 | 3.12 | 1.56 | >32 | 8 |
| LYU165,163 | >5 0 | >5 0 | >5 0 | >50 | 3.12 | 6.25 | 3.12 | 3.12 | 6.25 | 3.12 | >16 | |
| MDLU72222 | 50 | 50 | >5 0 | 12.5 | 12.5 | 6.25 | 6.25 | 6.25 | 6.25 | 6.25 | 8 | |
| Tropanyl 3,5 dimethylbenz oate | >5 0 | >5 0 | 50 | 25 | 12.5 | 1.56 | 3.12 | 1.56 | 1.56 | 3.12 | >32 | |
| N,NUDiethylU 2U[4U (phenylmethy l)phenoxy]eth anamine | >5 0 | 50 | 25 | 25 | 0.78 | 1.56 | 3.12 | 0.78 | 0.78 | 1.56 | >64 | |
| (±)UTropanylU 2U(4U chlorophenox y)butanoate | 50 | 50 | 25 | 12.5 | 3.12 | 6.25 | 3.12 | 3.12 | 1.56 | 0.39 | 128 | |
| MGU624 | 25 | 25 | 25 | 6.25 | 1.56 | 0.78 | 0.39 | 0.78 | 0.39 | 3.12 | 64 | |
| Ivermectin | 12. 5 | 12. 5 | 12. 5 | 12.5 | 0.78 | 3.12 | 1.56 | 1.56 | 1.56 | 1.56 | 16 |
a. NS selective= IC50 of BJ/IC50 of NS or GNS with lowest number. b. GNS selective= IC50 of any NS with highest number/IC50 of GNS with lowest number. “>” Indicates IC50 not seen even at highest concentration tested (50 µM) thus may be more selective than the number indicated.
A B
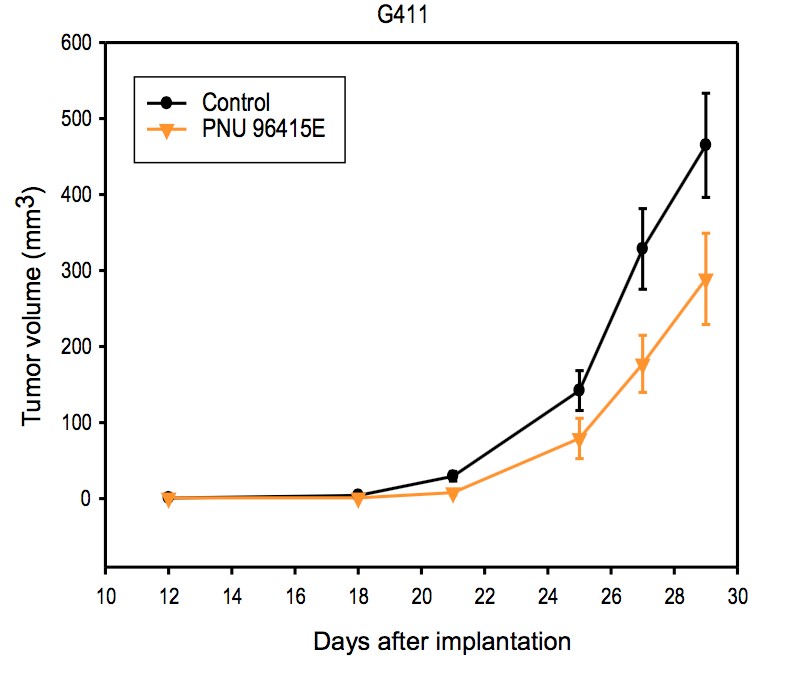
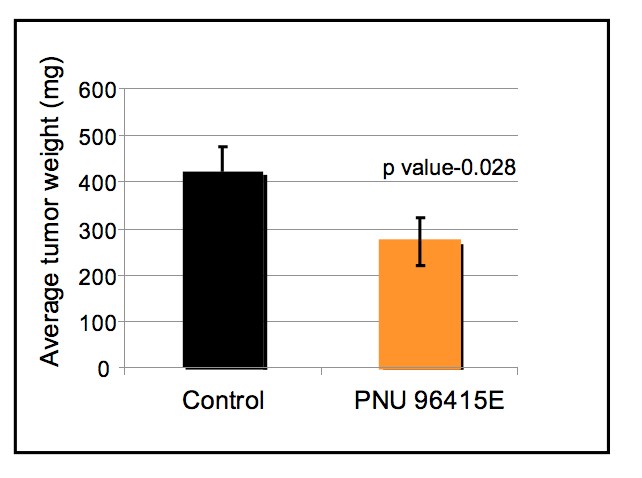
C
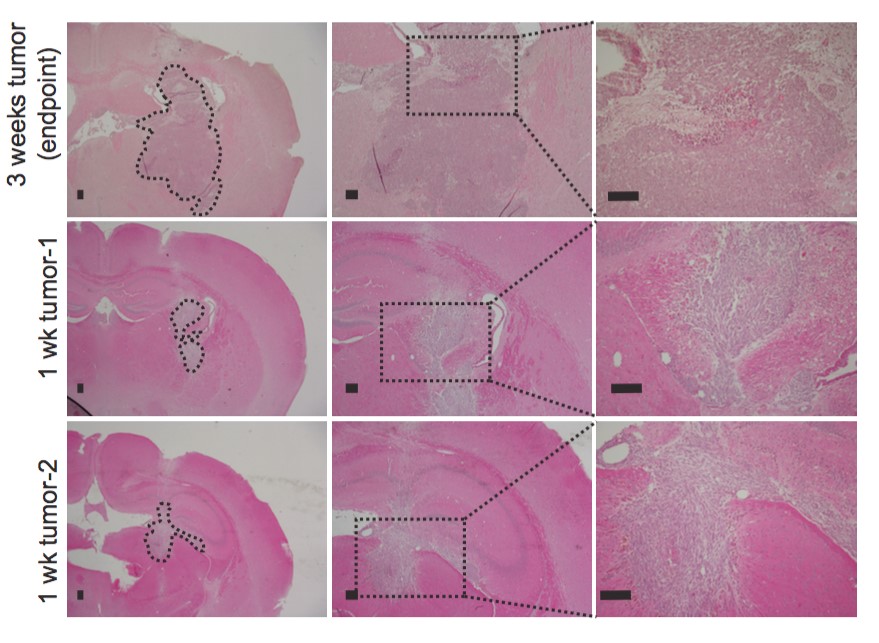
Figure S2.1. DRD4 antagonists inhibits xenograft tumor growth in vivo
A. Growth curve of subcutaneous implanted tumor (G411cells) over period of time, measured from day 12 after implantation until end point when any tumor reached 17mm in size. Control n= 16, mean±SEM and PNU 96415E n=15, mean±SEM. B. Average tumor weight of control and PNU 96415E treated group at the end point. Control n= 16, mean±SEM, PNU 96415E n=15, mean±SEM. C. H&E staining of intracranial tumor (G362) at week 1 tumors (2 samples) compared to week 3 tumor at end point, when the tumor kills mice. Scale bar-100µm.
A
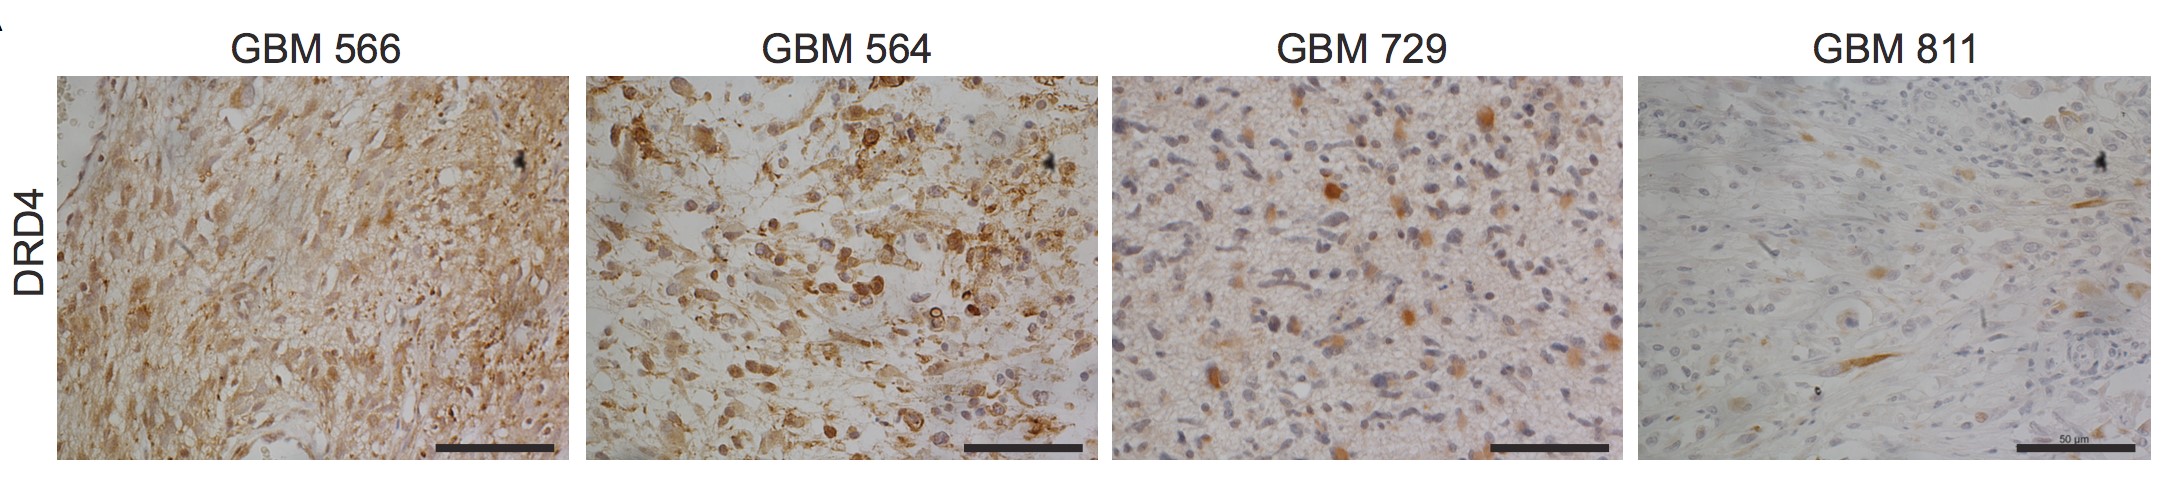
Figure S2.2. Primary GBM patient tumor express DRD4. A.Immunohistochemistry staining of DRD4 in primary patient tumor samples. Scale bar-50µ m.
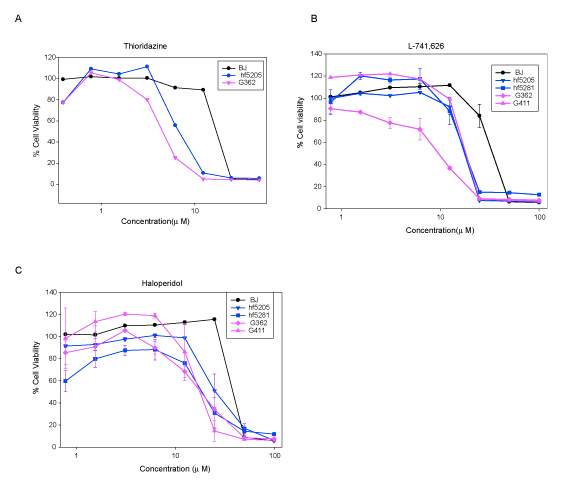
Figure S2.3. DRD2 specific antagonists do not show GNS selectivity
A. Percent cell viability of GNS (G362), NS (hf5205) and fibroblast (BJ) treated with thioridazine (0.39-50 µM) after 5 days incubation. B. Percent cell viability of fibroblast (BJ), NS (hf5205&hf5281) and GNS (G362&G411) on treatment with L-741,626 at various concentration (0.78-100 µM) after 5days of treatment. N=3, mean±SEM C. Percent cell viability of fibroblast (BJ), NS (hf5205&hf5281) and GNS (G362&G411) on treatment with haloperidol at various concentrations (0.78-100 µM) after 5days of treatment. N=3, mean±SEM Chapter 3 Characterization of mechanism of action for DRD4 antagonists in glioblastoma stem cells (I conducted all experiments and data analysis described in this chapter except gene expression data analysis done with the help of Veronique Voisin)
3.1 Introduction
Glioblastoma (GBM) exists as a functional hierarchy containing a subpopulation of cells with a stem cell phenotype that drives the tumor growth and contributes to treatment resistance. So, targeting this subpopulation of cells in addition to bulk tumor is required for a long-term disease. Currently there is no effective treatment other than the alkylating agent TMZ, which is effective transiently in a subset of patient with many side effects and even with that, the median survival remains 15 months. Therefore, a novel therapeutic approaches based on targeting stem cell population of tumor, in combination with TMZ is urgently required. This subpopulation of cells can be modeled from GBM patient tumors in a defined culture system, which share many similar characteristics to normal neural stem cell (NS) expressing SOX2 and Nestin, that we referred to as GBM derived neural stem cells (GNS). In the first chapter, I screened neurochemical library in these patient derived GNS cells and identified ten compounds that selectively killed GNS and NS cells compared to fibroblast that I termed as NS selective compounds.
Interestingly, two (L-741,742 and PNU 96415E) out of ten NS selective compounds are dopamine D4 receptor (DRD4) antagonists and they showed more selectivity towards GNS compared to normal NS cells. Importantly, primary patient tumor samples and tumor derived GNS cells expressed functional DRD4 and loss of DRD4 function inhibits GNS growth. Therefore, understanding the mechanism of DRD4 antagonist activity in GNS cells will reveal the regulatory mechanism that makes GNS cells more susceptible to these compounds. Therefore, I hypothesized that characterizing the mechanism of action of DRD4 antagonists will reveal the vulnerability of GNS cells that we can exploit this for therapeutic application. DRD4 is a highly polymorphic gene consisting of variable number of 48bp tandem repeats (VNTR) in the exon 3 region that codes for intracellular loop 3(IC3) (Lichter et al., 1993; Van Tol et al., 1992).
This repeat can vary from 2 repeats (D4.2) to 11 repeats (D4.11). D4.7 repeat is associated with ADHD, Tourette’s syndrome and novelty seeking. Although there are growing number of genetic association studies of DRD4 variants with many neurological disorders and behaviors, the molecular mechanism of these associations are not known. DRD4 is a D2-like receptor which not only inhibits cAMP production but also activates ERK pathway through transactivation of PDGFR-β, modulates calcium and potassium channels, and decreases functional GABAA receptor levels(Rondou et al., 2010). I therefore, took an unbiased approach to characterize the mechanism of DRD4 antagonism in GNS cells by performing genome wide expression array and phospho-kinase array to further understand this receptors mechanism.
3.2 Materials and methods
Gene expression profiling
GNS cells were treated with PNU 96415E (25 µM) for 0h (Control) 24h and 48h and cells lysed for RNA at each time points using RNeasy kit (Qiagen). RNA extracted from the samples was hybridized on Affymetrix Human Gene 1.0 ST arrays using standard protocol (TCAG, Toronto, Ontario, Canada). RMA background correction, quantile normalization and log2 transformation were applied to the CEL files using the Bioconductor affy package (R 3.0.1, affy package version 1.38.1). Batch correction was applied using ComBat function from sva (3.6.0) and gene annotations were retrieved using hugene10sttranscriptcluster.db (8.0.1).
Genes were ranked based on the average log fold change (log FC) of the 2 treated GNS (G411 and G362) at 24h or 48h to vehicle (0h) samples. The data were analyzed using GSEA (Subramanian et al., 2005) with parameters set to 2000 gene-set permutations and gene-sets size between 8 and 500. The genesets included in the GSEA analyses were obtained from KEGG, MsigDB-c2, NCI, Biocarta, IOB, Netpath, HumanCyc, Reactome and the Gene Ontology (GO) databases, updated October 14_2013 (http://baderlab.org/GeneSets). An enrichment map (version 1.2 of Enrichment Map software (Merico et al., 2010)) was generated for each comparison using enriched gene-sets with a False Discovery Rate < 0.02% and the overlap coefficient set to 0.5.
Western blots
Cells were lysed in a denaturing lysis buffer with protease and phosphatase inhibitor as described previously. Protein fragments were separated on sodium-dodecyl-sulfate (SDS) polyacrylamide gel by electrophoresis and transferred onto polyvinylidene difluoride (PVDF) membrane. PVDF membranes were blocked with 5%milk or bovine serum albumin (BSA) for one hour followed by incubation with primary antibody overnight at 4oC and secondary antibody for one hour at room temperature. Secondary antibodies were conjugated to horseradish peroxidase and detected with chemiluminescence. Western blots were performed using following antibodies; anti-DRD4 antibody at 1:750 (Millipore# MABN125), anti-phospho-p44/42 MAPK (Erk1/2) at 1:1000 (Cell Signaling), anti-p44/42 MAPK(Erk1/2) at 1:1000(Cell Signaling), anti-β-actin at 1:10,000 (Sigma), anti-LC3B at 1:1000 (Cell Signaling #3868), anti-p62 at 1:1000(BD Bioscience), antiLAMP1 at 1:2000(Developmental Studies Hybridoma Bank), anti-mono and polyubiquitinylated protein conjugates (FK2) at 1:1000 (Enzo Life Sciences), anti-phospho-PDGFRβ(Tyr751) at 1:1000(Cell Signaling), anti-PDGFRβ at 1:1000(Cell signaling), anti-phospho-S6 at 1:2000 (Cell signaling), anti-S6 at 1:2000 (Cell Signaling), anti-active caspase-3 at 1:200 (Abcam#ab2302).
Transmission electron microscopy
Cells were harvested, pelleted and fixed in 2% glutaraldehyde in 0.1M sodium cacodylate buffer, rinsed in buffer, post-fixed in 1% osmium tetroxide buffer, dehydrated in a graded ethanol series followed by propylene oxide, and embedded in EMBed 812 resin. Sections 100nm thick were cut on an RMC MT6000 ultramicrotome, stained with uranyl acetate and lead citrate and viewed in an FEI Tecnai 20 TEM.
Tandem mRFPUGFPULC3 reporter assay
Cells were transfected with mRFP-GFP-LC3 construct using Amaxa Nucleofector kit (VPG1004) and were seeded in 6 well plates with 25mm coverslips. After 24h post transfection, cells were treated with compounds for 24 or 48h as indicated. After treatment, coverslip with live cells were transferred onto an attofluor cell chamber with cultured medium and imaged using Quorum spinning disc confocal microscopy. Autophagy flux was assessed by counting cells mRFP GFP LC3 (yellow puncta) which represents autophagosomes, and mRFP GFP-LC3 (red puncta) which represents autolysosomes.
Filipin staining
Cells were treated for 24 or 48h as indicated and visualized for cholesterol accumulation using filipin staining (Sigma-Aldrich, F9765). After fixing cells with 4% paraformaldehyde, cells were incubated with 1.5mg/ml glycine for 10min and incubated with 50mg/ml filipin for 2-3h at room temperature. Images were captured using Quorum spinning disc confocal microscopy.
DQURed BSA assay
Cells were grown in 6 well plates with 25mm coverslip. After treatment, cells were pulsed with DQ-Red BSA (Molecular Probes D-12051) for 1h and chased for 4h before imaging live cells using Quorum spinning disc confocal microscopy.
PhosphoUkinase array
A human phospho-kinase antibody array was purchased from R&D systems (Cat# ARY003). This array contains capture antibodies for 43 kinases in duplicate on nitrocellulose membrane. GNS and NS lines were treated with L-741,742(10 µM) and PNU 96415E (25 µM) along with DMSO control for 24h and cells processed according to the manufacturer’s protocol. Signal intensity was quantified using ImageJ.
Cell cycle analysis
GNS (G362 and G411) cells were incubated with L-741,742(10µM) and PNU 96415E(25µM) for 24h and 48h. Cells were accuatased and cell pellet washed and resuspended in 500µl of PBS. Cells were fixed with 4.5ml of cold 70% ethanol while vortexing gently and stored at 4oC for at least 2h. Wash cells with PBS and incubated with 0.5ml of propidium iodide (20µg/ml)and RNaseA (0.5µg/ml) and analyze through flow cytometry.
Apoptosis assay
Cells were seeded at 2500 cells/well in 96 well clear bottom black plates and treated with compounds for 24 or 48h as indicated. Apoptosis assay was performed using Apo-ONE Homogenous Caspase3/7 assay kit (Promega-G7790) as per protocol and plate measured for fluorescence after 4h incubation.
Accession number
The GenBank accession number for the PNU 96415E treated GNS microarray data described in this thesis is GSE62714
3.3 Results
3.3.1 Effect of DRD4 antagonism on global gene expression patterns
To determine the potential mechanism of action for a DRD4 antagonist on GNS proliferation and survival, I studied global gene expression profiles with and without DRD4 inhibition. Two GNS lines (G362 and G411) were treated with PNU 96415E (25 µM) for 24h and 48h and analyzed for differential effects of PNU 96415E on gene expression. Gene set enrichment analysis (GSEA) was used to identify pathways enriched in differentially regulated genes upon PNU 96415E treatment. Genes that were down regulated at 48h were enriched in 172 gene sets that are highly connected, as categorized into 25 main biological functions including DNA replication, chromatin remodeling, DNA repair, cell cycle, and RNA splicing (Figure 3.1A).
Overlap of the top down-regulated genes (fold change <-1.5) in both G362 and G411 cell lines revealed genes involved in DNA replication and cell cycle phase transitions (Figure 3.1C-D). For genes up-regulated upon PNU 96415E treatment, I observed enrichment in 45 gene sets (FDR =< 0.002) that comprised 14 main pathways including lipid/cholesterol biosynthesis, autophagic vacuoles and lysosomes (Figure 3.1B). Overlap of the top up-regulated genes (fold change>1.5) uncovered pathways involved in cholesterol biosynthesis after 24h and autophagic vacuole formation after 48h (Figure 3.1E-F). This expression analysis suggested that the genes involved in DNA replication and cell cycle progression were inhibited by DRD4 antagonism, while genes involved in lipid metabolism and autophagy were activated.
A B
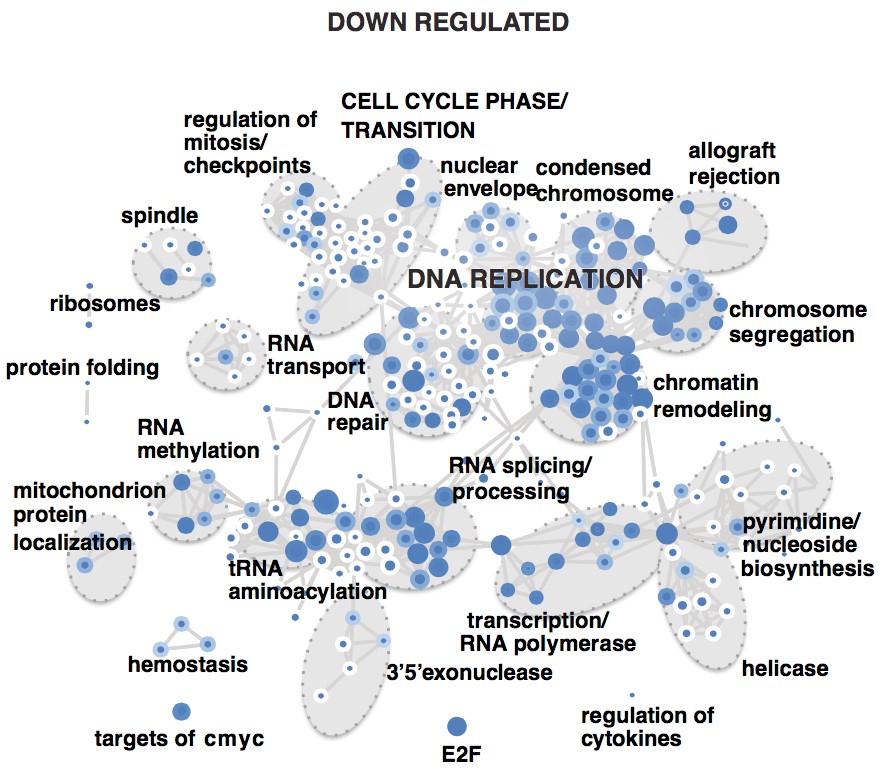
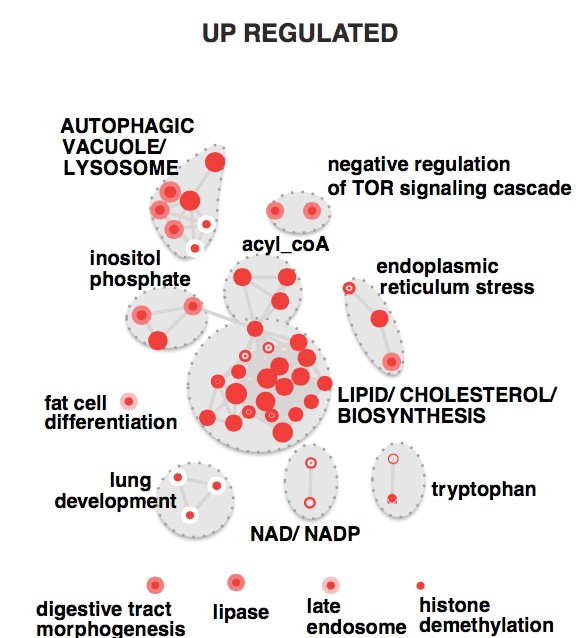
C D
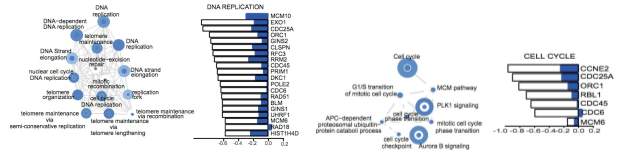
E F
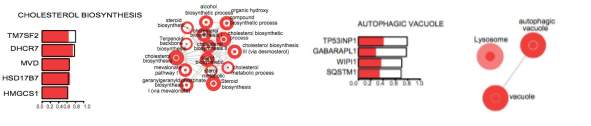
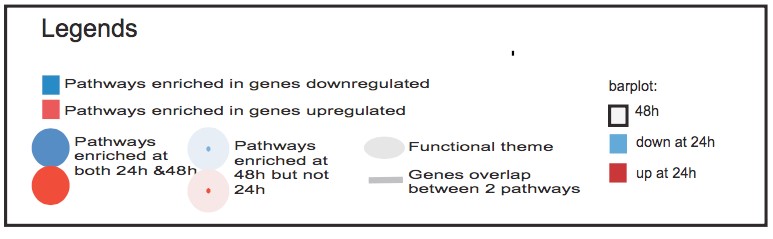
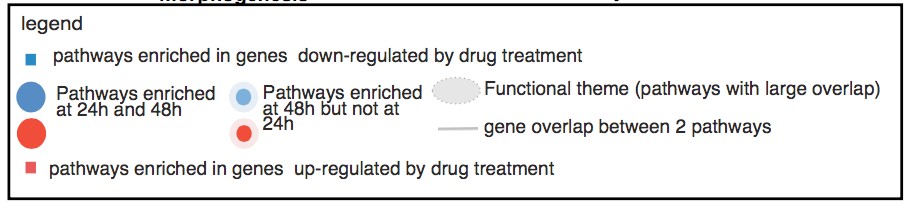
Figure 3.1. Effect of DRD4 inhibition with PNU 96415E on gene expression pattern
A& B Gene set enrichment map of pathways containing genes down regulated and up regulated respectively upon PNU 96415E treatment. Colored circles (nodes) represent gene-sets (pathways) that were significantly enriched in the comparison treated versus control samples (FDR <=0.002).
- Enrichment map showing each gene-set and label contained in ‘DNA replication’ functional theme from the down regulated map (FDR <=0.001). Right: Expression at 24h and 48h (logFC <= -1.5) of genes included in the DNA replication gene-set (GO:0006260, FDR =0.0005).
- Enrichment map showing each gene-set and label contained in ‘Cell Cycle phase/ transition functional’ theme from the down-regulated map (FDR <=0.001). Right: Expression at 24h and 48h (logFC <= -1.5) of genes included in the Cell cycle gene-set (KEGG:HSA04110, FDR =0.0005 ).
- Enrichment map showing each gene-set and label contained in ‘Lipid/ cholesterol/ biosynthesis’ theme from the up regulated map (FDR <=0.001). Left: Expression at 24h and 48h (logFC >= 1.5) of genes included in the Cholesterol biosynthesis gene-set (HUMANCYC%PWY66-5, FDR =0.0005).
- Enrichment map showing each gene-set and label contained in ‘Autophagic vacuole/ lysosome’ theme from the up regulated map (FDR <=0.001). Left: Expression at 24h and 48h (logFC >= 1.5) of genes included in the autophagic vacuole gene-set (GO:0005776, FDR = 5.0888734E-4).
3.3.2 DRD4 antagonism causes massive accumulation of autophagic vacuoles and cholesterol
Prompted by the pronounced up-regulation of autophagy genes in response to DRD4 inhibition, autophagy status was assessed in GNS cells. Conversion of LC3-I (microtubule associated protein 1 light chain 3-I) to LC3-II serves as a hallmark for autophagosome formation. L741,742 (10 µM) and PNU 96415E (25 µM) treatment in GNS cells (G411 and G362) caused an increase in levels of LC3B-II consistent with accumulation of autophagosomes (Figure 3.2A). I also observed increased LC3B puncta in GNS cells upon treatment, with more than 50% cells showing large LC3B puncta after 48h, indicating the presence of autophagosomes (Figure 3.2B). Accumulation of autophagosomes was further corroborated by transmission electron microscopy. L-741,742 and PNU 96415E treatment in both G411 and G362 caused the formation of large autophagic vacuoles containing various cellular fragments. (Figure3.2C-D).
A B
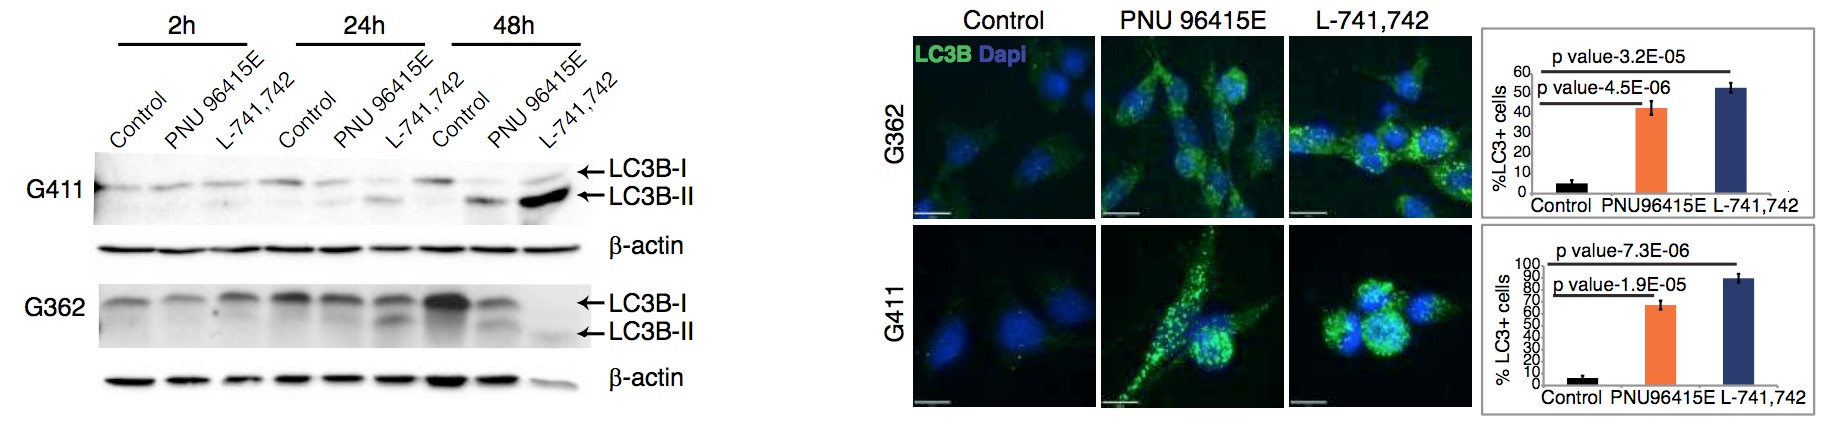
C D
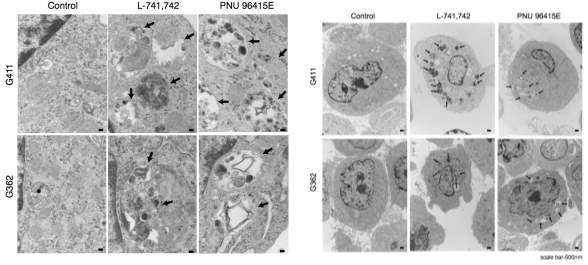
Figure 3.2. DRD4 antagonism causes accumulation of autophagic vacuoles
A. Western blot analysis for anti-LC3B and anti-βactin in G411 and G362 cells treated with PNU 96415E(25 µM) and L-741,742(10 µM) at indicated time points. B. Immunofluorescence staining for LC3B puncta in G362 and G411 cells treated with PNU 96415E (25 µM) and L741,742 (10 µM) at 48h. Scale bar =17µm. Quantification of LC3B puncta cells in each group (cells counted >200 cells). N=3, mean ±SEM, unpaired one-tailed t-test. C&D. TEM images showing large autophagic vacuoles in G362 and G411 cells treated with L-741,742(10 µM) and PNU 96415E (25 µM) compared to control DMSO at 48h. Arrows indicate enlarged autophagic vacuoles. Scale bar-100nm(C) 500nm(D). As genes involved in the cholesterol biosynthesis were also up regulated upon DRD4 inhibition and cholesterol accumulation is associated with autophagy impairment as reported in the context of Niemann Pick Type C disease (Vance, 2006), I next analyzed the cholesterol level in GNS cells with a filipin assay. Upon treatment with L-741,742(10 µM) and PNU 96415E(25 µM), GNS cells showed accumulation of cholesterol in large puncta, compared to the diffuse pattern observed in control cells (Figure 3.3). Together, these experiments revealed a massive accumulation of autophagic vacuoles and cholesterol accumulation in GNS cells after DRD4 receptor antagonism.
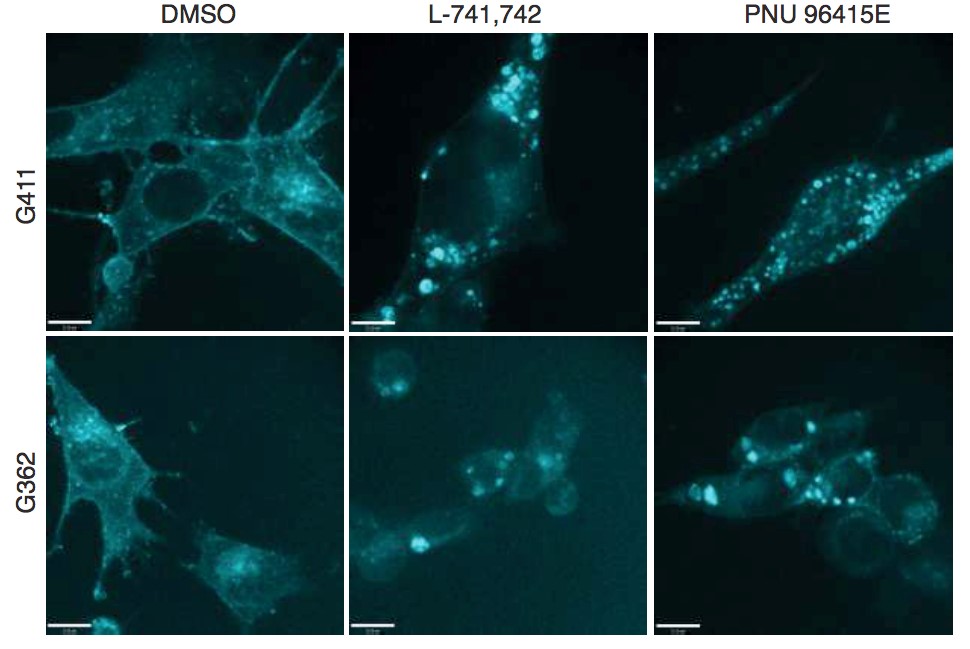
Figure 3.3. DRD antagonism causes cholesterol accumulation
Filipin staining for free cholesterol in G362 and G411 cells treated with L-741,742(10 µM) and PNU 96415E(25 µM) compared to control DMSO at 48h. Scale bar-11µm To test whether autophagosome formation is specific to GNS cells, I assessed autophagosome formation by analyzing LC3-II levels of both fibroblasts and NS cells after treatment. While DRD4 antagonism at 48h did show a slight increase in LC3-II level in both cases, this was not to the same extent as seen in GNS cells (Figure 3.4 A-B). It is also interesting to note that GNS and fibroblast cells have very different basal levels of autophagy measured by LC3-II status under their normal growth conditions (Figure 3.4C), which likely explains differential vulnerability and dependence on autophagy for survival.
A C
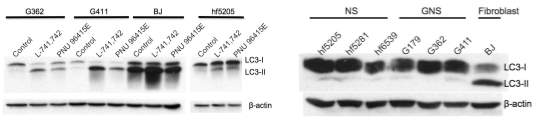
B
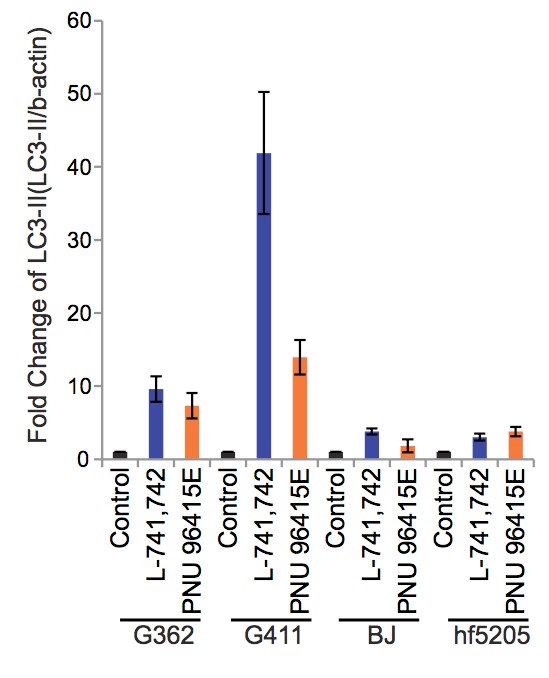
Figure 3.4. Autophagy levels in fibroblast, NS and GNS cells upon DRD4 antagonism
A&B Western blot analysis for anti-LC3B and anti- β-actin across different cell lines, GNS (G362&G411), NS (hf5205) and Fibroblast (BJ) upon treatment with L-741,742(10µM) and PNU 96415E(25µM) at 48h, and quantification of western blots (LC3-II/ β-actin). N=3, mean ±SEM. C. Western blot analysis for anti-LC3B and anti- β-actin across different cell lines, GNS (G362, G411&G179), NS (hf5205, hf5281&hf6539) and Fibroblast (BJ) at basal level.
3.3.3 Autophagosome accumulation is due to an inhibition in autophagic flux
An increase in LC3-II levels, and autophagosome number, can result from either the induction or inhibition of autophagic flux at a later stage in the pathway. Autophagy flux can be measured by assessing LC3-II turnover in the presence or absence of inhibitors of lysosomal degradation such as chloroquine. In chloroquine treated cells, an autophagy inducer would increase LC3-II levels, where as an autophagy blocker would not change LC3-II levels. In the presence of chloroquine, L-741,742 and PNU 96415E treatment did not increase LC3-II levels compared to control, despite the fact both drugs increased LC3-II levels when administered alone (Figure 3.5). These data suggest that the effect of DRD4 antagonism on LC3-II levels is a result of impaired flux.
A B
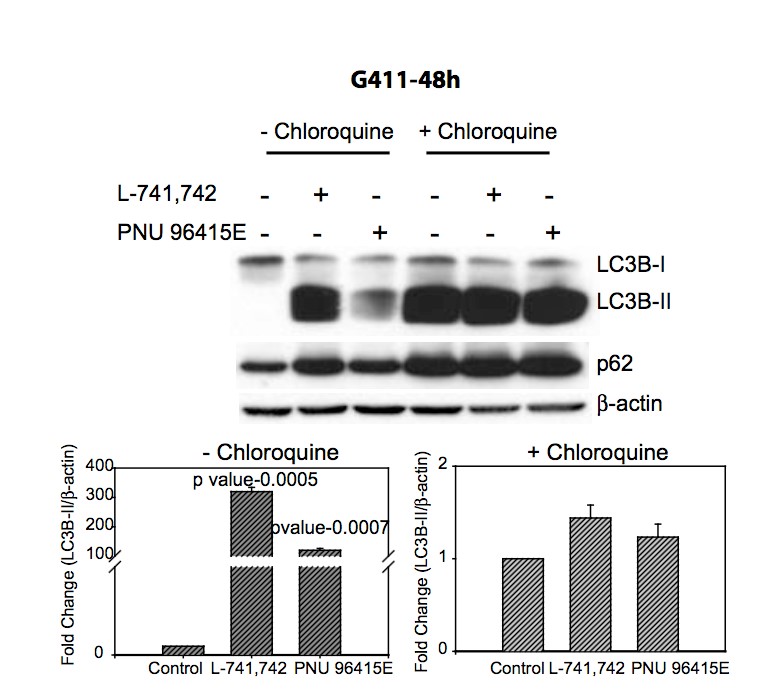
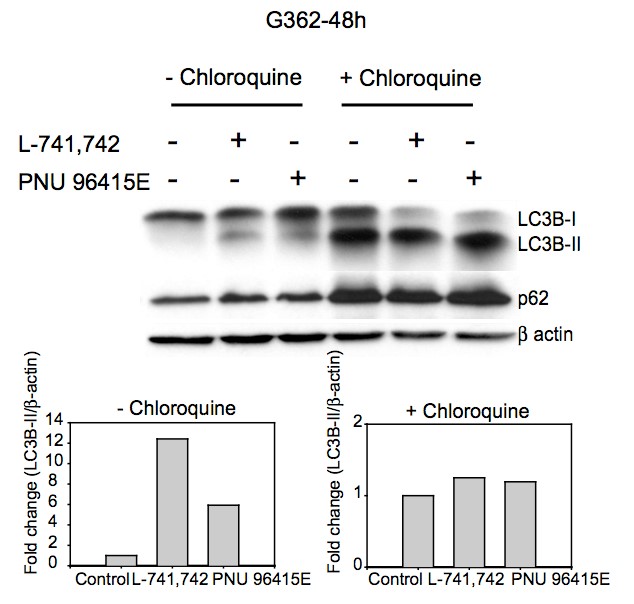
Figure 3.5. Accumulation of autohagic vacuole is due to block in autophagic flux
A&B. Western blot analysis for anti-LC3B, anti-p62 and anti-β-actin in G411 and G362 cells respectively treated with L-741,742(10 µM) or PNU 96415E (25 µM) in the presence and absence of chloroquine (30 µM) at 48h. Western quantification for LC3B-II was done using βactin as control. N=3, mean ±SEM. I then assessed autophagy turnover, first by assaying for the autophagy-specific substrate p62. As predicted for a block in autophagic flux, p62 accumulated along with the increase in LC3B-II in L-741,742 or PNU 96415E treated GNS cells (Figure 3.6 A-B). Consistent with an impairment in autophagy, I also observed an increase in undegraded ubiquitinated protein conjugates in treated cells (Figure 3.6 A-B) and further noted an increased level of LAMP 1 (lysosome associated membrane protein 1) (Figure 3.6 A-B) and LysoID reactivity (Figure S3.1), both of which indicate an increase in lysosome accumulation due to impaired autophagic flux.
A B
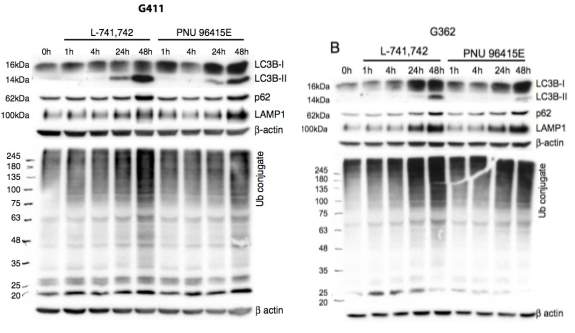
Figure 3.6. Accumulation of autophagy substrates upon DRD4 antagonism
A&B Western blot analysis for corresponding anti-LC3B with anti-p62, anti-LAMP1, anti- mono & poly ubiquitinated protein conjugates (FK2) and anti-β-actin in G411 and G362 cells respectively treated with L-741,742(10 µM) and PNU 96415E (25 µM) at indicated times points. I further validated flux inhibition by performing an image-based colocalization analysis of a tandem mRFP-GFP-LC3 construct (Kimura et al., 2007). In this experiment, GFP fluorescence is quenched by the acidic pH within a lysosome, allowing us to differentiate between autophagosomes (GFP positive and RFP positive - yellow) and autolysosomes (GFP negative and RFP positive - red). Treatment of transfected GNS cells with DRD4 antagonists showed an accumulation of yellow puncta, indicating autophagosome accumulation (Figure 3.7 A). As a negative control, I used rapamycin, an autophagy inducer, which showed a higher ratio of red puncta and as a positive control I used chloroquine, which lead to a higher ratio of yellow puncta (Figure 3.7A). I also noted the ratio of yellow versus red puncta at 48h (Figure 3.7A) increased from that seen at 24h after treatment (Figure S3.2), suggesting an inhibition in autophagic flux over time during DRD4 antagonism. To validate the specificity to GNS cells, I further monitored flux inhibition in fibroblast and NS cells with the same assay. Interestingly, I did not see a dramatic increase in yellow puncta upon DRD4 antagonist treatment in either case (Figure 3.7B).
A B
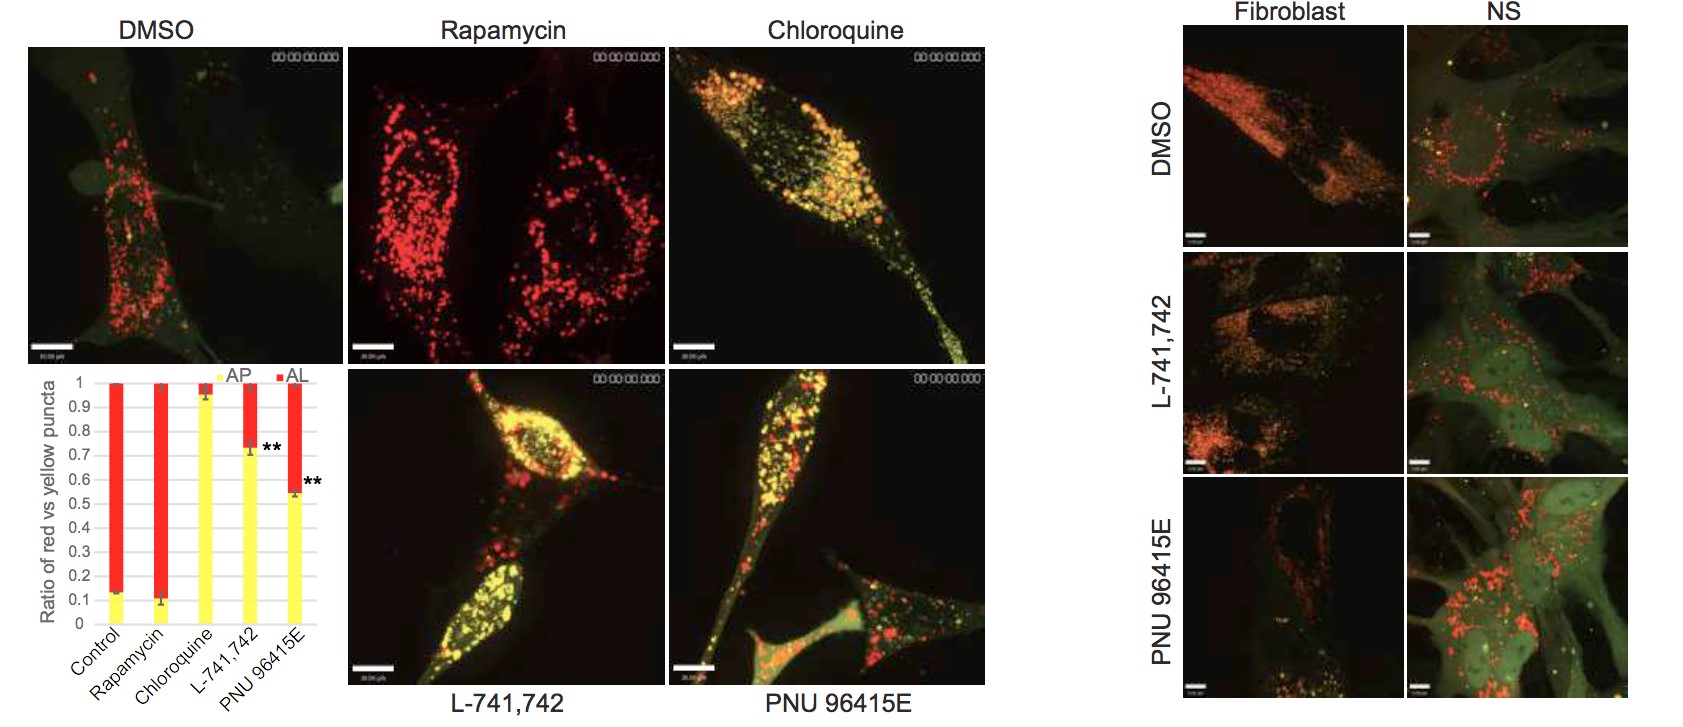
Figure 3.7. Autophagic flux measurement using confocal analysis of mRFP-GFP-LC3 upon DRD4 antagonism
A. Confocal analysis of G411 cells expressing tandem mRFP-GFP-LC3 reporter treated with Rapamycin (500nM), Chloroquine (30µM), L-741,742(10µM) and PNU 96415E (25µM) at 48h, and quantification of ratio of red puncta indicating autolysosome(AL) versus yellow puncta indicating autophagosome(AP). N=3, mean± SEM** p value-0.0006 and 0.0003 in L-741,742 and PNU 96415E espectively. Scale bar-10µm. B. Confocal analysis of Fibroblast (BJ) and NS cells (hf5205) expressing tandem mRFP-GFP-LC3 reporter treated with L-741,742(10µM) and PNU 96415E(25µM) at 48h. Scale bar-7µm. To confirm that the impairment of the autophagy-lysosomal degradation pathway induced by L741,742 and PNU 96415E was mediated through DRD4, I assessed autophagic flux after shRNA knockdown of DRD4 in GNS cells. Consistent with this, increased levels of LC3-II was observed in DRD4 knockdown cells compared to sh-eGFP transduced controls (Figure 3.8). This increase in LC3-II was accompanied by accumulation of p62, LAMP1 and ubiquitinated protein conjugates, all consistent with a block in autophagic flux (Figure 3.8, S3.3). I further validated this effect with another short hairpin from different source (Origene) and noted similar results (Figure S3.3B). Taken together, these data strongly suggest that the cytotoxicity observed after DRD4 antagonism in GNS cells is due to a block at a later stage of autophagy that results in massive accumulation of autophagic vacuoles.
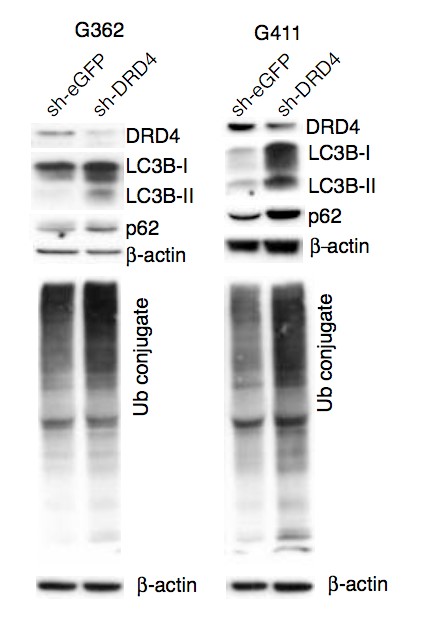
Figure 3.8. Autophagic flux inhibition in DRD4 knockdown cells
Western blot analysis for corresponding anti-DRD4, anti-LC3B, anti-p62, anti-mono and poly ubiquitinated protein conjugate (FK2) and anti-β-actin in transient transfected sh-DRD4 and sheGFP G362 and G411 cells post 72h.
3.3.4 Inhibition of autophagic flux after DRD4 antagonism is due to a disruption in lysosomal function.
To further understand the inhibition in flux, I assessed lysosomal function with a DQ BSA assay. DQ Red BSA is a derivative of BSA that is labeled with a self-quenched red fluorescent dye. Upon proteolysis by lysosomal proteases, the fluorescence is dequenched and can be detected by microscopy. Compared to control NS and fibroblast cells, GNS cells treated with DRD4 antagonists displayed a reduction in red puncta number per cell, suggesting very low dequenching of the fluorescent BSA due to compromised lysosomal function (Figure 3.9) These data demonstrate that autophagic flux impairment in GNS cells treated with DRD4 antagonists is due to an inhibition in lysosomal function.
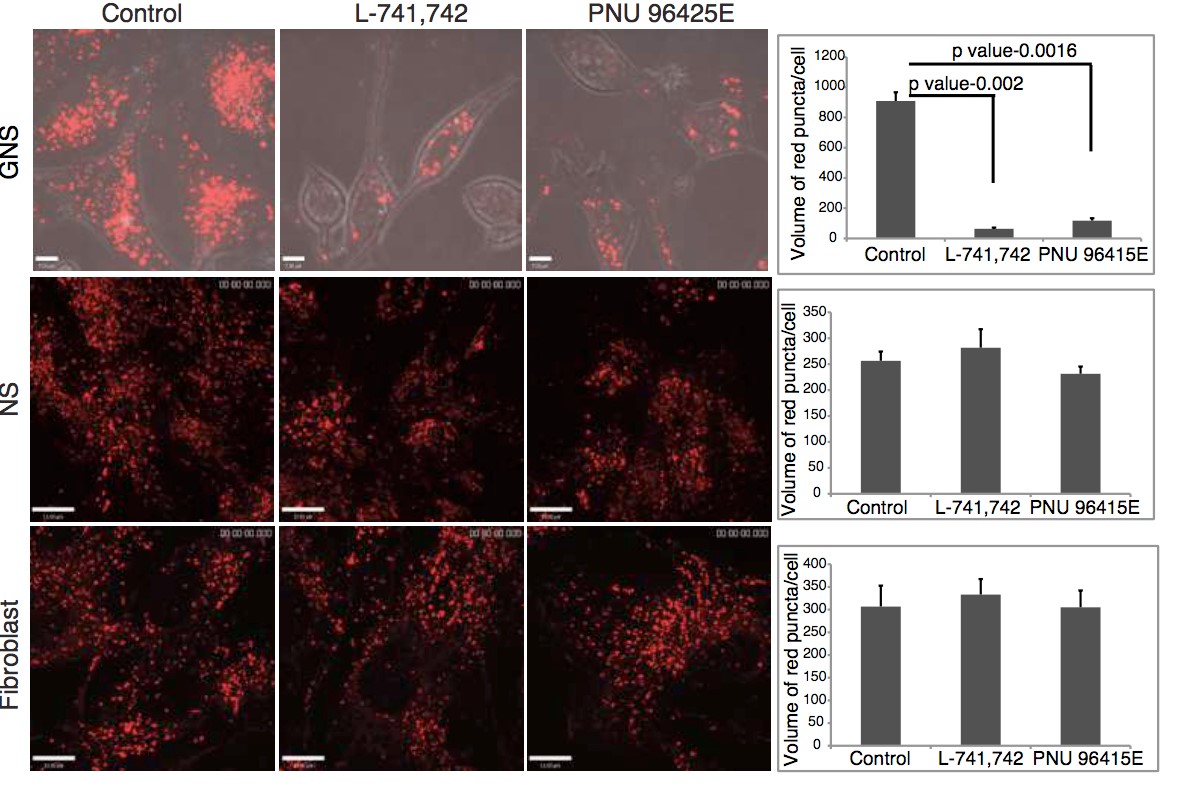
Figure 3.9. Disruption in endolysosomal function upon DRD4 antagonism
Confocal analysis for red puncta indicating dequenched BSA in GNS cells (G411) NS cells (hf5205) and fibroblast (BJ) treated with L-741,742(10µM) and PNU 96415E(25µM) at 48h. Quantification of red puncta per cell in each treatment. N=3, mean±SEM, unpaired one-tailed ttest. Scale bar- 7µm for GNS and 13µm for NS and fibroblast.
3.3.5 DRD4 antagonism causes a disruption in PDGFRβUERK1/2 and mTOR signaling.
To determine how DRD4 receptor antagonism in GNS cells may mechanistically mediate the striking cellular effects observed, I studied the phosphorylation status of 43 kinases and substrates implicated in various signaling pathways in GNS cells versus NS cells using a dot blot assay. Cells were treated with L-741,742 (10µM) and PNU 96145E (25µM) for a period of 24h and protein lysates were harvested and assessed with a phosphoprotein antibody array (Figure 3.10 A). I identified 18 phosphoproteins that exhibited a decrease in phosphorylation upon treatment in GNS cells (Figure 3.10 C-D). ERK1/2 was one of the top hits in the array, with a 40% reduction compared to the untreated control. DRD4 is known to activate ERK1/2 by transactivation of platelet derived growth factor receptor β (PDGFRβ) (Gill et al., 2010; Oak et al., 2001). The selectivity of DRD4 antagonism to GNS cells was reflected in the much more modest changes in phospho-profile of NS cells after treatment (Figure3.10B).
A B
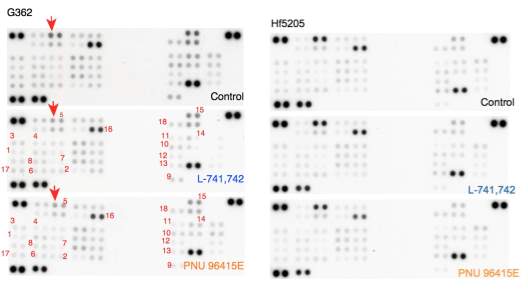
C D
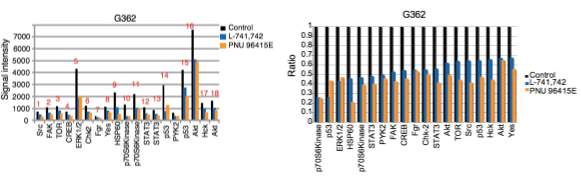
Figure 3.10. Effect of DRD4 antagonism on phospho-kinases activity
A&B. A dot blot containing 43 phosphoproteins in duplicates after exposure to lysate of G362 and hf5205 cells respectively treated with L-741,742 (10 µM) and PNU 96415E (25 µM) and DMSO for 24h. C. Signal intensity of each spot corresponding to each phosphoprotein (average of two spots) that changed upon treatment compared to DMSO. Signal intensity was quantified using ImageJ. D. Ratio of control versus L-741,742 and PNU 96415E for each phospho-proteins that changed upon treatment in GNS (G362 cells). I validated the effect of DRD4 antagonism on ERK1/2 phosphorylation by western blot at various time intervals and observed a decrease in ERK1/2 phosphorylation over time in GNS cells but not in NS cells and fibroblasts (Figure 3.11A, S3.4), along with a concordant decrease in PDGFRβ phosphorylation (Figure 3.11B). I also confirmed that transient DRD4 knockdown decreased ERK1/2 phosphorylation in GNS cells compared to control shRNA-eGFP transfected cells (Figure 3.11C). These biochemical data suggest that the DRD4 antagonists act on target and that DRD4 regulates GNS cell growth in part through the PDGFRβ- ERK1/2 pathway.
A B
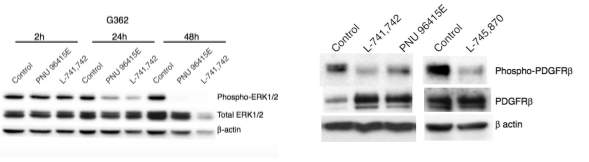
C
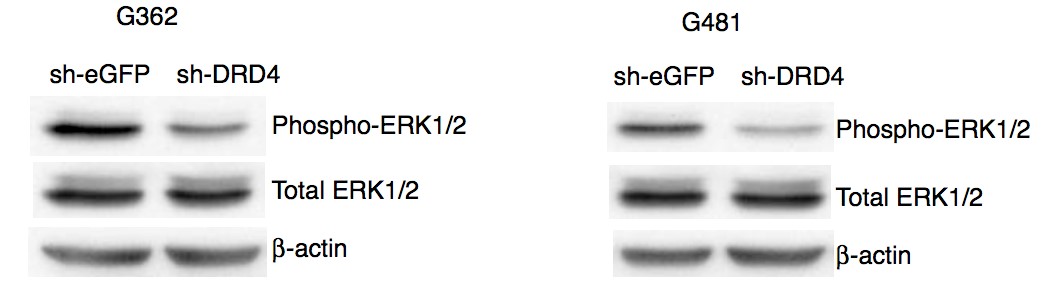
Figure 3.11. Downregulation of PDGFR-β/ERK1/2 signaling pathway upon DRD4 antagonism
A. Western blot analysis for anti-phospho-ERK1/2, anti-ERK1/2 and anti β-actin in G362 cells treated with L-741,742 (10 µM) at indicated time points. B. Western blot analysis for antiphospho-PDGFR-β, anti-PDGFR-β and anti β-actin in G362 cells treated with L-741,742 (10 µM) at indicated time points. C. Western blot analysis for anti-phospho-ERK1/2 and anti- ERK1/2 in G362 and G481 cells transiently transfected with sh-DRD4 and control sh-eGFP post 72h. I further validated the phospho-array data on down regulation of TOR (Figure 3.10C), which is well known to regulate autophagy both at early induction as well as later during lysosome biogenesis (Jewell et al., 2013). I observed a dramatic decrease in phospho-S6, a downstream effector of mTOR, in GNS cells after 48h of treatment suggesting downregulation of the pathway (Figure 3.12). There is no change in the Phospho-ERK1/2 and Phospho-S-6 in treated fibroblasts and NS cells (Figure 3.12) indicating that disruption in these signaling pathways confers GNS sensitivity to DRD4 antagonists.
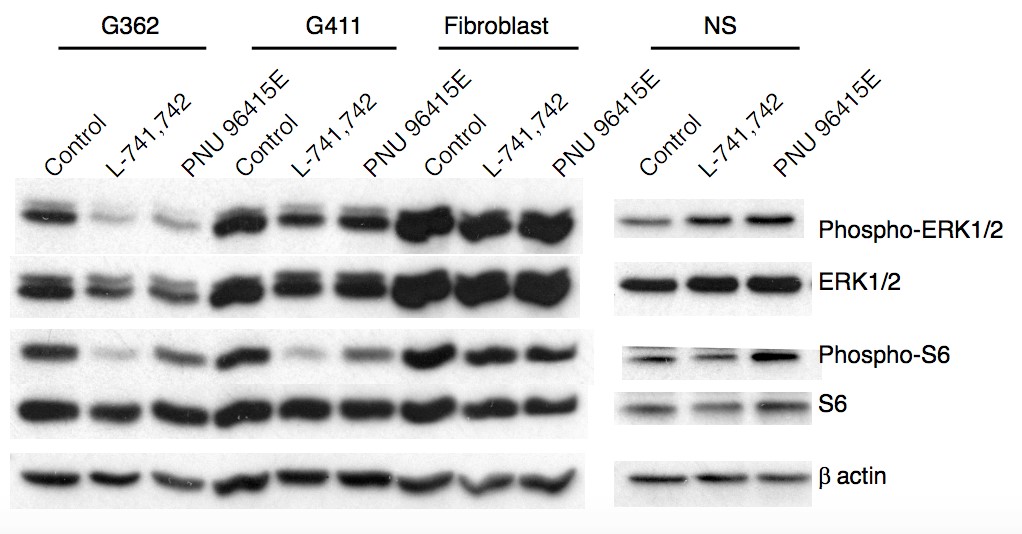
Figure 3.12. Differential effect of DRD4 antagonism on ERK1/2 and TOR pathway in different cell lines
Western blot analysis for anti-phospho-ERK1/2 and anti-ERK1/2, anti-phospho-S6 and anti-S6, and anti-β-actin in GNS cells (G362&G411), fibroblast (BJ) and NS (hf5205) cells treated with L-741,742(10 µM) and PNU 96415E (25 µM) for 48h.
3.3.6 DRD4 antagonists trigger a G0/G1 phase arrest and apoptosis
As DRD4 antagonists inhibit proliferation of GNS cells accompanied by decreased expression of cell cycle genes (Figure 3.1), I sought to determine the effect of DRD4 antagonists on the cell cycle. Flow cytometric analysis of DNA content in G411 and G362 cells treated with either L741,742 or PNU 96415E revealed a G0/G1 arrest in a time dependent manner (Figure 3.13, S 3.5).
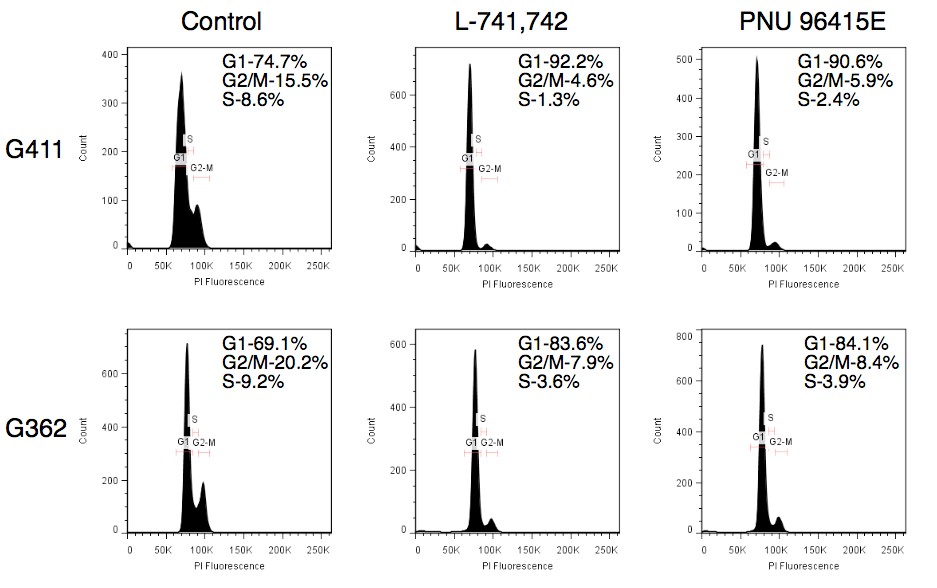
Figure 3.13. DRD4 antagonist causes G0/G1 phase arrest
A. Cell cycle analysis of G411 and G362 cells after treatment with L-741,742 (10 µM) and PNU 96415E (25 µM) at 48h. After 48h of treatment with DRD4 antagonists, there was an induction of caspase 3/7 activity (Figure 3.14A) suggesting an increase in apoptosis. I also observed that the caspase-3 and -7 activation was seen only after 48h of treatment indicating autophagic flux inhibition precedes apoptosis. This data is further corroborated by the presence of cleaved PARP at 48h (Figure 3.14B) and an increase in active caspase 3 staining (Figure 3.14C). Combined, these data suggest DRD4 inhibition leads to cell cycle arrest followed by apoptosis.
A B
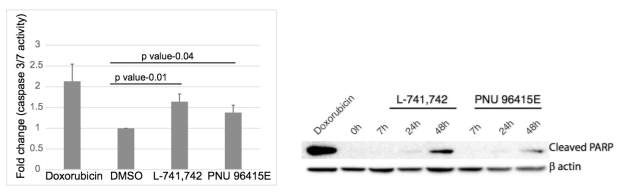
C
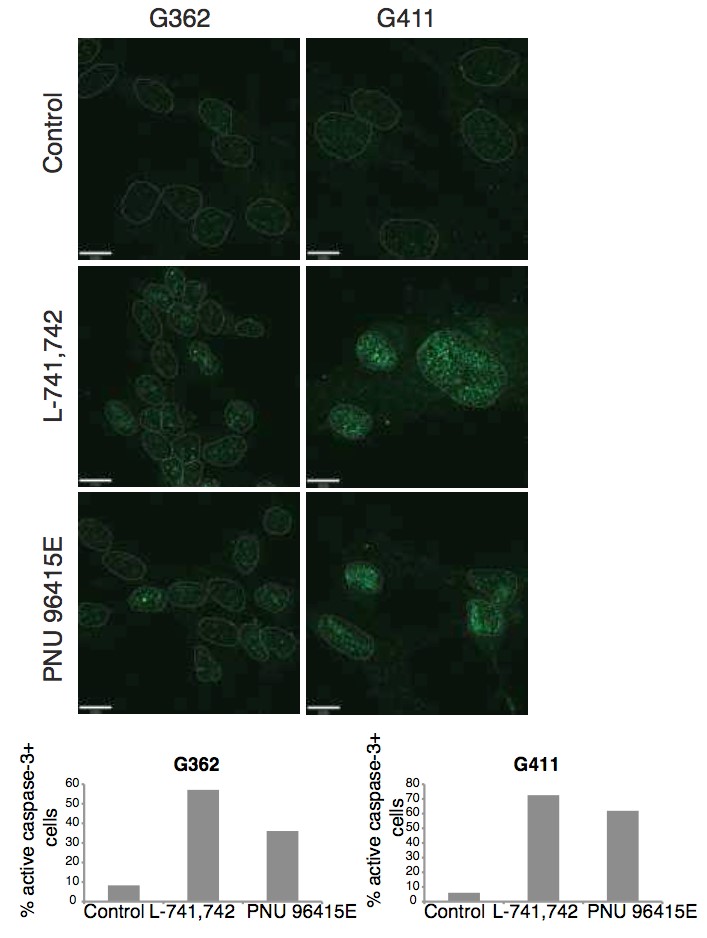
Figure 3.14. DRD4 antagonists causes apoptosis
A. Fluorescence read out for caspase 3/7 activity in G411cells treated with L-741,742 (10 µM) and PNU 96415E(25 µM) for 48h, and doxorubicin (1µM) for 24h as positive control. N=3, mean±STDEV. B. Western blot analysis for apoptosis marker anti-cleaved PARP in G362 treated with L-741,742 (10 µM) and PNU 96415E (25 µM) at indicated time points, and doxorubicin(1µM) at 24h as control. C. Immunofluorescence staining and quantification for antiactive caspase-3 in G411 and G362 cells treated with L-741,742 (10 µM) and PNU 96415E (25 µM) for 48h.Scale bar- 11µm. Furthermore, GNS cells treated with an autophagy inhibitor (chloroquine) or ERK1/2 pathway inhibitor (PD 0325901) could mediate G0/G1 arrest (Figure S3.5B), demonstrating the connection between DRD4 antagonism-autophagy inhibition and cell cycle arrest.
3.4 Discussion
There is growing evidence that suggests that dopamine has a role in regulation of endogenous neurogenesis during brain development and adult neurogenesis. However, little is known about how modification of dopamine signaling can affect brain tumor stem cell behavior. Here this thesis demonstrates an important role for dopamine-DRD4 signaling in the growth and survival of GNS cells mediated through modulating the autophagy-lysosomal system. I have demonstrated that inhibition of dopamine D4 receptor impairs autophagy/lysosomal degradation pathway resulting in massive accumulation of autophagic vacuoles accompanied with an increased accumulation of autophagic substrate p62, ubiquitinated protein, cholesterol and lysosomal cargo, arresting GNS cells at G0/G1 followed by apoptosis. I further demonstrated that this impairment in autophagic flux is due to the disruption in the endolysosomal function. Furthermore, inhibition of DRD4 suppressed its known downstream PDGFR-β /ERK signaling pathway, where inhibition of PDGFR-β is reported to inhibit GBM self renewal and tumor growth further supporting the data (Kim et al., 2012). Autophagy is a dynamic cellular process that involves lysosomal degradation of unnecessary or damaged cellular components into cellular constituents, which then recycles back into cytosol to maintain cellular homeostasis. The autophagy-lysosomal degradation pathway system appears to be critical for the progression and/or maintenance of many cancer types (Kenific and Debnath, 2014). For example, autophagy is important for breast cancer stem cell maintenance (Choi et al., 2014; Gong et al., 2013) and pancreatic cancer stem cells (Yang et al., 2015).
In a number of cancer studies, including for GBM, autophagy inhibition with chloroquine appears to augment the efficacy of anticancer therapies (Sotelo et al., 2006). My data suggests that autophagy plays an essential role in GNS cell growth and survival, and that dopamine signaling through the DRD4 receptor is required to maintain the autophagy-lysosomal degradation system. I have shown that GNS cells are vulnerable to disruption of this pathway compared to fibroblasts and NS cells. I hypothesize that potential differences in the basal activity and dependence of GNS cells on autophagy-lysosomal pathway compared to normal NS cells and fibroblasts may account for the susceptibility of GNS cells to DRD4 antagonists. Consistently, it has recently been reported that GBM cells are sensitive to the vacuolization agent vacquinols (Kitambi et al., 2014) and a breast cancer stem cell selective compound salinomycin is also reported to confer selectivity through inhibiting autophagic flux (Yue et al., 2013). Thus, identification of DRD4 antagonists as GNS selective compounds revealed the autophagy-lysosomal system as a vulnerable and important system for GNS cell survival and maintenance, and modulation of dopamine DRD4 signaling may be of therapeutic benefit in GBM patients.
Impairment of the autophagy-lysosomal pathway is also intimately associated with neurodegenerative diseases in which neurochemical signaling is dysregulated, including Parkinson’s Disease, Alzheimer’s Disease and Niemann-Pick Type C1 disease (Nixon, 2013; Sarkar et al., 2013). Autophagy has been implicated in the maintenance of adult NSCs (Wang et al., 2013; Yazdankhah et al., 2014) and suppression of autophagy in NSCs during development in mice causes neurodegenerative diseases (Hara et al., 2006).
This study suggests new insights into the role of DRD4 signaling in neurological disorders such as ADHD, bipolar disorder and schizophrenia, which are reported to be associated with DRD4 polymorphism (LaHoste et al., 1996; Rondou et al., 2010). As I have shown in GBM, impaired DRD4 function in these neurological diseases could disrupt autophagic flux by a similar mechanism. Further investigation of the link between DRD4 signaling, autophagy impairment and cell survival in neurodegenerative diseases, cognitive brain disorders and GBM is warranted. In particular, further exploration of the role of neurochemical signaling pathways specifically dopaminergics, serotonergics and cholinergics pathways in GBM may yield novel therapeutic approaches to treat this intractable disease.
Supplemental figures
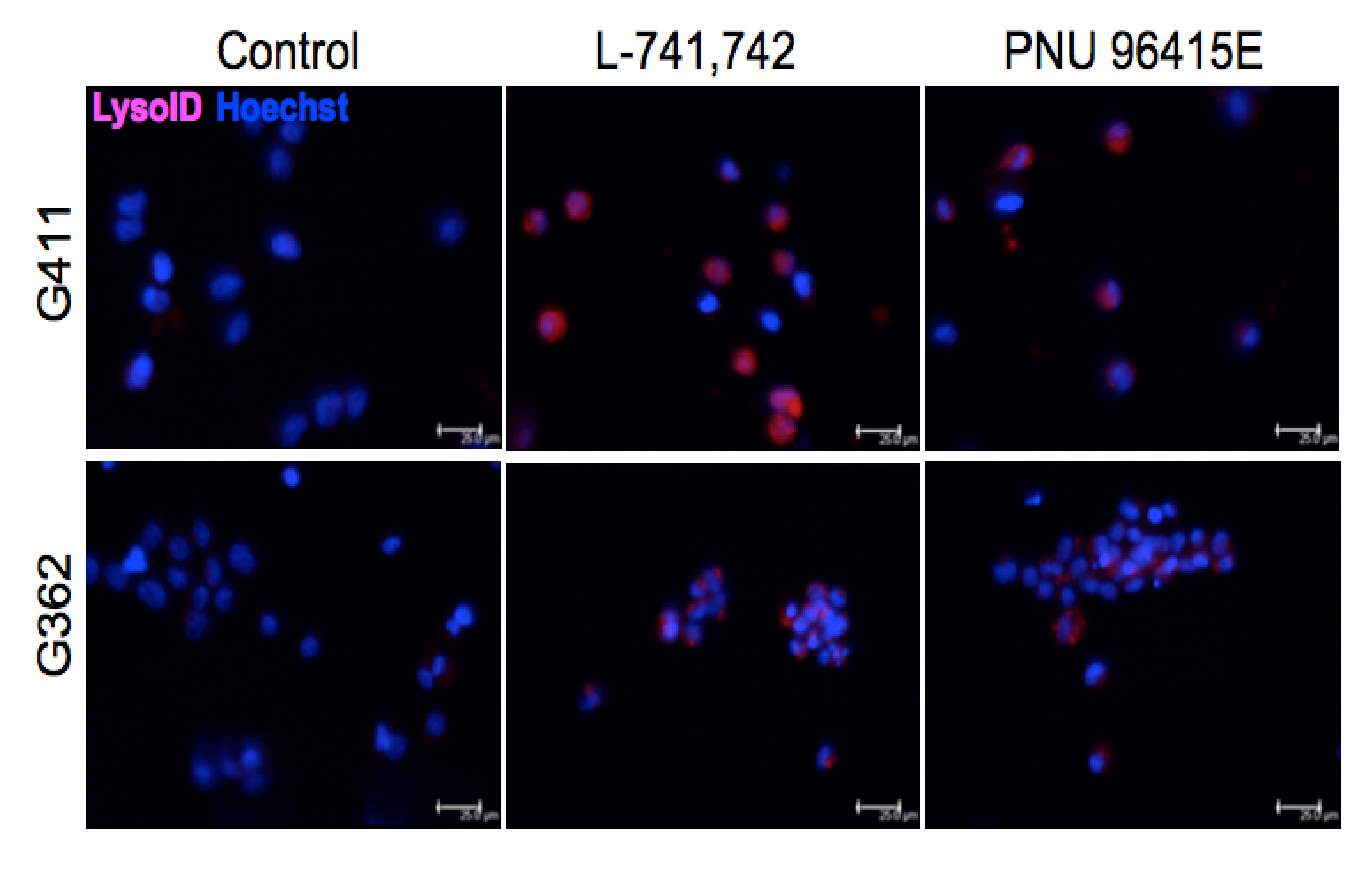
Figure S3.1. Increased number of lysosome upon DRD4 inhibition
Fluorescence staining of lysoID-Red (lysosomes marker) in live GNS cells (G411 and G362) treated with L-741,742 (10 µM) and PNU 96415E (25 µM) at 48h treatment. Scale bar-25µm.
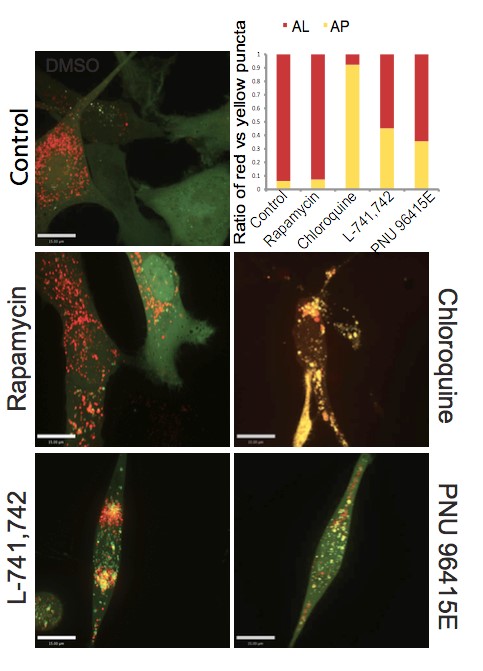
Figure S3.2. Autophagy flux measurement at 24h
Confocal analysis of GNS cells (G411) expressing tandem mRFP-GFP-LC3 reporter treated with Rapamycin(500nM), Chloroquine(30µM), L-741,742(10µM) and PNU 96415E(25µM) at 24h, and quantification of ratio of red puncta (RFP -GFP--LC3) indicating autolysosome(AL) versus yellow puncta (RFP -GFP -LC3) indicating autophagosome(AP). Scare bar-10µm.
A B G362 G411
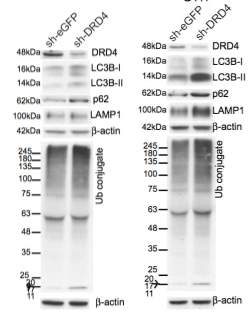
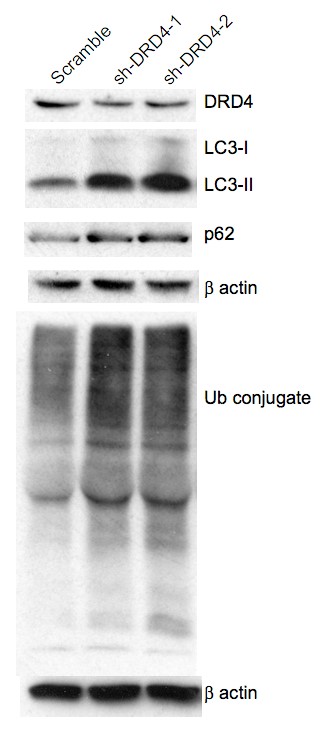
Figure S3.3. Autophagic flux inhibition in DRD4 knockdown cells
A. Western blot analysis for anti-DRD4, anti-LC3B, anti-p62, anti-LAMP1, anti-mono and poly ubiquitinated protein conjugates (FK2) in an independent experiment G362 and G411 cells transiently transfected with shDRD4 and sh-eGFP (Open Biosystems) post 72h. B. Western blot analysis for anti-DRD4, anti-LC3B, anti-p62, anti-mono and poly ubiquitinated protein conjugates (FK2) in G411 cells transiently transfected with an another set of shRNA against DRD4 from Origene; shDRD4-1, shDRD4-2, and non-effective scramble shRNA, post 72h.
B
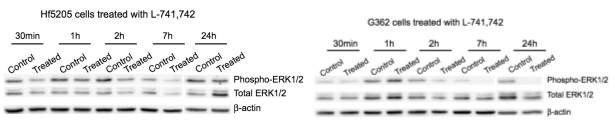
C
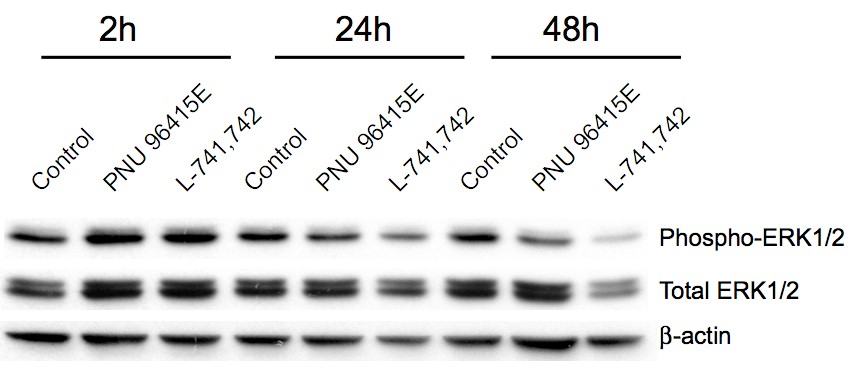
Figure S3.4. Phospho-ERK1/2 downregulation upon DRD4 inhibition
A-B. Western blot analysis for anti-phospho-ERK1/2, anti-ERK1/2 and anti β-actin in hf5205 and G362 cells respectively treated with L-741,742 (10 µM) at indicated time points. C. Western blot analysis for anti-phospho-ERK1/2, anti-ERK1/2 and anti β-actin in G411 cells treated with L-741,742(10 µM) and PNU 96415E(25 µM) at indicated time points.
A
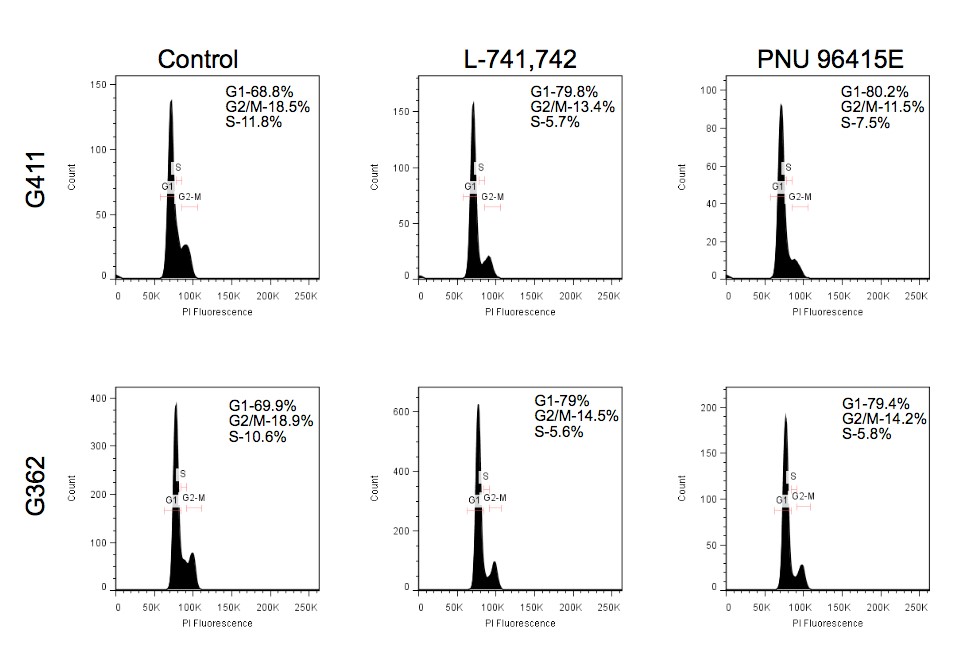
B
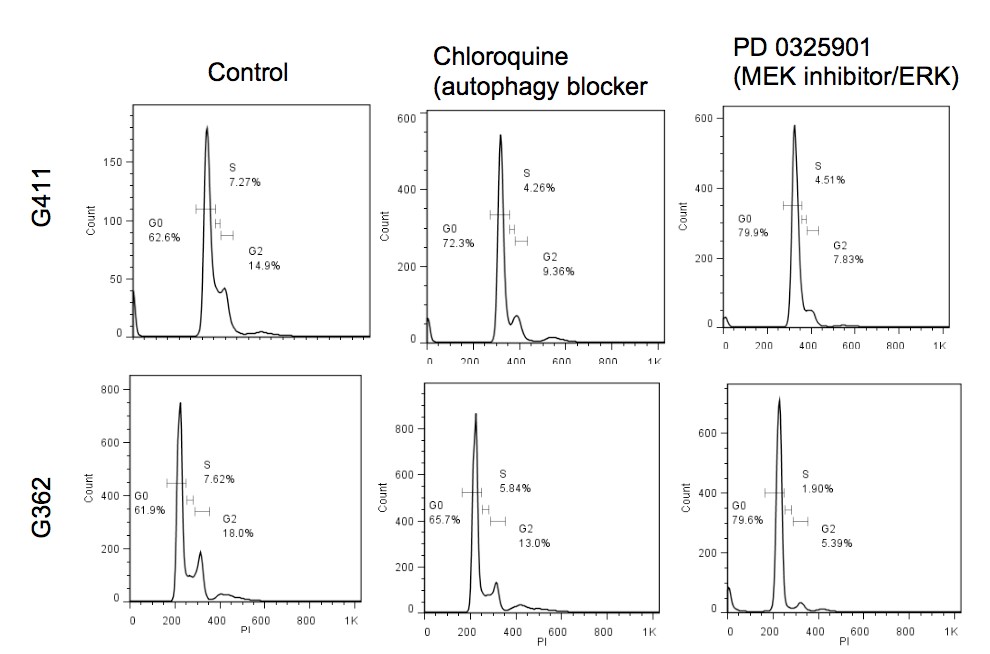
Figure S 3.5. G0/G1 arrest upon DRD antagonism, MEK inhibition and autophagic flux inhibition by chloroquine
Cell cycle flow cytometry analysis of GNS cells (G362 and G411) treated with L-741,742(10 µM) and PNU 96415E (25 µM) at 24h treatment. B. Cell cycle flow cytometry analysis of GNS cells (G362 and G411) treated with Chloroquine (30 µM) and PD 0325901 (1 µM) at 24h treatment. Chapter 4 Directing neural stem cell fate with neurochemical modulators
4.1 Introduction
Neural stem cells (NSC) are multi-potent cells that have the capacity to self renew and differentiate into all major cell types of the CNS namely neurons, astrocytes and oligodendrocytes. In the adult brain, neurogenesis occurs throughout life in the two neurogenic zones (SVZ and SGZ), providing new neurons and glia to maintain brain homeostasis and to respond to disease or injury(Kempermann and Gage, 1999). The neurogenic compartments of the brain are incredibly dynamic and an increasing number of physiologic and disease associated factors regulate NSC proliferation and differentiation(Ming and Song, 2011). Therefore, understanding the biology and regulatory mechanism of NSC and neurogenesis holds a great promise for the treatment of neurodegenerative diseases and understanding many developmental neurological disorders.
Neurochemicals and their receptors aside from their role in synaptic communication are now starting to be appreciated to influence NSC both during development and adult neurogenesis, and they may mediate neuronal activity-related modification of the production of neurons and glia. NSCs express variety of neurochemical receptors and responds to neurochemicals signaling (Berg et al., 2013). Neurochemicals such as dopamine, serotonin and acetylcholine have demonstrated to activate NSC in SVZ region(Freundlieb et al., 2006; Hoglinger et al., 2004; Paez-Gonzalez et al., 2014; Tong et al., 2014). While GABA, the major inhibitory neurochemical, promotes NSC quiescence by blocking cell cycle progression (Fernando et al., 2011), limits NSC division through negative feedback mechanism in SVZ(Liu et al., 2005), and in SGZ, reducing GABA signaling results in NSC activation and symmetrical division (Song et al., 2012).
Small molecule screening is a complimentary approach to genetic screening in probing biological systems to reveal novel genes and pathways. High content screening is a powerful tool to interrogate the potential of small molecules in many parameters simultaneously. This approach is ideal for NSC differentiation screen where we can interrogate proliferation, as well as differentiation into neurons, astrocytes and oligodendrocytes, as well as cell morphology, all parameters in one screen (Figure 4.1). Identification of a compound that can direct NSC fate into specific neuronal lineages will have a great therapeutic impact in treating neurodegenerative disease and understanding many neurological disorders such as Parkinson’s disease, Alzheimer’s disease, and autism.
In chapter 2, I identified ten compounds that showed selective effects towards NS and GNS cells compared to fibroblast that I called as NS selective compounds. Neuromodulation of serotonergic, dopaminergic and cholinergic classes have been implicated in regulating adult neurogenesis. Therefore, I hypothesized that interrogation of neurochemicals in directing NSC fate would identify a number of compounds that would reveal novel NSC regulation that can be exploited for therapeutic purposes.
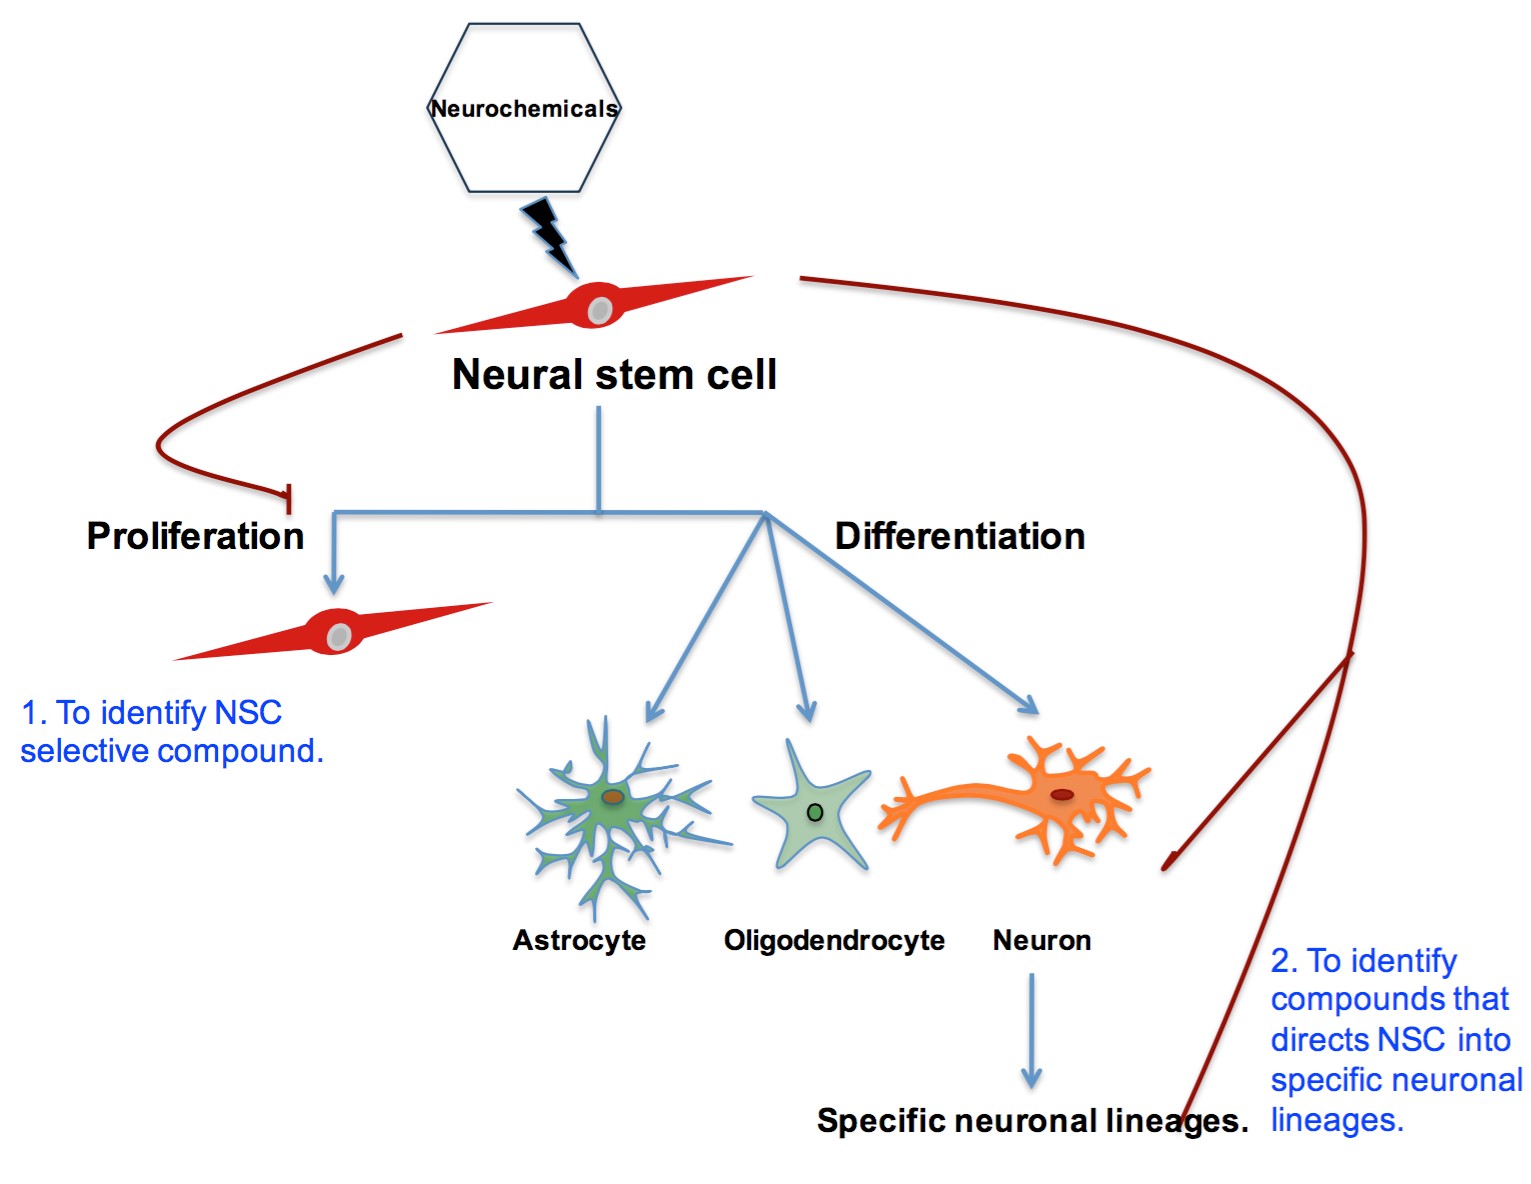
Figure 4.1 Schematic for interrogation of neurochemicals in human NS cells
4.2 Methods
High content screen
Human NS (hf5205) cells were seeded in 384-well black µ clear bottom coated with laminin and poly -L- ornithine(PLO) at a density of 1X10³. The compound library was added at approximately 5µM using Biomek FXP automation workstation with pin tool. Cells were incubated in Step-I medium (N2, B27, 5ng/ml FGF) without EGF for first four days and replaced with step-II medium (1:1 Neurobasal:Neurocult, B27,1/4 N2) without FGF for next four days. At day 8th, cells were fixed with 4% paraformaldehyde (PFA) and blocked with 5% normal goat serum (NGS) and incubated with primary antibody against anti-Beta III tubulin (1:250 MAB1637),, anti-GFAP(1:1000, DAKO) and DAPI for overnight at 4oC. 25 images were taken from different areas of each well by Evotek Opera system and data were analyzed using Acapella software program using average signal intensity with set cut offs using DAPI stain as reference for cells. BMP4 and BIO (GSK3b inhibitor) were used as positive controls for differentiation.
Immunocytochemistry
Human NS cells differentiated on coverslips were fixed with 4% PFA and permeabilized with 0.3% Triton X100, block with 5% goat serum, and incubated with primary antibody over night at 4oC. Antibodies Beta-III tubulin (1:250 MAB1637), GFAP (1:1000, DAKO), VGLUT1(1:1000, Synaptic system) GABA (1:1000, Sigma). Appropriate fluorescent-conjugated secondary antibodies were used at 1:500 for 1h at room temperature. Coverslip mounted with fluorescent mounting medium (DAKO) containing DAPI (1:1000) and cells imaged using Leica microscope.
qPCR
Total RNA from cells was isolated using RNeasy kit (Qiagen) and 1µg of total RNA was used for cDNA generation. Relative abundance of specific mRNA was then assessed using SsoFast Evagreen Supermixes (Bio Rad) run on PTC-200 thermal cycler (Bio Rad). The relative abundance of each gene expression was assessed using the delta-delta-CT method with value normalized to their respective GAPDH levels. The following primers were used for qPCR: CTIP2-F: TCC GAG CCG GTG GAG ATC GG, CTIP2-R: GCA CGG CCC TGC AAT GTT CTC, FOXG1-F: CGG CTC CCT CTA CTG GCC CA, FOXG1-R: ATG GGG TGG CTG GGG TAG GC, VGLUT1-F: GGC CAG ATC GCG GAC TTC CT, VGLUT1-R: CAA CAG CAG CGT GGC TTC CA, NEUROG2-F: ACC ACA AGC AGC TTC GCG TTA, NEUROG2-R: CGG GTC TCG TGT GTT GTG GTG
Single cell qPCR (Fluidigm)
Differentiated human NS (hf5205) at week 3 was accutased and cells were resuspended in NS medium containing 1µg per ml of propidium iodide(PI) and filtered through 40µm nylon cell strainer followed by live single cell sorting into 96 well qPCR plate on BD cell sorter. Cells were sorted into 10µl of preamplification mix containing 40nM of all primers for the 48 genes, and the following components of CellsDirect One-Step qRT-PCR kit(Invitrogen) as directed in protocol: 2X reaction mix, SuperScript III RT/platinum Taq mix. After sorting, samples were reverse transcribed and preamplified for 18 cycles. Preamplified samples were diluted(2X) with TE buffer and stored at -20oC. Sample and assay, primer preparation for Fluidigm Dynamic arrays was done according to the manufacturer’s recommendation. Samples were mixed with 2X assay loading reagent (Fluidigm Corp), 20X EvaGreen and TaqMan gene expression master mix. The Fluidigm Dynamic arrays were primed and loaded on the IFC controller and qPCR experiments were run on a Biomark system for genetic analysis. The primer sequences for Fluidigm experiment are taken from a published paper in Nature Medicine by Dolmetsch RE group (Pasca et al., 2011).
Gene expression profiling
Hf5205 cells were differentiated with 3µM of L-741,742 in two-step growth factor withdrawal protocol and RNA was extracted using RNAeasy kit(Qiagen) for control and treated samples at 3 weeks treatment. RNA extracted from the samples was hybridized on Affymetrix Human Gene 1.0 ST arrays using standard protocol (TCAG, Toronto, Ontario, Canada). RMA background correction, quantile normalization and log2 transformation were applied to the CEL files using the Bioconductor affy package (R 3.0.1, affy package version 1.38.1). Batch correction was applied using ComBat function from sva (3.6.0) and gene annotations were retrieved using hugene10sttranscriptcluster.db (8.0.1). Genes were ranked based on the average log fold change (log FC) of the L-741,742 differentiated human NS and control differentiated cells at 3 weeks.
4.3 Results
4.3.1 Identification of compound that directs NSC fate
Identification of compounds that can direct NSC fate into specific neuronal lineages could have a great therapeutic impact in regenerative medicine, potentially treating many neurologic diseases through improved generation of appropriate cell types. To achieve this goal, I performed a differentiation screen in human NS cells by high content imaging. High content screening is both quantitative and qualitative. I employed it to measure differentiation of human NS into neurons and astrocytes, and proliferation. The default differentiation protocol for NS cells is performed using two-step growth factor (EGF and FGF) withdrawal protocol, where we sequentially remove EGF in the first week and FGF in the second to third week.
This two-step growth withdrawal protocol generates 5-10% early immature neurons and 10-20% astrocytes. I miniaturized the differentiation screen for human NS in an accelerated assay over 8 days in 384 well plates, first four days without EGF and second four days without FGF. Neuronal differentiation was measured by immunostaining with Beta-III tubulin, a pan neuronal marker and astrocytic differentiation by GFAP staining, and proliferation by DAPI. 25 images were taken from different areas in each well by Evotek Opera system and data were analyzed using Acapella script program using average signal intensity with set cut offs (Figure 4.2). BMP4 and BIO (GSK3b inhibitor) were used as a positive control for differentiation.
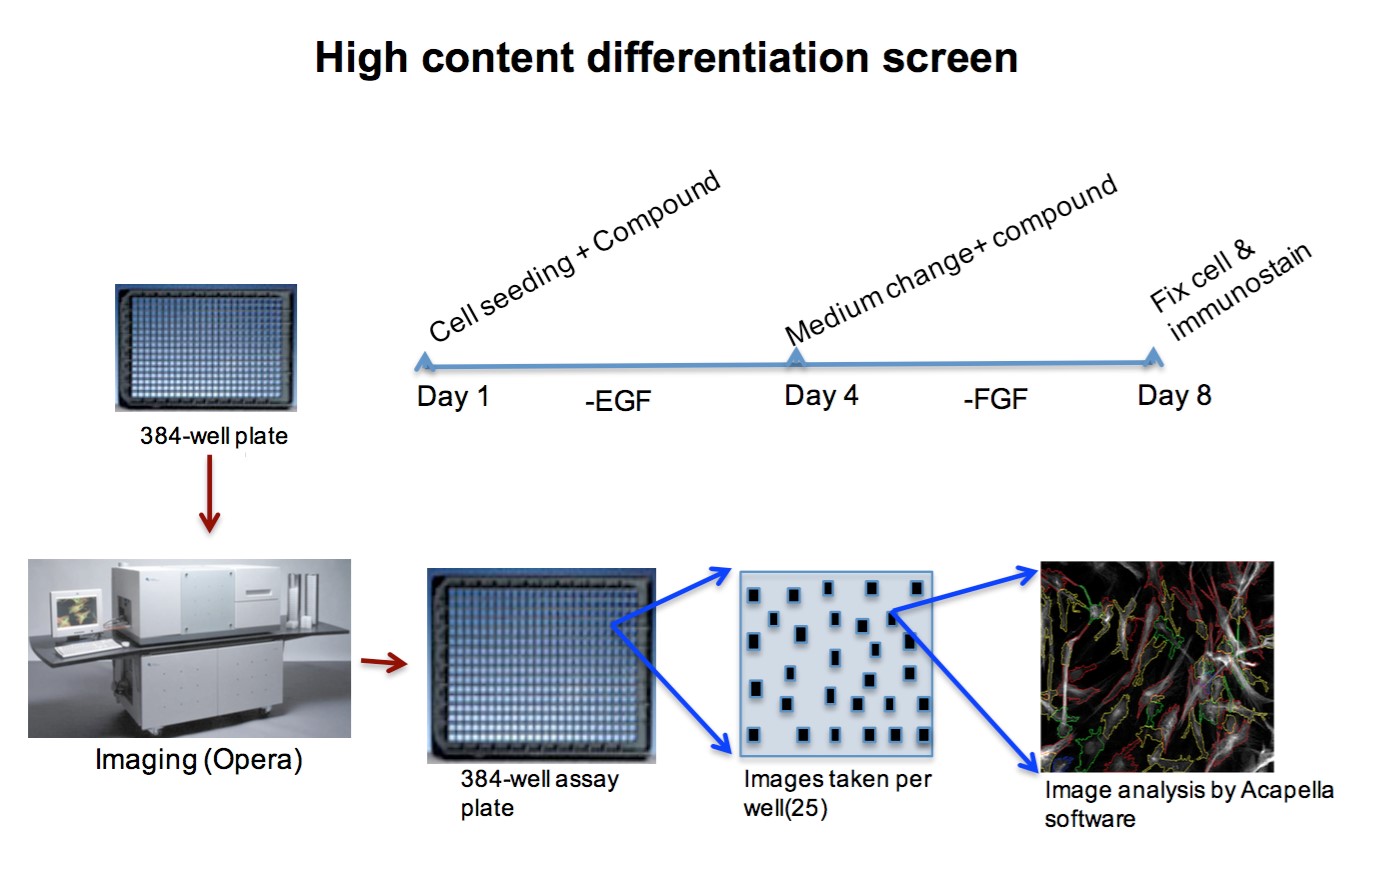
Figure 4.2. An illustration of high content differentiation screen protocol
Based on previous screen from chapter 2, I once again interrogated the neurochemical potential for differentiation in NS cells by high content imaging as described. I tested if neurochemicalmodulating compounds can push NS cells to differentiate in 8 days where a default differentiation protocol takes 2-3 weeks. In this high content differentiation screen, I found 22 compounds that showed increase in beta III tubulin staining compared to control indicating neuronal differentiation and 17 compounds that showed an increase in GFAP staining indicating astrocytic differentiation (Figure 4.3). Since the background for this screen was high, I validated a few of the top hits and confirmed five compounds namely McN A-343, (-)-N- Phenylcarbamoyleseroline, ifenprodil tartrate, L-741,742 and PNU 96415E that promote neuronal differentiation ranging from 12-40% increase when compared to control (2-9%) (Figure 4.4). Three of these compounds ifenprodil tartrate, L-741,742 and PNU 96415E were initially identified as the ten NS selective compounds and showed differentiation potential, which further validated my previous findings.
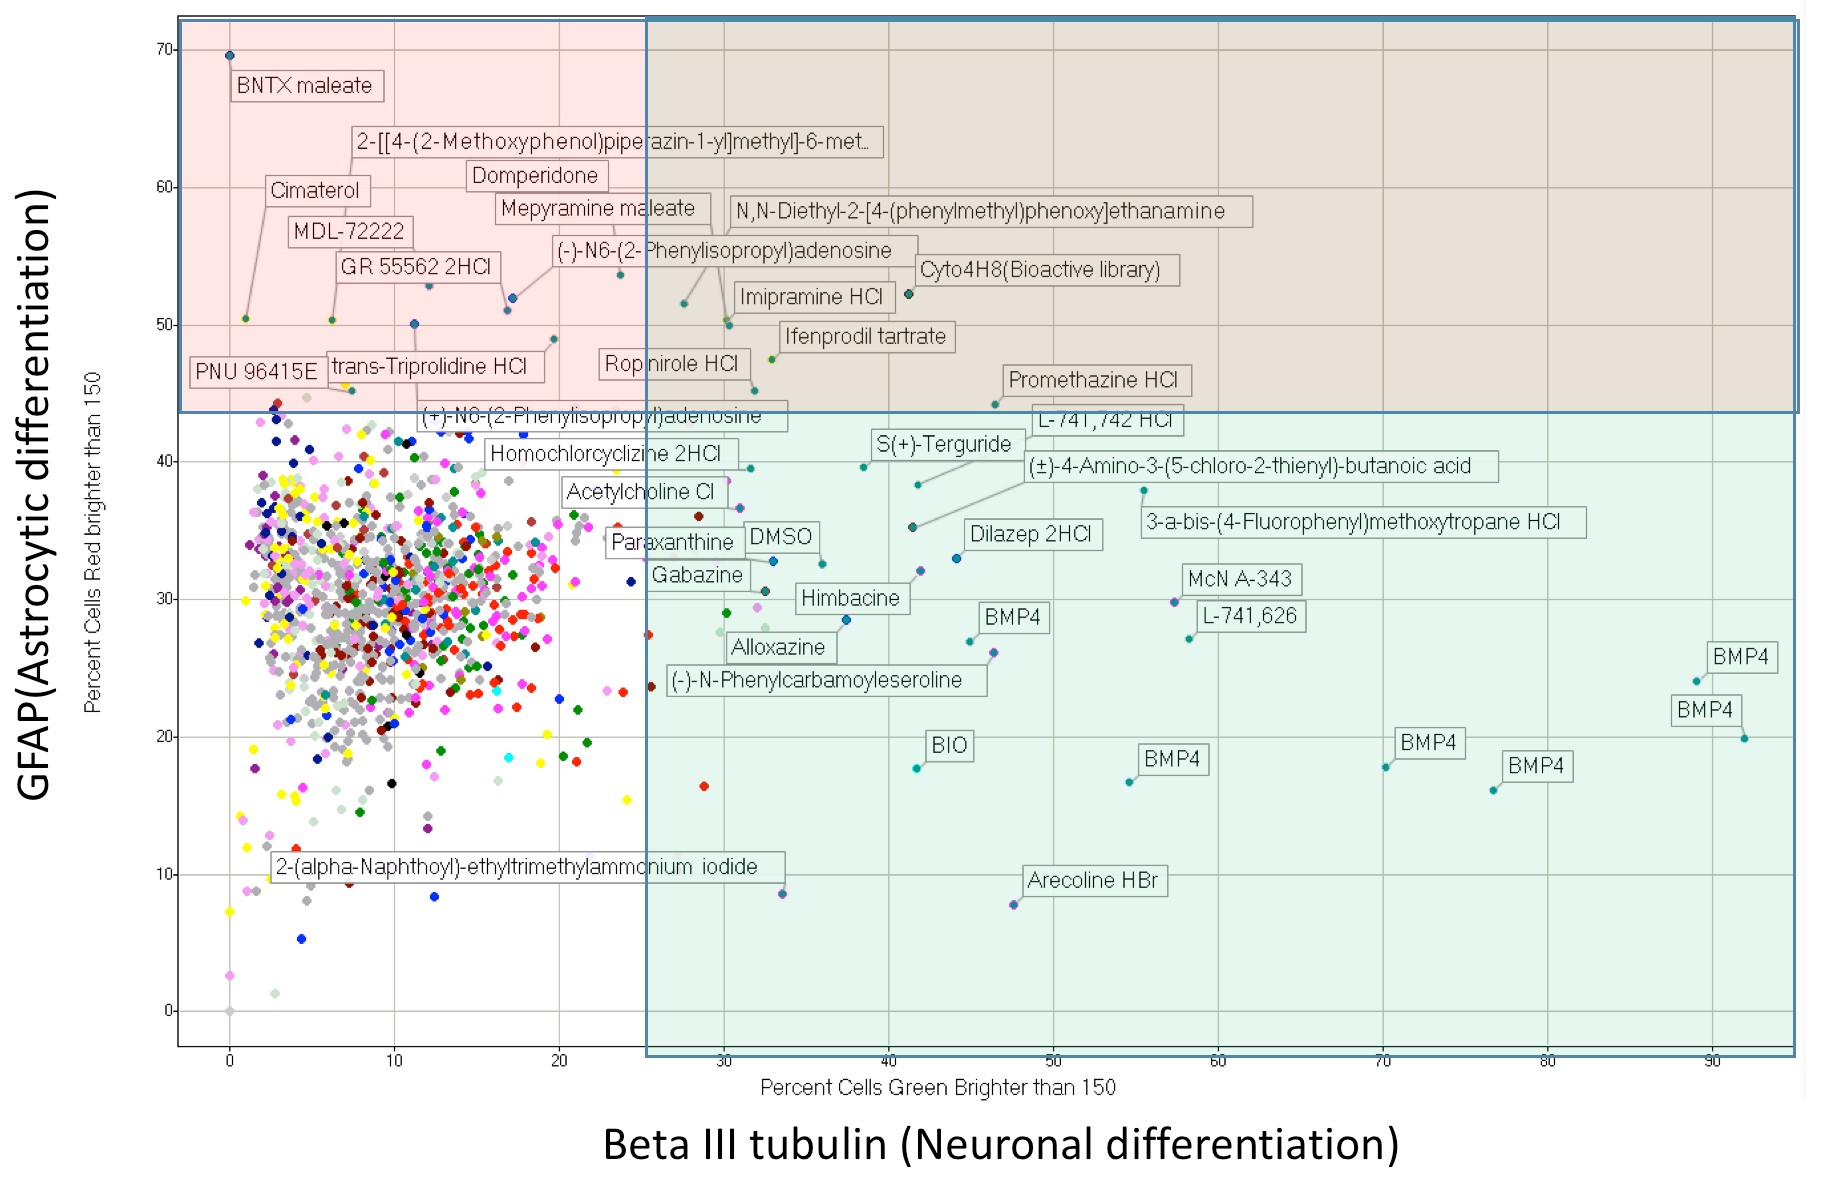
Figure 4.3. Summary of high content differentiation screen data
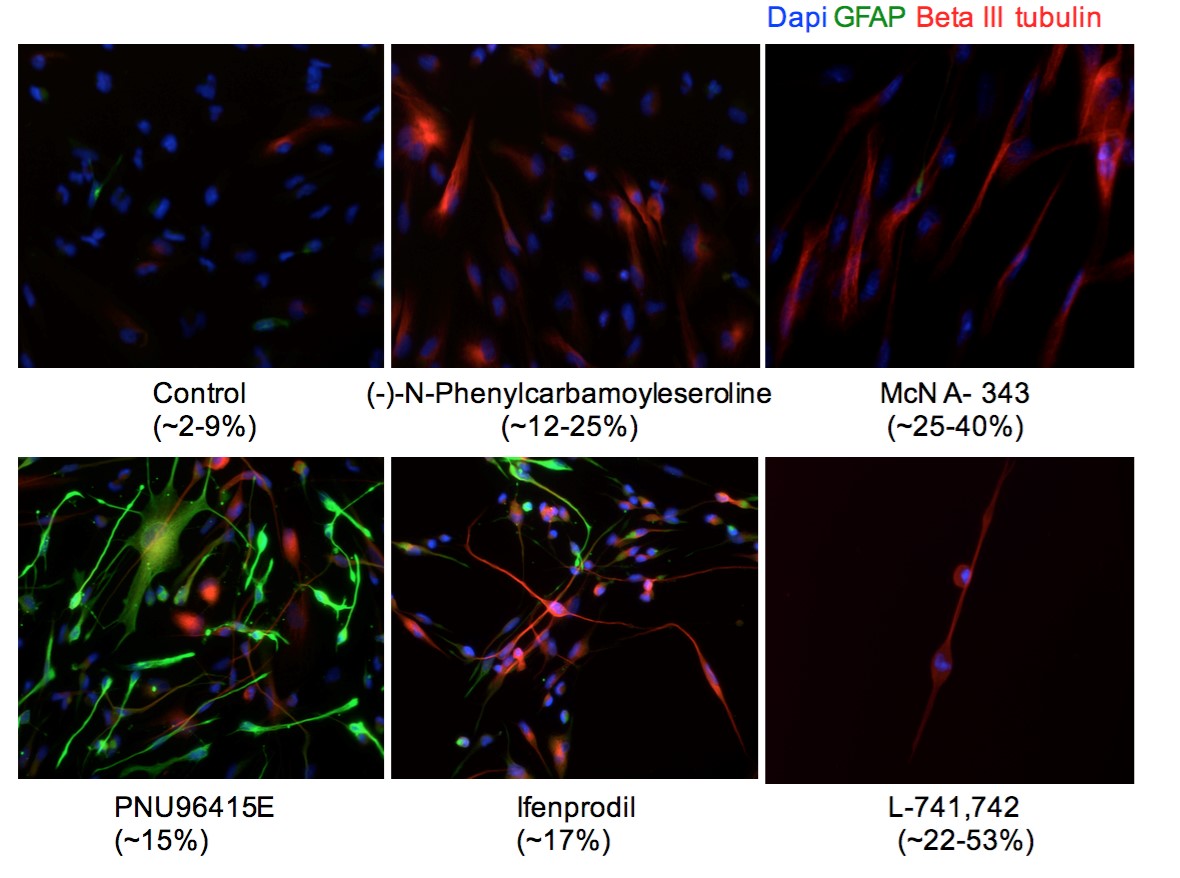
Figure 4.4. Validation of hits that promotes neuronal differentiation in 2-step growth withdrawal condition
4.3.2 Compounds specifying mature neuronal lineages
I next determine if these five validated compounds have the potential to specify specific mature neuronal lineages. I performed immunocytochemistry for a series of antibodies against different classes of mature neurons based on their neurotransmitters including glutamatergic (VGLUT1), dopaminergic(TH), GABAergic(GABA) and cholinergic (AChT, ChAT). Interestingly, three of the compounds L-741,742, PNU 96415E, Ifenprodil tartrate showed positive staining for VGLUT1 indicating glutamatergic neuronal commitment (Figure 4.5 & Table 4.1). VGLUT1 is a vesicular glutamate transporter required for transport of glutamate into synaptic vesicles of glutamatergic neurons.
Two of the hit compounds L-741,742 and PNU 96415E are dopamine D4 receptor antagonists and led to an increase in VGLUT1 positive staining (20-40%) compare to control (0-5%). To confirm DRD4 antagonist potential in promoting glutamatergic neurons, I further tested L-741,742 in two additional human NS lines and showed its potential to promote VGLUT1 positive glutamatergic neurons in other NS cells as well (Figure 4.6A). Additionally, L-741,742 differentiated cells also showed positive staining for GABA indicating GABAergic neurons (Figure 4.6B). I did not see positive staining with any of the other markers tested. Thus L-741,742 promotes neuronal differentiation giving rise to mature neurons of both glutamatergic and GABAergic lineages.
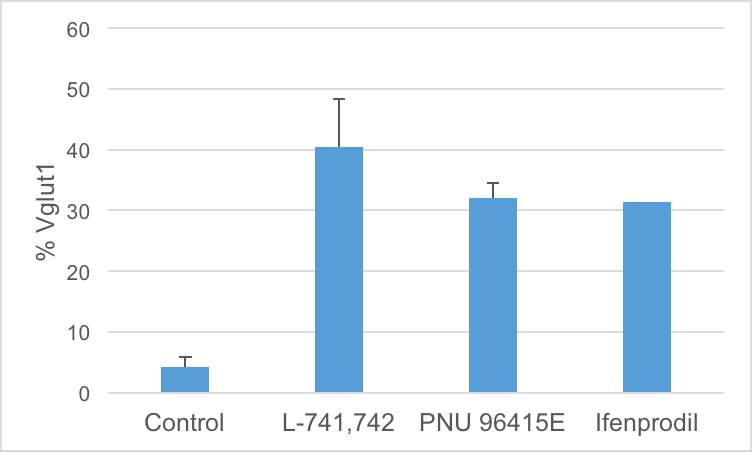
Figure 4.5. Compounds promoting glutamatergic neurons
Percent quantification of VGLUT1 positive in Hf5205 differentiated with L-741,742, PNU 96415E and Ifenprodil.
Table 4.1 Summary of compounds promoting specific neuronal lineages
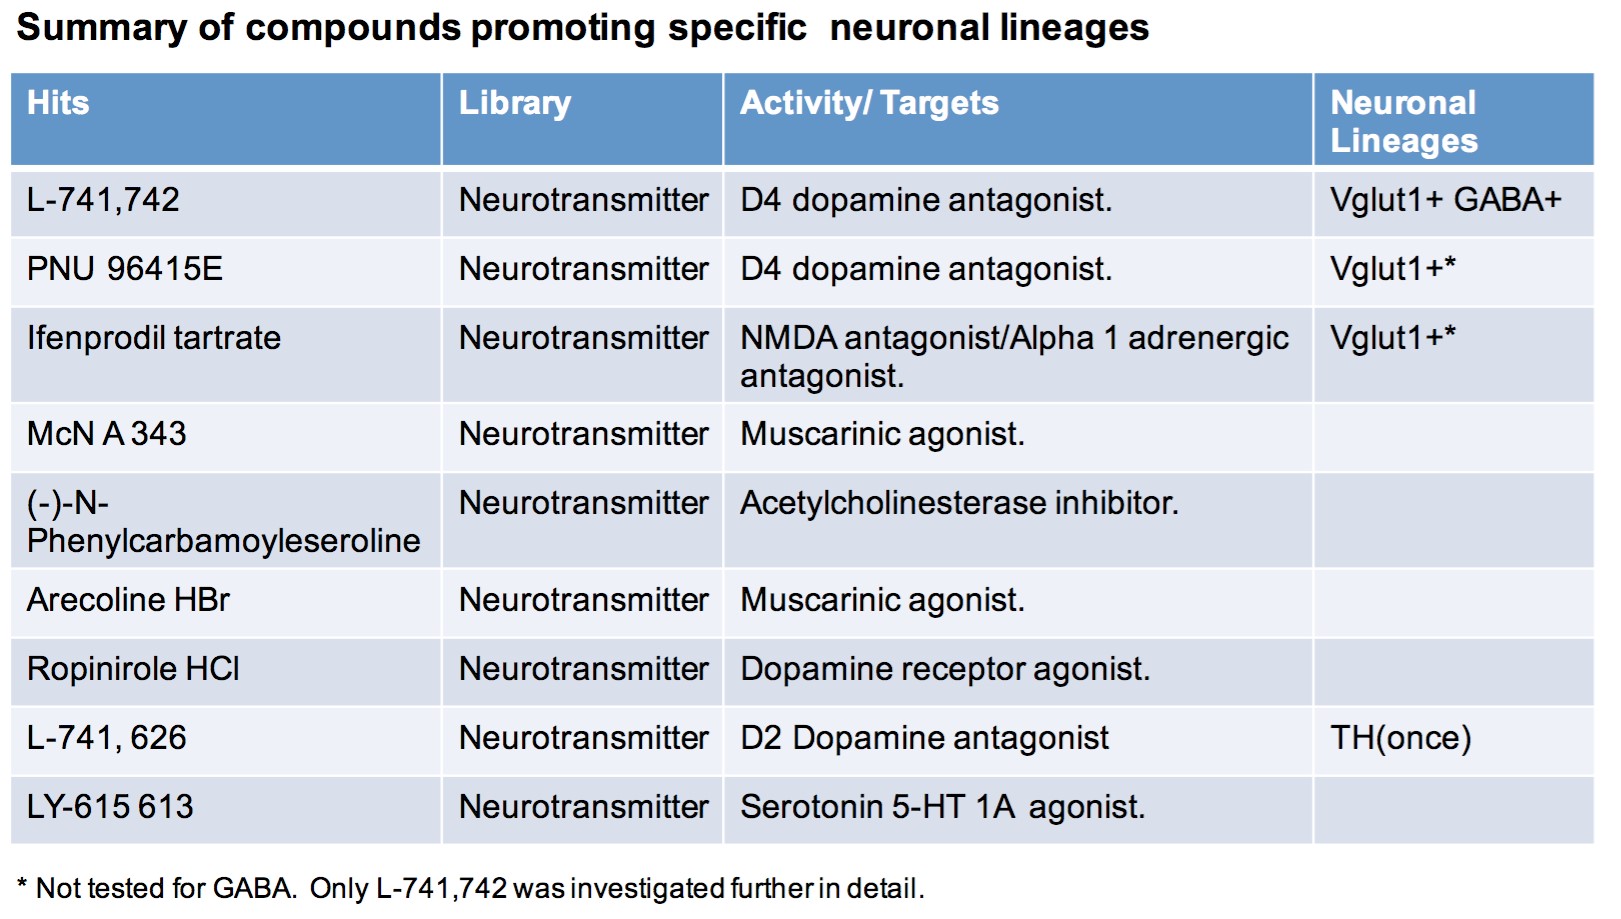
A
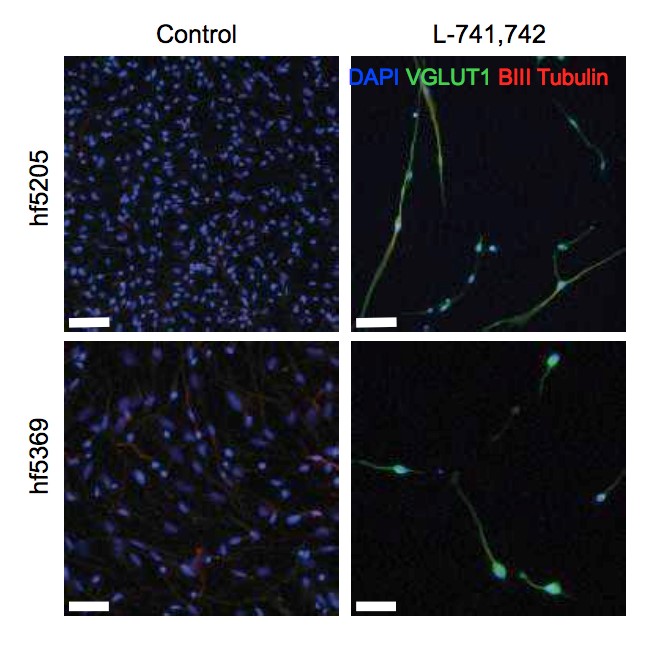
B

Figure 4.6. L-741,742 promotes glutamatergic and GABAergic neurons
- Two different NS cells differentiated with L-741,742 for two weeks and immunostained for VGLUT1 (glutamatergic neuron), Beta III tubulin (pan early neuronal marker) and DAPI. Scale bar-hf5205(100µm) and hf6539(50µm)
- Percent quantification of VGLUT1 and GABA positive neurons in hf5205 differentiated cells with L-741,742 over indicated period of time.
Next, expression of mature neuronal markers was analyzed by qPCR. I designed a series of primers for markers representing both neurotransmitters and domain specific transcription factors to examine neuronal identity by qPCR. The L-741,742 differentiated cells showed around 25fold increase in VGLUT1 expression and 11-fold increase in NEUROG2 expression when compared to the control (Figure 4.7). This further confirms that L-741,742 promotes glutamatergic neurons. NEUROG2 or neurogenin2 is a proneural marker that promotes glutamatergic excitatory neuron in dorsal telencephalic region during cortical development. In cerebral cortex, there are two main types of neurons, projections neuron that are excitatory glutamatergic neuron and interneuron that are inhibitory GABAergic neurons.
During development, NSCs in the ventricular region called radial glial cells undergo asymmetric division to produce self-renewing radial glial cells and neuronal committed daughter cells that differentiate and migrate out to surface past earlier born neurons in “inside out” laminar pattern and sequentially form six layers of cortex. The inhibitory GABAeargic interneurons originate in the ventral telencephalon in median ganglion eminence (MGE), and migrate tangentially into the dorsal telencephalon during cortical development.
A B
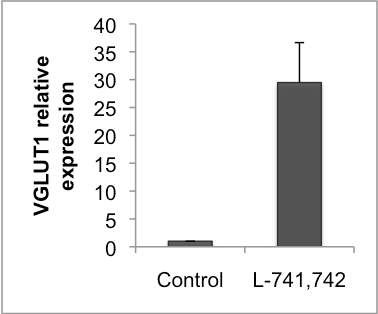
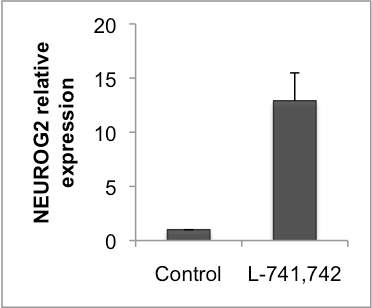
Figure 4.7. L-741,742 differentiated cells showed increased NEUROG2 and VLGUT1 expression
A&B. Relative fold change in the expression of VGLUT1 and NEUROG2 respectively in hf5205 differentiated with L-741,742.
4.3.3 LU741,742 differentiated neurons showed specific excitatory cortical layer V markers
L-741,742 (DRD4 antagonist) differentiated cells showed increase expression of VGLUT1 and NEUROG2. NEUROG2 expression is required to promote excitatory glutamatergic neurons in the dorsal cortical region during development. This finding led to the hypothesis that L-741,742 promotes excitatory glutamatergic neurons. To test this hypothesis, a series of primers were designed marking all layers of cortex; Reelin (layer1), TBR1 (layer V1) CTIP2 (Layer V), SATB2 (Layer II-III) and FOXG1 (telenchepalic marker). I tested the expression of these markers in differentiated cells by qPCR. I observed approximately 19- fold increase in CTIP2 expression and FOXG1 expression in L-741,742 differentiated cells (Figure 4.8). Reelin and TBR1 expression were not detectable at the concentration tested. To summarize, L-741,742 differentiated cells showed positive staining for VGLUT1 and Beta-III tubulin by immunocytochemistry and increase expression of VGLUT1, NEUROG2, CTIP2 and FOXG1 by qPCR. These data strongly suggest that L-741,742 promote cortical layer V neurons.
A B
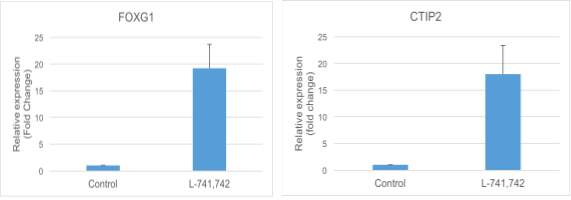
Figure 4.8. L-741,742 differentiated cells showed increased expression of FOXG1 and CTIP2
Relative fold change in the expression of FOXG1 and CTIP2 respectively in hf5205 differentiated with L-741,742. I then characterized the L-741,742 differentiated cells using a single cell fluidigm array that can perform multiple qPCR (48 or 96 genes) at a single cell level. I used 48 gene primers(Pasca et al., 2011) marking various cell populations; early progenitors marking dorsal, ventral or midbrain populations, and differentiated neuronal markers based on neurotransmitters GABA or glutamatergic and markers specifying different cortical layers. Hf5205 was differentiated in default two-step growth factor withdrawal as mentioned above with and without L-741,742 for three weeks.
The differentiated cells were harvested and filtered through 40uM nylon filter and live sorted (based on PI staining) as single cells into a 96 well qPCR plate containing preamplification mix of 48 primers, reverse transcribed and amplified for these genes in one step using a kit from invitrogen. Samples and primer pairs were prepared for fluidigm as per protocol. Cells were identified based on presence of RPS18 and GAPDH. Data was analyzed based on population of cell expressing particular genes using different CT value cut off. The main difference noted between control and L-741,742 differentiated cells was the level of MAP2 (marking neurons) EVT1 (marking lower cortical layer V) and CAMKII and VGLUT1, 2 and 3 (marking glutamatergic neurons) (Figure 4.9A). However, the percentage of cells marking glutamatergic neurons was far lower when compared to immunocytochemistry staining for VGLUT1.
The difference is likely from the live sorting of cells. These VGLUT1 positive cells are very large and were likely to have been excluded from the sort. Possibly the very large glutamatergic cells were excluded from the cell sorting. However, I observed increased expression of MAP2, NCAM neuronal marker and marked difference in ETV1 that defines lower cortical layers V (Figure 4.9B). Finally, I characterized the L-741,742 differentiated NS cells by several different methods including immunocytochemistry, qPCR and single cell fluidigm experiments, and all these test confirmed the presence of glutamatergic neurons with cortical layer V markers in L-741,742 differentiated cells.
A
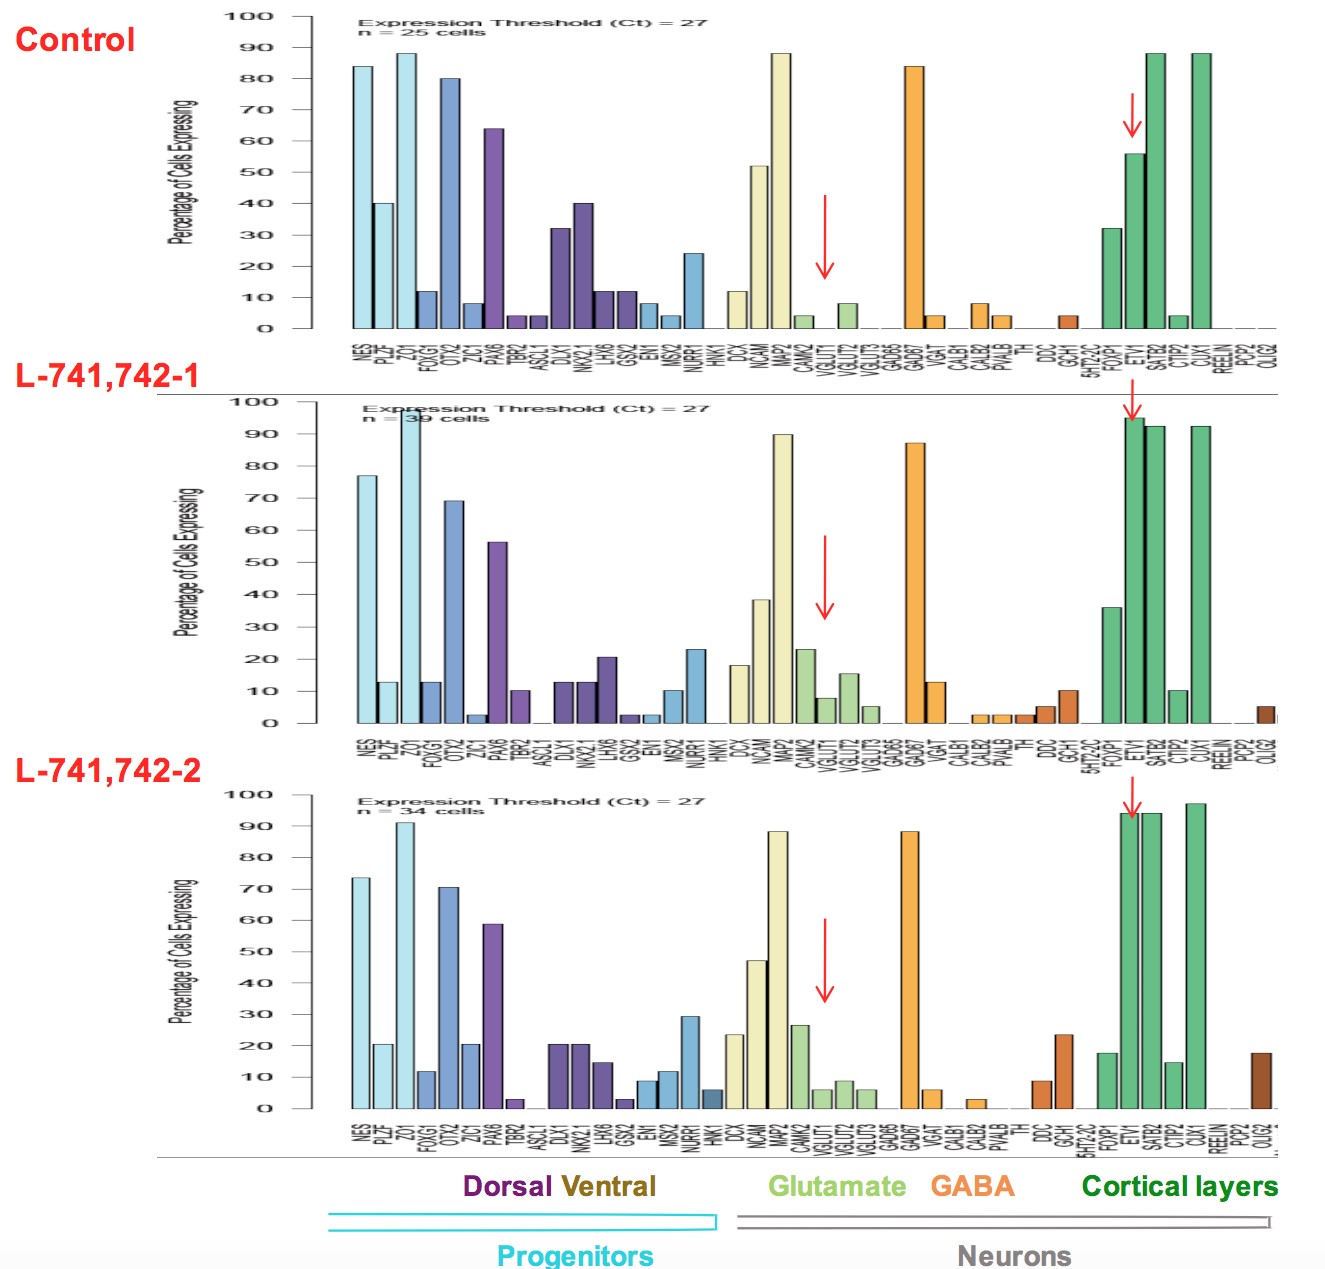
B
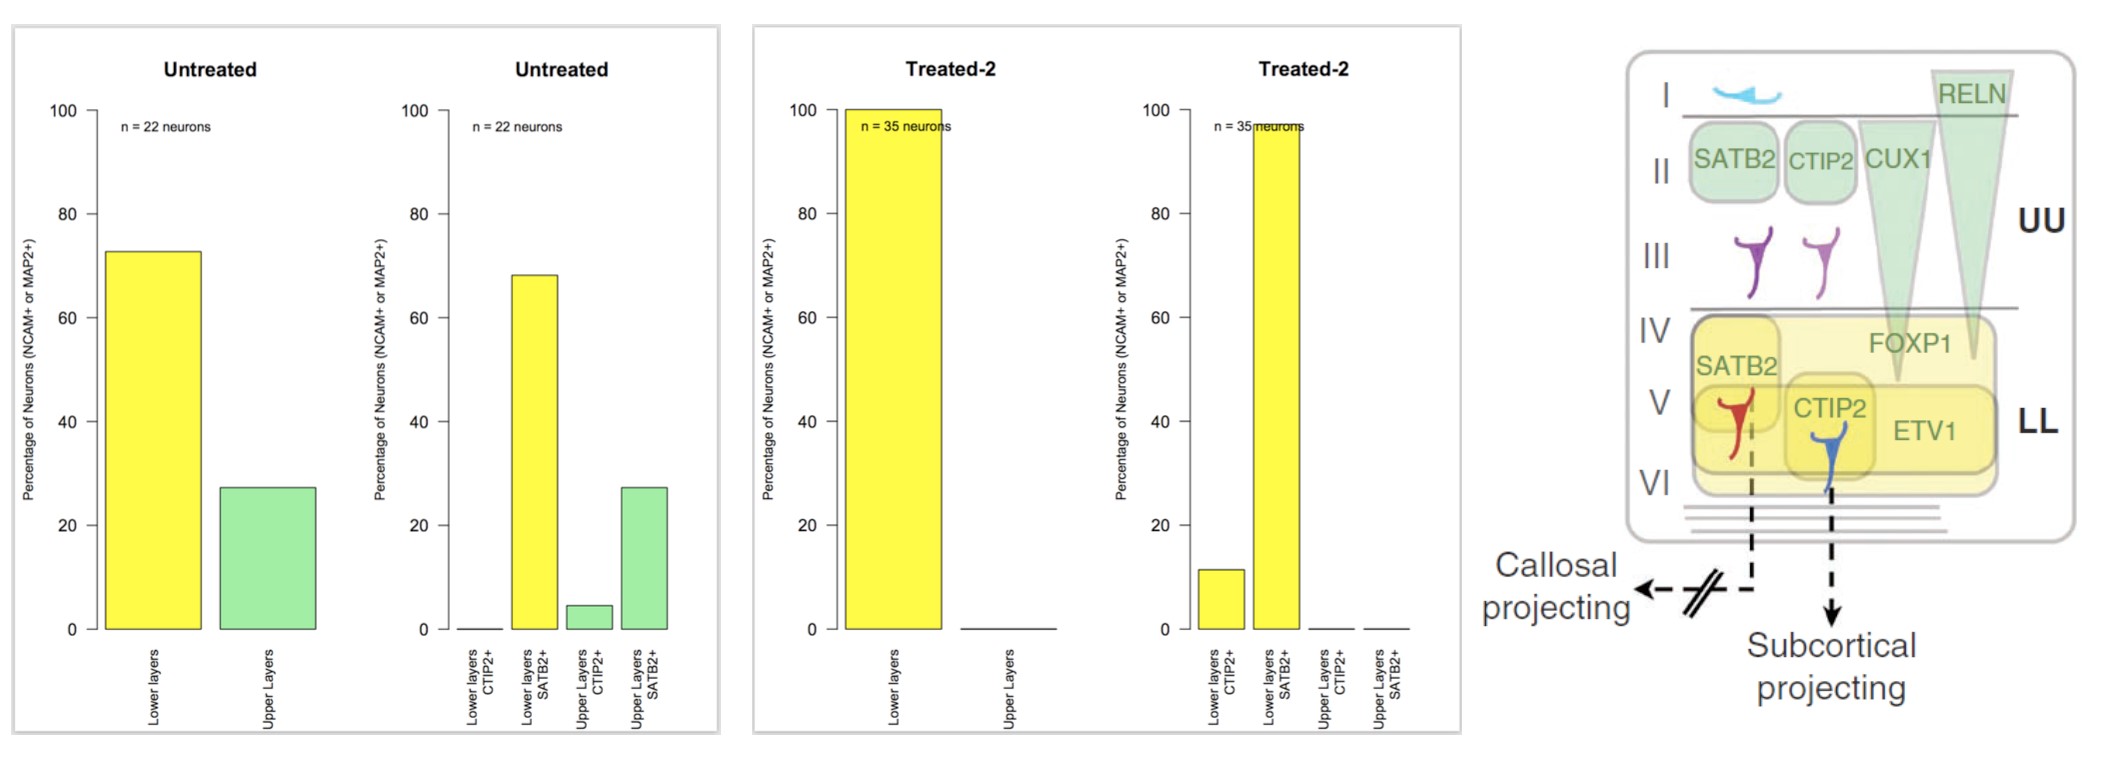
Figure 4.9. Fluidigm analysis on 48 neuronal differentiation marker in L-741,742 differentiated neurons
- Percentage of cells expressing different markers in L-741,742 and control differentiated hf5205 cells.
- Percent of cells marking upper and lower layer cortical markers in L-741,742 and control differentiated hf5205.
4.3.4 Characterization of LU741,742 differentiated cells by gene expression array
To further characterize the L-741,742 differentiated cells in an unbiased way, I performed genome wide expression profiling of L-741,742 differentiated cells. Hf5205 cells were differentiated with L-741,742 in two-step growth factor withdrawal protocol. RNA was extracted for control and treated samples after 3-week treatment. Intriguingly, the most upregulated genes between treated vs. untreated were interferon response genes; MX1, OAS2, DKK1, IFIT1, IFI44L, CRDBP, HERC6, OAS1, OAS3 (Table 4.2). Interferon is a pro-inflammatory cytokine, inhibits proliferation and also reported to enhance neurogenesis from adult and fetal NSC. Further, increase in MAP2 expression (neuronal marker) and decrease in GFAP (astrocytc marker) were noted when compared to the control. However, VGLUT1 gene was not the highest expressed gene compared to control although few probes were up regulated. This may be because microarray is not sensitive as qPCR and the data was derived from a different batch of differentiated cells. Interestingly, DKK1 gene was upregulated in L-741742 differentiated NS cells (Figure 4.10), where in GNS cells it was one of the top hit downregulated (chapter 3).
Table 4.2. List of genes upregulated (>5 fold) and downregulated (<-5 fold) in L-741,742 differentiated NS cells compared to control at 3 weeks
| Genes upregulated (>5) | Genes downregulated (<-5) | ||
| Gene symbol | Fold change | Gene symbol | Fold change |
| MX1 | 12.8 | ACTC1 | -29.7 |
| OAS2 | 10.8 | ITGA11 | -21.7 |
| DKK1 | 10.0 | PLXDC2 | -16.5 |
| IFIT1 | 9.6 | COMP | -15.9 |
| IFI44L | 9.2 | KIAA1199 | -15.5 |
| CRHBP | 8.5 | BGN | -14.8 |
| HERC6 | 8.0 | GFRA2 | -13.6 |
| OAS1 | 7.5 | PLN | -13.5 |
| PBK | 7.5 | C4orf26 | -13.2 |
| KIF20A | 7.2 | ASS1 | -12.6 |
| ESCO2 | 7.2 | ACTA1 | -12.2 |
| RRM2 | 7.0 | AK4 | -11.9 |
| NUSAP1 | 7.0 | FST | -11.0 |
| SILV | 6.8 | RASL11B | -10.4 |
| MKI67 | 6.7 | MYH11 | -9.9 |
| HIST1H1B | 6.6 | PAMR1 | -9.9 |
| BST2 | 6.5 | DYSF | -9.1 |
| TOP2A | 6.3 | SERPINA3 | -9.0 |
| OAS3 | 6.3 | C4orf31 | -8.9 |
| P2RX7 | 6.3 | CRISPLD2 | -8.0 |
| NCAPG | 6.2 | TSPAN2 | -7.9 |
| HIST1H3B | 6.1 | ABCA1 | -7.8 |
| DLGAP5 | 6.1 | ADAMTS16 | -7.6 |
| IFI44 | 6.1 | C20orf103 | -7.5 |
| IFIH1 | 6.0 | IGFL3 | -7.4 |
| FAM111B | 5.9 | LMOD1 | -7.4 |
| BUB1B | 5.9 | GREM1 | -6.9 |
| SGOL1 | 5.8 | LIX1 | -6.7 |
| USP18 | 5.8 | KAL1 | -6.7 |
| DEPDC1 | 5.8 | FLG | -6.0 |
| CDK1 | 5.8 | TMEM45A | -6.0 |
| CDC20 | 5.8 | C5orf46 | -5.9 |
| IFITM1 | 5.7 | FBLN5 | -5.8 |
| ASPM | 5.7 | FAM13C | -5.6 |
| SKA3 | 5.6 | COL1A2 | -5.6 |
| HIST1H2BM | 5.6 | FN1 | -5.6 |
| KIF11 | 5.5 | NKAIN4 | -5.5 |
| KIAA0101 | 5.5 | HSD17B6 | -5.4 |
| CKAP2L | 5.4 | SCUBE3 | -5.4 |
| CEP55 | 5.4 | MSC | -5.4 |
| CCNE2 | 5.3 | C21orf62 | -5.4 |
| CENPE | 5.3 | SYNPO2 | -5.3 |
| FOXM1 | 5.2 | SERTAD4 | -5.2 |
| CENPA | 5.2 | CLDN6 | -5.1 |
| ACAT2 | 5.1 | ASPN | -5.1 |
| NUF2 | 5.1 | LOC402778 | -5.0 |
| ENPP5 | 5.1 | ||
| KIF15 | 5.1 | ||
| IFIT3 | 5.1 | ||
| PLK1 | 5.1 | ||
| ASF1B | 5.0 |
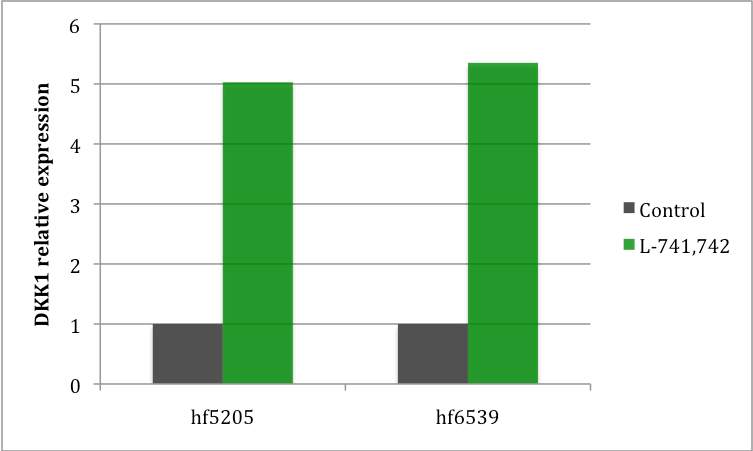
Figure 4.10. DKK1 upregulated in L-741,742 differentiatd cells
Relative fold change in the expresion of DKK1 in L-741,742 differeniated NS cells compared to control.
4.4 Discussion
I interrogated 680 neurochemical compounds on human normal and neoplastic NS cells by two different screening approaches (Chapter 2 and 4). In both approaches, DRD4 antagonist PNU 96415E and L-741,742 were identified as the best hits. Both these compounds showed selective killing towards GNS cells when compared to NS cells. In NS cells, they promote neuronal differentiation towards mature lineages. Both GNS and NS cell lines expresses DRD4 at protein level. However, there is no clear difference in the amount of DRD4 expression between GNS and NS cells. This suggests that the sensitivity of GNS toward DRD4 antagonist may not be at the level of receptor expression but may be downstream of its pathway or how the cells respond to it when disrupted.
Based on these observations I can hypothesize that when DRD4 is inhibited with L-741,742 and PNU 96415E, NS cells differentiate while GNS cells fail to differentiate and undergo cell death. In this chapter I showed five compounds; McN A-343, (-)-N-Phenylcarbamoyleseroline, ifenprodil tartrate, L-741,742 and PNU 96415E that promote neuronal differentiation. Three out of five hits, L-741,742, PNU 96415E and ifenprodil tartrate, were also the ten NS selective compound as shown in chapter 2. These three compounds can induce mature neuronal lineage expressing VGLUT1. I further characterized the L-741,742 differentiated human NS by immunocytochemistry, qPCR and fluidigm at a single cell level. L-741,742 differentiated cells showed VGLUT1 positive cells with an increase in CTIP2 (layer V marker), FOXG1 and NEUROG2 expression. This data was further corroborated by fluidigm analysis at single cell level showing increase in ETV1 marking lower cortical layer marker V, and CAMKII, VGLUT1, VGLUT2 and VGLUT3 marking glutamatergic neurons. Intriguingly, dopamine receptors themselves are present mostly in the layer V neurons in primate cerebral cortex (Lidow et al., 1998).
As L-741,742 is a highly specific DRD4 antagonist, it’s likely that L-741,742 is mediating the differentiation potential through inhibiting DRD4. Additionally, two of the three compounds (L741,742 and PNU 96415E) that showed VGLUT1 positive staining are DRD4 antagonist. All these data suggest a plausible role of DRD4 in regulating neural stem cell, and in particular, in favoring specific neuronal lineages. It should not go unnoticed that an ability to more efficiently specify layer V projection neurons may have applications to neural repair in response to neural injury or neural degeneration. In addition to serving neurotransmitter signaling functions, dopamine also has been implicated in the regulation of neural stem cells during brain development and adult neurogenesis(Baker et al., 2004; Diaz et al., 1997; Hoglinger et al., 2004; Ohtani et al., 2003).
There are five dopamine receptors D1 and D5 (D1 like receptor), and D2, D3 and D4 (D2 Like receptor). DRD3 and DRD4 receptor are most differentially expressed gene during brain development in mouse. DRD4 expression peaks at E15 and decreases postnatal after P0(Araki et al., 2007). This strongly indicates that DRD4 has a role in early forebrain development. Furthermore, in post-mortem brains of Parkinson’s patients, a disease characterized by depletion of dopamine, a reduction of proliferating cells in the SVZ has been observed(Borta and Hoglinger, 2007; Hoglinger et al., 2004).
Also, retrospective clinical studies on patients with various neuropsychiatric disorders, who are treated with similar compounds, have observed decreased incidence of brain tumors(Diamandis et al., 2009; Lalonde and Myslobodsky, 2003), suggesting potentially that depletion of neural precursor pools may have influence on tumor emergence. In agreement with all these previous findings, this thesis further suggested the importance of dopamine and DRD4 for the growth of neural stem cell and GBM stem cells. Chapter 5 Conclusions and future directions
5.1 Conclusions
Neurochemicals, which form a component of the rich extracellular milieu of brain in which brain tumors such as GBM arise, are now becoming recognized to play an important role in normal neurogenesis aside from its functions in synaptic communication between mature neurons. However, the neurochemical space and its influence on the growth and survival of GBM stem cells have not been explored. There has been large number of agonists and antagonists developed against various neurochemical signaling pathways to treat a broad spectrum of human diseases, and which are intrinsically selected to access CNS. Here, in this thesis, I systematically interrogated all classes of neurochemicals in GNS and NS cells using small molecule by two different screening approaches.
First, I screened the neurochemical library containing 680 compounds in a series of patient derived GNS cells, human NS cells and fibroblast to identify selective compounds for NS and GNS cells. Second, I screened the neurochemical library in human NS cells by high content screen to identify compounds with differentiation potential. Interestingly, in both these screens, DRD4 antagonists (L-741,742 and PNU 96415E) were identified as hits, in which there was selectivity in killing GNS cells and inducing mature neuronal differentiation in normal NS cells. In the first screening approach, carried out to identify GNS selective compounds, I found that modulation of dopaminergic, serotonergic and cholinergic pathways predominantly affected GNS cells. Each of these neurochemical classes have been previously implicated in regulating NS cells during brain development and adult neurogenesis (Diaz et al., 1997; Hoglinger et al., 2004; Mohapel et al., 2005; Tong et al., 2014; Whitaker-Azmitia, 1991).
I also noted compounds modulating sigma receptors have particularly high activity in the screen and interestingly, sigma receptors have relatively highest expression amongst other neurochemical receptors in GNS lines suggesting sigma receptors could potentially influence GNS growth. I identified ten compounds that showed selectivity towards GNS and NS cells compared to fibroblasts. In particular, the two DRD4 specific antagonists L-741,742 and PNU 96415E selectively inhibit the growth of GNS cells and reduce the colony forming potential of freshly dissociated GBM cells, both in vitro and in an in vivo patient-derived xenograft model. Dopamine is a catecholamine synthesized by neurons predominantly in the midbrain region but have diffuse cortical projections. Little is known about how modification of dopamine signaling can affect brain tumor stem cell behavior.
In this thesis, I demonstrated an important role for dopamine-DRD4 signaling in the growth and survival of GNS cells mediated through modulating the autophagy-lysosomal system. The primary screen also uncovered a number of DRD2 specific antagonists (thioridazine, trifluoperazine) as hits. Consistently, a recent genome wide shRNA screen in a GBM cell line (U87MG) identified a role for DRD2 in GBM growth(Li et al., 2014). However, DRD4 antagonists showed better selectivity for GNS cells in my screen compared to DRD2 antagonists. Mutations in DRD5 and DRD3 genes are also reported in a small fraction of GBM samples (Brennan et al., 2013).
Furthermore, The Cancer Genome Atlas (TCGA) data on GBM gene expression showed that patients expressing highest DRD4 level have shorter survival than those patients expressing lowest DRD4 level. A similar survival pattern was seen with TH (tyrosine hydroxylase) expression, the rate-limiting enzyme for dopamine synthesis. Additionally, dopamine receptor antagonists may have activity against other cancer stem cell types, including in leukemia (Sachlos et al., 2012) and lung cancer (Yeh et al., 2012).
In conjunction with my findings, these studies suggest that dopamine receptor antagonists will prove to be useful probes for the study of GBM growth and survival, and potentially other cancer types. The autophagy-lysosomal degradation pathway system appears to be critical for the progression and/or maintenance of many cancer types (Kenific and Debnath, 2014). For example, autophagy is important for breast cancer stem cell maintenance (Choi et al., 2014; Gong et al., 2013). In pancreatic cancer stem cells, blocking autophagy reduces its activity and potentiates tumoricidal effect of gemcitabine (Yang et al., 2015). In a number of cancer studies, including for GBM, autophagy inhibition with chloroquine appears to augment the efficacy of anticancer therapies (Sotelo et al., 2006).
In this thesis, my data also suggests that autophagy plays an essential role in GNS cell growth and survival, and that dopamine signaling through the DRD4 receptor is required to maintain the autophagy-lysosomal degradation system. I have shown that GNS cells are vulnerable to disruption of this pathway compared to human fibroblasts and NS cells. I hypothesize that potential differences in the basal activity and dependence of GNS cells on autophagy-lysosomal pathway compared to normal NS cells and fibroblasts may account for the susceptibility of GNS cells to DRD4 antagonists.
Consistently, it has recently been reported that GBM cells are sensitive to vacuolization agent vacquinols (Kitambi et al., 2014) and a breast cancer stem cell selective compound salinomycin confers selectivity through inhibiting autophagic flux (Yue et al., 2013). Thus identification of DRD4 antagonists as GBM selective compounds revealed the autophagy-lysosomal system as a vulnerable and important system for GBM cell survival and maintenance, and modulation of dopamine DRD4 signaling may be of therapeutic benefit in GBM patients. Intriguingly, a very recent study suggested modulation of autophagy by combination of two antidepressents drug (imipramine and ticlopidine) may effect lower grade GBM (Shchors et al., 2015). Impairment of the autophagy-lysosomal pathway is also intimately associated with neurodegenerative diseases in which neurochemical signaling is dysregulated, including Parkinson’s Disease, Alzheimer’s Disease and Niemann-Pick Type C1 disease (Nixon, 2013; Sarkar et al., 2013). Autophagy has been implicated in the maintenance of adult NSCs (Wang et al., 2013; Yazdankhah et al., 2014) and suppression of autophagy in NSCs during development in mice causes neurodegenerative diseases (Hara et al., 2006).
This thesis suggests new insights into the role of DRD4 signaling in neurological disorders such as ADHD, bipolar disorder and schizophrenia, which are reported to be associated with DRD4 polymorphism (LaHoste et al., 1996; Rondou et al., 2010). As I have shown in GBM, impaired DRD4 function in these neurological diseases may disrupt autophagic flux by a similar mechanism. In the high content differentiation screen, I identified five compounds that promote neuronal differentiation and two of these compounds were also the same DRD4 antagonist (PNU 96415E and L-741,742). I further characterized the L-741,742 differentiated NS cells for the presence of different mature neuronal marker though immunocytochemistry, qPCR and Fluidigm. L-741,742 differentiated cells showed VGLUT1 positive cells with an increase in CTIP2 (layer V marker), FOXG1 and NEUROG2 expression.
This data was further corroborated by fluidigm analysis at single cell level showing increase in ETV1 marking upper deep layer marker V, and CAMKII, VGLUT1, VGLUT2 and VGLUT3 marking glutamatergic neurons. Intriguingly, layer V neurons in the primate cerebral cortex showed the highest expression of dopamine receptors(Lidow et al., 1998). All these data suggest a plausible role of DRD4 in regulating normal NS cell fate. In addition to serving neurotransmitter function, dopamine also has been implicated in the regulation of NSCs during brain development and adult neurogenesis. DRD3 and DRD4 are the most differentially expressed gene during brain development in mouse. DRD4 expression peaks at E15 and decreases postnatal after P0(Araki et al., 2007). This strongly indicates that DRD4 has a role in early forebrain development. Furthermore, in post-mortem brains of Parkinson’s patients, a disease characterized by depletion of dopamine, a reduction of proliferating cells in the SVZ has been observed.
Also, retrospective clinical studies on patients with various neuropsychiatric disorders, who are treated with similar compounds, have observed decreased incidence of brain tumors, suggesting potentially that depletion of neural precursor pools may have influence on tumor emergence. In agreement with all these previous findings, my data further suggested the importance of dopamine and DRD4 for the growth of normal NS and GNS cells. Both GNS and NS cell lines express DRD4 at mRNA and protein level. However, there is no clear difference in the amount of DRD4 expression between GNS and NS. This suggests that the sensitivity of GNS toward DRD4 antagonist may not be at the level of receptor expression but may be due to how the cells respond to it when the receptor is disrupted.
Based on these observations I hypothesize that DRD4 when inhibited with L-741,742 and PNU 96415E, modulates autophagy-lysosomal pathway where NS cells differentiate while GNS cells are more vulnerable, fails to differentiate and undergo cell death. Finally, further investigation of the link between DRD4 signaling, autophagy impairment and cell survival in neurodegenerative diseases, cognitive brain disorders and GBM is warranted. In particular, further exploration of the role of neurochemical signaling pathways specifically dopaminergics, serotonergics and cholinergics pathways in GBM may yield novel therapeutic approaches to treat this intractable disease.
5.2 Future Directions
5.2.1.To determine the in'vivo effect of dopamine and dopamine receptors in GBM
This thesis showed dopaminergic pathway as an important factor for GNS growth and survival but I focused mainly on the dopamine D4 receptor and its antagonism. I did not study the dependency of dopamine and the role of other dopamine receptors including D1, D2, D3 & D5 in GBM growth, nor the other interesting hits modulating cholinergic and serotonergic pathways. Probing the dependency of dopamine in GBM growth in vivo will determine whether it is an essential growth and survival factor.
There are many approaches to manipulate the dopamine level in CNS and the easiest approach is to manipulate dopamine level using pharmacological drugs, which are used clinically for neurological or psychiatric disorders. Dopamine level can be increased by preventing its uptake by dopamine transporter (DAT) or by blocking enzymes involved in degradation of dopamine such as catechol-O-methyl transferase (COMT) by using methylphenidate and tolcapone respectively. There are also a large number of dopamine agonists that have been developed to treat Parkinson’s disease such as bromocriptine (D2 agonist) and Pramipexole (D2/D4 agonists). Alternatively, we can decrease the dopamine level by using antagonists that inhibits dopamine synthesis such as tyrosine hydroxylase (TH). TH inhibitor, metirosine reduces catecholamine production and clinical symptoms in patients with pheochromocytoma and schizophrenia. Dopamine level or signaling can also be inhibited using combination of dopamine receptors such as of D2/D3/D4 receptor antagonists.
Using these agonist and antagonists for dopamine levels, we can determine if dopamine levels affects GBM xenograft growth and survival. It is easy to manipulate by pharmacological drug but it has drawbacks due to lack of selectivity and non-specific effects. An alternative approach to modulate dopamine level is to ablate TH dopaminergic neurons in the ventral tegmental area (VTA) with an injection of the specific neurotoxin 6-hydroxydopamine (6-OHDA) that will deplete dopamine, and alternately we can also cross NSG mice with a DAT null mice, or make conditional ablation strategies for VTA TH cells. A more exciting approach to manipulate dopamine level in vivo is by using optogenetics (Deisseroth et al., 2006; Fenno et al., 2011), which transformed research in neuroscience and has many advantages over above pharmacological approaches. This technique allows integration of optics and genetics to perform gain or loss of function studies in precise neuronal cell population within a live animal. By turning on a light at particular frequency in a particular location, specific neurons and their axons can be activated or inhibited, allowing precise manipulation of in vivo physiology.
Microbial light sensitive opsin genes are first introduced into specific cell types in brain and then subject to optical control, specific light frequency can depolarize or activate neurons via opening a cation channel (channelrhodopsin-ChR2, blue light) or hyperpolarize or inhibit neurons via activation of chloride pump (halorhodopsin-NpHR, yellow light). Dopamine output to the cortex is derived from dopaminergic neurons from VTA that express TH. So, TH VTA can be manipulated to create clinical model of dopamine deficiency or enhancement in vivo. So, optogenetic modification of endogenous dopamine in the brain tumor microenvironment will allow us to test whether dopamine levels alter human GBM growth in vivo. Additionally, manipulating TH will not only affect dopamine level but also affect other catecholamines epinephrine and nor epinephrine levels, which are known to play an important role in cancer. Thus we could monitor effects of all catecholamines on GBM growth through one model. Other dopamine receptor D2-like receptor (D2, D3) and D1-like (D1&D5) receptors were not studied in my thesis.
Since there were several recent studies on role of D2 receptors in other cancers (Sachlos et al., 2012; Yeh et al., 2012), it would be interesting to examine all the dopamine receptors in GBM(Li et al., 2014). Moreover, when I looked at the gene expression array across our different GNS lines, D2 receptor is most differentially expressed between the GNS cell lines, D4 and D5 are expressed uniformly across while D1 and D3 are under expressed or down regulated (Figure 5.1). Interestingly, DAT, a dopamine transporter, which removes dopamine from synaptic cleft, is underrepresented or downregulated while COMT (Catechol-O methyltransferase), which degrades catecholamines, is overexpressed. Based on my thesis, and the literature available on role of dopamine receptors in normal neurogenesis and D2 receptor in cancer, investigation of the whole dopamine system and its receptors may reveal more exciting insights.
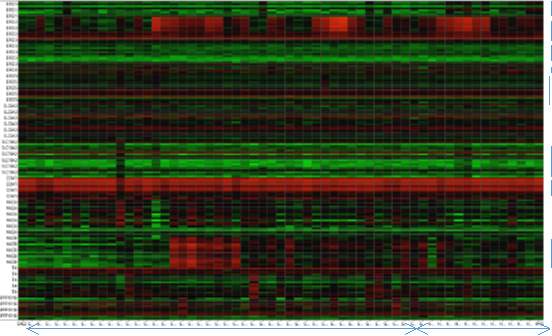
DRD1 DRD2 DRD3 DRD4 DRD5 DAT COMT MAOB GNS NS Figure 5.1. Dopamine related gene expression across various GNS and NS lines
5.2.2. To investigate the role of sigma receptors in GBM
From my screen, sigma receptor is one of the neurochemical classes that showed the highest activity. Although, there is small number of sigma receptor modulators in the library, 24% of the sigma modulating compounds present in the library showed activity in GNS and NS cells. One compound (1-Methyl-4-[2-(2-naphthyl)-ethenyl]-pyridinium iodide) from the secondary screen which showed more than 8-fold selectivity was not available to do the retest and was not pursued further.
Secondly, sigma receptors are the highest expressed genes in all our GNS lines compared to receptors of all other neurochemical classes (Figure 2.2). Therefore, sigma receptors with the highest screen activity and highest gene expression suggests a potential influence of sigma receptors in GBM. Sigma receptors were initially thought to be a subtype of opioid receptor but are now considered to be a unique type of receptor. There are two types of sigma receptors identified known as sigma-1 and sigma-2 receptors(Quirion et al., 1992). However, endogenous ligand for these receptors have not been identified with certainty but may include steroid hormones such as progesterone, or sphingolipid derived amines and N,N-dimethyltrypamine (DMT)(van Waarde et al., 2010).
The sigma-1 receptor is a ligand regulated molecular chaperone, which interacts with various ion channels and GPCR(Crottes et al., 2013). The sigma-2 receptor was recently identified as the progesterone receptor membrane component 1(PGRMC1)(Xu et al., 2011). Sigma receptors have been studied extensively for their function in the CNS, endocrine, motor and immune systems. Sigma receptors are thought to be involved in several pathologies of the CNS including depression, anxiety, schizophrenia and Alzheimer’s diseases. Furthermore, sigma receptors are highly overexpressed in many cancers cell lines including brain, lung, breast, prostrate, leukemia and melanoma(Vilner et al., 1995).
Intriguingly, sigma receptors are also overexpressed in rapidly proliferating normal cells including many human stem cells. Particularly, the sigma -2 receptor is expressed 10fold more in proliferating tumor cells compared to quiescent tumor cells (Mach et al., 1997). Sigma-2 receptors are also shown to be highly expressed in human stem cells including neural progenitors, bone marrow stromal, hematopoietic and embryonic cells compared to differentiated lineage restricted cells (Haller et al., 2012). Thus sigma-2 receptor could be used as biomarker for proliferative status and also may be employ to selectively target the highly proliferating tumor cells. Recent evidence suggests that the sigma-2 receptor is a potential tumor and serum biomarker for human lung cancer and important target for inhibiting tumor invasion and cancer progression (Mir et al., 2012).
Since the role of sigma receptors in GBM stem cells has not been studied well, it would be very interesting to pursue further based on this current thesis. We can first modulate sigma receptor in GNS cells using pharmacological agents for sigma -1 receptor such as such as 4-IBP, rimcazole (drug used to treat schizophrenia) and sigma-2 receptor AG205, siramesine, SR31747A (which is in phase II clinical trial for prostrate cancer) and dextromethorphan. Second, we can knockdown SIGMAR1 and PGRMC1 by RNAi or knockout by CRISPR technology to gain more insight at molecular level.
5.2.3 To investigate the effect of serotonergic pathway in GBM
Although I focused mainly on the dopaminergic pathway in my thesis, the serotonergic class is one of the other neurochemical classes that showed selectivity against NS cells compared to fibroblast. Three out of ten NS selective compounds (LY-165,163, MDL-72222, Tropanyl 3,5dimethylbenzoate) identified in my screen are modulators of serotonergic pathway. Secondly, preliminary analysis of GNS cell culture medium showed minute amount of serotonin suggesting GNS cells make serotonin and could potentially influence GBM growth. There are increasing number of studies demonstrating serotonin’s impact on normal neurogenesis.
Interestingly, there are growing evidences implicating serotonin as a mitogenic factor for many cancer cell lines (Sarrouilhe et al., 2015; Siddiqui et al., 2005) and specifically, may be a prognostic marker in prostrate cancer (Jungwirth et al., 2008). Further investigation on the role of serotonin and its seven receptors in GNS cells could potentially shed more light and enhance our understanding on GBM stem cells. Serotonin is a monoamine synthesized in the CNS by neurons in the raphe nuclei, which regulates many aspects of behaviors including mood, sleep, appetite, reproductive activity. Serotonin is synthesized from amino acid tryptophan in two steps by tryptophan hydroxylase (TPH) and aromatic amino acid decarboxylase (DDC). There are seven families of 5-HT receptors (5-HT1-7) and all except 5-HT3 are G protein coupled receptors. 5-HT3 is a ligand gated cation channels. Literature highlights the importance of serotonin and its receptors in regulation of adult neurogenesis.
A recent study has demonstrated that serotonergic axons originating from raphe nuclei form a dense plexus covering most of the wall of lateral ventricles contacting both ependymal cells and type B1 cells(Tong et al., 2014). Serotonergic neurons from raphe nuclei extend its projection to the whole cortex. Thus in vivo endogenous modification of serotonin level in brain tumor microenvironment by optogenetic manipulation of TPH2 (TPH isoform specific in neuron) expressing serotonergic neurons could examine serotonin’s role in GBM growth in vivo. We could also test pharmacological manipulation of serotonin receptors using many known antiemetic agents such as ondansetron and granisetron, or antidepressant drug such as mirtazapine and mianserin.
5.2.4. To determine if DKK1 confers selectivity in GNS versus NS cells
From my genome wide expression analysis, one of the most differentially regulated genes upon treatment with D4 antagonists (PNU 96415E) is DKK1 (Dickkopf1) gene, which is downregulated in GNS cells but not in normal NS cells. Interestingly, normal human NS cells when differentiated with D4 antagonist L-741,742 showed increased expression of DKK1 gene (Table 4.2). Both these D4 antagonists selectively kill the GNS cells while normal NS cell differentiates. Since there is a differential effect of D4 antagonist in GNS versus NS cells, and there is differential expression of DKK1 gene in GNS versus NS cells upon treatment, I hypothesize that DKK1 may play a potential role in conferring the selectivity in GNS and differentiation in NS cells. DKK1 is a secreted inhibitor of the WNT/β-catenin pathway(Bafico et al., 2001), however the gene expression data did not show increase in WNT regulated gene although DKK1 itself is regulated by WNT pathway. However, the preliminary qPCR data showed down regulation of AXIN2, which is used widely as a read out for WNT signaling, along with MASH1/ASCL1 gene expression.
Although the top candidate genes from the expression array data did not clustered with any biological pathway by GSEA analysis reported in my thesis, DKK1 is nevertheless an interesting gene candidate. DKK1 gene expression is also differentially expressed in cohort of our GNS cells. DKK1 is differentially expressed in many cancers and is also associated with neurodegenerative disease(Menezes et al., 2012). Thus investigating the role of DKK1 in GNS and NS could potentially give insights into understanding the differential regulation of growth and differentiation in normal versus cancer stem cells.
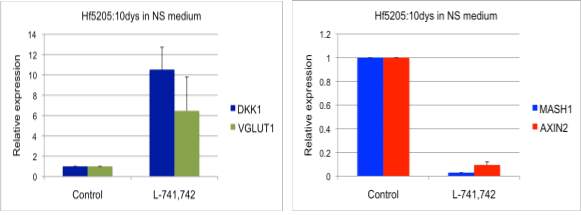
Figure 5.2 Expression of DKK1, VGLUT1, and MASH1, AXIN2 in human NS cells treated with L-741,742
A&B. Relative fold expression of DKK1, VGLUT1 and MASH1, AXIN2 in hf5205 cells treated with L-741,742 for 10 days respectively.
5.2.5. To elucidate the role of autophagy in GNS, NS and differentiation
In this thesis, I found that disruption of the autophagy-lysosomal degradation system in GNS cells makes them more vulnerable to D4 antagonists and undergo cell death. While in NS cells, they differentiate. Here, I have not studied autophagy in context of the normal NS and differentiation. Autophagy plays an important role in maintaining cell homeostasis, and may play an important role in maintaining self-renewal and differentiation(Rodolfo et al., 2015). Since the processes of self-renewal and differentiation require strict control of protein and organelle turnover to achieve cellular remodeling, the role of autophagy in the regulation of NS remains largely an unexplored field.
There is some evidence that suggests a role of autophagy during NS differentiation where expressions of Atg7, Becn1, Map1lc3a, Ambra1 are increased in the neurogenesis of olfactory bulb in mice (Yazdankhah et al., 2014). Ablation of Fip200 results in the loss of NS pool and impairment of neuronal differentiation in the postnatal brain (Wang et al., 2013). Therefore, interrogation of basal autophagy in NS cells during differentiation will be interesting to monitor where NS cells can be transfected with monomeric tandem-GFP-RFP-LC3 construct. We can monitor autophagy process in live cells or fixed, in NS and differentiation condition, with and without D4 antagonists.
5.2.6. Overall Summary
This thesis provides the first comprehensive analysis of all neurochemical pathways in GBM stem cell survival and proliferation, demonstrating the influence of dopaminergic, cholinergic and serotonergic pathways particularly dopamine D4 receptor. I uncovered here a new vulnerability of GBM stem cells to disruption in the autophagy-lysosomal system by dopamine D4 signaling modulation, where normal NS cells promotes mature neuronal differentiation suggesting its influence on cell fate and stem cell function.
The findings in this thesis open up new ways of thinking on how GBMs utilize such brain –centric pathways for growth and survival. Further in vivo investigation on the whole dopamine system and the neurochemical milieu will provide more complete mechanisms responsible for GBM growth and survival. We know this disease is tough to cure and certainly, much work need to be done before these compounds gets into clinic. The research on exploration of neurochemical pathways in GBM is beginning to emerge and there are large number of compounds that have been developed for neurologic diseases, which could be potentially redeployed for GBM application with further thorough investigation.
References
Al-Hajj, M., Wicha, M. S., Benito-Hernandez, A., Morrison, S. J., and Clarke, M. F. (2003). Prospective identification of tumorigenic breast cancer cells. Proceedings of the National Academy of Sciences of the United States of America 100, 3983-3988.
Alfonso, J., Le Magueresse, C., Zuccotti, A., Khodosevich, K., and Monyer, H. (2012). Diazepam binding inhibitor promotes progenitor proliferation in the postnatal SVZ by reducing GABA signaling. Cell stem cell 10, 76-87.
Alitalo, K., Tammela, T., and Petrova, T. V. (2005). Lymphangiogenesis in development and human disease. Nature 438, 946-953.
Altman, J., and Bayer, S. A. (1990). Mosaic organization of the hippocampal neuroepithelium and the multiple germinal sources of dentate granule cells. The Journal of comparative neurology 301, 325-342.
Altman, J., and Das, G. D. (1965). Autoradiographic and histological evidence of postnatal hippocampal neurogenesis in rats. The Journal of comparative neurology 124, 319-335.
Andang, M., Hjerling-Leffler, J., Moliner, A., Lundgren, T. K., Castelo-Branco, G., Nanou, E., Pozas, E., Bryja, V., Halliez, S., Nishimaru, H., et al. (2008). Histone H2AX-dependent GABA(A) receptor regulation of stem cell proliferation. Nature 451, 460-464.
Anden, N. E., Carlsson, A., Dahlstroem, A., Fuxe, K., Hillarp, N. A., and Larsson, K. (1964). Demonstration and Mapping out of Nigro-Neostriatal Dopamine Neurons. Life sciences 3, 523530.
Andersen, P. H., Gingrich, J. A., Bates, M. D., Dearry, A., Falardeau, P., Senogles, S. E., and Caron, M. G. (1990). Dopamine receptor subtypes: beyond the D1/D2 classification. Trends in pharmacological sciences 11, 231-236.
Anderson, S. A., Eisenstat, D. D., Shi, L., and Rubenstein, J. L. (1997). Interneuron migration from basal forebrain to neocortex: dependence on Dlx genes. Science 278, 474-476.
Antoni, M. H., Lutgendorf, S. K., Cole, S. W., Dhabhar, F. S., Sephton, S. E., McDonald, P. G., Stefanek, M., and Sood, A. K. (2006). The influence of bio-behavioural factors on tumour biology: pathways and mechanisms. Nature reviews Cancer 6, 240-248.
Araki, K. Y., Sims, J. R., and Bhide, P. G. (2007). Dopamine receptor mRNA and protein expression in the mouse corpus striatum and cerebral cortex during pre- and postnatal development. Brain research 1156, 31-45.
Asghari, V., Sanyal, S., Buchwaldt, S., Paterson, A., Jovanovic, V., and Van Tol, H. H. (1995). Modulation of intracellular cyclic AMP levels by different human dopamine D4 receptor variants. Journal of neurochemistry 65, 1157-1165.
Ayala, G. E., Dai, H., Tahir, S. A., Li, R., Timme, T., Ittmann, M., Frolov, A., Wheeler, T. M., Rowley, D., and Thompson, T. C. (2006). Stromal antiapoptotic paracrine loop in perineural invasion of prostatic carcinoma. Cancer research 66, 5159-5164.
Badino, G. R., Novelli, A., Girardi, C., and Di Carlo, F. (1996). Evidence for functional betaadrenoceptor subtypes in CG-5 breast cancer cell. Pharmacological research 33, 255-260.
Bafico, A., Liu, G., Yaniv, A., Gazit, A., and Aaronson, S. A. (2001). Novel mechanism of Wnt signalling inhibition mediated by Dickkopf-1 interaction with LRP6/Arrow. Nature cell biology 3, 683-686.
Baker, S. A., Baker, K. A., and Hagg, T. (2004). Dopaminergic nigrostriatal projections regulate neural precursor proliferation in the adult mouse subventricular zone. The European journal of neuroscience 20, 575-579.
Banasr, M., Hery, M., Printemps, R., and Daszuta, A. (2004). Serotonin-induced increases in adult cell proliferation and neurogenesis are mediated through different and common 5-HT receptor subtypes in the dentate gyrus and the subventricular zone. Neuropsychopharmacology : official publication of the American College of Neuropsychopharmacology 29, 450-460.
Bao, S., Wu, Q., Li, Z., Sathornsumetee, S., Wang, H., McLendon, R. E., Hjelmeland, A. B., and Rich, J. N. (2008). Targeting cancer stem cells through L1CAM suppresses glioma growth. Cancer research 68, 6043-6048.
Bao, S., Wu, Q., McLendon, R. E., Hao, Y., Shi, Q., Hjelmeland, A. B., Dewhirst, M. W., Bigner, D. D., and Rich, J. N. (2006). Glioma stem cells promote radioresistance by preferential activation of the DNA damage response. Nature 444, 756-760.
Basu, S., Nagy, J. A., Pal, S., Vasile, E., Eckelhoefer, I. A., Bliss, V. S., Manseau, E. J., Dasgupta, P. S., Dvorak, H. F., and Mukhopadhyay, D. (2001). The neurotransmitter dopamine inhibits angiogenesis induced by vascular permeability factor/vascular endothelial growth factor. Nature medicine 7, 569-574.
Bateup, H. S., Svenningsson, P., Kuroiwa, M., Gong, S., Nishi, A., Heintz, N., and Greengard, P. (2008). Cell type-specific regulation of DARPP-32 phosphorylation by psychostimulant and antipsychotic drugs. Nature neuroscience 11, 932-939.
Beaulieu, J. M., and Gainetdinov, R. R. (2011). The physiology, signaling, and pharmacology of dopamine receptors. Pharmacological reviews 63, 182-217.
Beaulieu, J. M., Sotnikova, T. D., Marion, S., Lefkowitz, R. J., Gainetdinov, R. R., and Caron, M. G. (2005). An Akt/beta-arrestin 2/PP2A signaling complex mediates dopaminergic neurotransmission and behavior. Cell 122, 261-273.
Behar, T. N., Schaffner, A. E., Scott, C. A., Greene, C. L., and Barker, J. L. (2000). GABA receptor antagonists modulate postmitotic cell migration in slice cultures of embryonic rat cortex. Cerebral cortex 10, 899-909.
Behar, T. N., Scott, C. A., Greene, C. L., Wen, X., Smith, S. V., Maric, D., Liu, Q. Y., Colton, C. A., and Barker, J. L. (1999). Glutamate acting at NMDA receptors stimulates embryonic cortical neuronal migration. The Journal of neuroscience : the official journal of the Society for Neuroscience 19, 4449-4461.
Beier, D., Hau, P., Proescholdt, M., Lohmeier, A., Wischhusen, J., Oefner, P. J., Aigner, L., Brawanski, A., Bogdahn, U., and Beier, C. P. (2007). CD133( ) and CD133(-) glioblastomaderived cancer stem cells show differential growth characteristics and molecular profiles. Cancer research 67, 4010-4015.
Ben-Ari, Y. (2006). Basic developmental rules and their implications for epilepsy in the immature brain. Epileptic disorders : international epilepsy journal with videotape 8, 91-102.
Benitez-Diaz, P., Miranda-Contreras, L., Mendoza-Briceno, R. V., Pena-Contreras, Z., and Palacios-Pru, E. (2003). Prenatal and postnatal contents of amino acid neurotransmitters in mouse parietal cortex. Developmental neuroscience 25, 366-374.
Benjamin, J., Li, L., Patterson, C., Greenberg, B. D., Murphy, D. L., and Hamer, D. H. (1996). Population and familial association between the D4 dopamine receptor gene and measures of Novelty Seeking. Nature genetics 12, 81-84.
Bennett, D. C., Peachey, L. A., Durbin, H., and Rudland, P. S. (1978). A possible mammary stem cell line. Cell 15, 283-298.
Beom, S., Cheong, D., Torres, G., Caron, M. G., and Kim, K. M. (2004). Comparative studies of molecular mechanisms of dopamine D2 and D3 receptors for the activation of extracellular signal-regulated kinase. The Journal of biological chemistry 279, 28304-28314.
Berg, D. A., Belnoue, L., Song, H., and Simon, A. (2013). Neurotransmitter-mediated control of neurogenesis in the adult vertebrate brain. Development 140, 2548-2561.
Berg, D. A., Kirkham, M., Wang, H., Frisen, J., and Simon, A. (2011). Dopamine controls neurogenesis in the adult salamander midbrain in homeostasis and during regeneration of dopamine neurons. Cell stem cell 8, 426-433.
Betizeau, M., Cortay, V., Patti, D., Pfister, S., Gautier, E., Bellemin-Menard, A., Afanassieff, M., Huissoud, C., Douglas, R. J., Kennedy, H., and Dehay, C. (2013). Precursor diversity and complexity of lineage relationships in the outer subventricular zone of the primate. Neuron 80, 442-457.
Bibb, J. A., Snyder, G. L., Nishi, A., Yan, Z., Meijer, L., Fienberg, A. A., Tsai, L. H., Kwon, Y. T., Girault, J. A., Czernik, A. J., et al. (1999). Phosphorylation of DARPP-32 by Cdk5 modulates dopamine signalling in neurons. Nature 402, 669-671.
Bitner, R. S., Nikkel, A. L., Otte, S., Martino, B., Barlow, E. H., Bhatia, P., Stewart, A. O., Brioni, J. D., Decker, M. W., and Moreland, R. B. (2006). Dopamine D4 receptor signaling in the rat paraventricular hypothalamic nucleus: Evidence of natural coupling involving immediate early gene induction and mitogen activated protein kinase phosphorylation. Neuropharmacology 50, 521-531.
Bonaguidi, M. A., Wheeler, M. A., Shapiro, J. S., Stadel, R. P., Sun, G. J., Ming, G. L., and Song, H. (2011). In vivo clonal analysis reveals self-renewing and multipotent adult neural stem cell characteristics. Cell 145, 1142-1155.
Bonfanti, L., and Peretto, P. (2007). Radial glial origin of the adult neural stem cells in the subventricular zone. Progress in neurobiology 83, 24-36.
Bonnet, D., and Dick, J. E. (1997). Human acute myeloid leukemia is organized as a hierarchy that originates from a primitive hematopoietic cell. Nature medicine 3, 730-737.
Borta, A., and Hoglinger, G. U. (2007). Dopamine and adult neurogenesis. Journal of neurochemistry 100, 587-595.
Brennan, C. W., Verhaak, R. G., McKenna, A., Campos, B., Noushmehr, H., Salama, S. R., Zheng, S., Chakravarty, D., Sanborn, J. Z., Berman, S. H., et al. (2013). The somatic genomic landscape of glioblastoma. Cell 155, 462-477.
Brezun, J. M., and Daszuta, A. (1999). Depletion in serotonin decreases neurogenesis in the dentate gyrus and the subventricular zone of adult rats. Neuroscience 89, 999-1002.
Britanova, O., de Juan Romero, C., Cheung, A., Kwan, K. Y., Schwark, M., Gyorgy, A., Vogel, T., Akopov, S., Mitkovski, M., Agoston, D., et al. (2008). Satb2 is a postmitotic determinant for upper-layer neuron specification in the neocortex. Neuron 57, 378-392.
Britz, O., Mattar, P., Nguyen, L., Langevin, L. M., Zimmer, C., Alam, S., Guillemot, F., and Schuurmans, C. (2006). A role for proneural genes in the maturation of cortical progenitor cells. Cerebral cortex 16 Suppl 1, i138-151.
Broekman, M. L., Risselada, R., Engelen-Lee, J., Spliet, W. G., and Verweij, B. H. (2009). Glioblastoma multiforme in the posterior cranial fossa in a patient with neurofibromatosis type I. Case reports in medicine 2009, 757898.
Calzolari, F., Michel, J., Baumgart, E. V., Theis, F., Gotz, M., and Ninkovic, J. (2015). Fast clonal expansion and limited neural stem cell self-renewal in the adult subependymal zone. Nature neuroscience 18, 490-492.
Cameron, H. A., McEwen, B. S., and Gould, E. (1995). Regulation of adult neurogenesis by excitatory input and NMDA receptor activation in the dentate gyrus. The Journal of neuroscience : the official journal of the Society for Neuroscience 15, 4687-4692.
Cancer Genome Atlas Research, N. (2008). Comprehensive genomic characterization defines human glioblastoma genes and core pathways. Nature 455, 1061-1068.
Carlsson, A. (2001). A paradigm shift in brain research. Science 294, 1021-1024.
Catalano, M., Nobile, M., Novelli, E., Nothen, M. M., and Smeraldi, E. (1993). Distribution of a novel mutation in the first exon of the human dopamine D4 receptor gene in psychotic patients. Biological psychiatry 34, 459-464.
Chakroborty, D., Chowdhury, U. R., Sarkar, C., Baral, R., Dasgupta, P. S., and Basu, S. (2008). Dopamine regulates endothelial progenitor cell mobilization from mouse bone marrow in tumor vascularization. The Journal of clinical investigation 118, 1380-1389.
Chakroborty, D., Sarkar, C., Mitra, R. B., Banerjee, S., Dasgupta, P. S., and Basu, S. (2004). Depleted dopamine in gastric cancer tissues: dopamine treatment retards growth of gastric cancer by inhibiting angiogenesis. Clinical cancer research : an official journal of the American Association for Cancer Research 10, 4349-4356.
Chang, F. M., Kidd, J. R., Livak, K. J., Pakstis, A. J., and Kidd, K. K. (1996). The world-wide distribution of allele frequencies at the human dopamine D4 receptor locus. Human genetics 98, 91-101.
Chen, B., Wang, S. S., Hattox, A. M., Rayburn, H., Nelson, S. B., and McConnell, S. K. (2008). The Fezf2-Ctip2 genetic pathway regulates the fate choice of subcortical projection neurons in the developing cerebral cortex. Proceedings of the National Academy of Sciences of the United States of America 105, 11382-11387.
Chen, J., Li, Y., Yu, T. S., McKay, R. M., Burns, D. K., Kernie, S. G., and Parada, L. F. (2012). A restricted cell population propagates glioblastoma growth after chemotherapy. Nature 488, 522-526.
Chi, S. S., Vetiska, S. M., Gill, R. S., Hsiung, M. S., Liu, F., and Van Tol, H. H. (2010). Transactivation of PDGFRbeta by dopamine D4 receptor does not require PDGFRbeta dimerization. Molecular brain 3, 22.
Cho, D. I., Beom, S., Van Tol, H. H., Caron, M. G., and Kim, K. M. (2006). Characterization of the desensitization properties of five dopamine receptor subtypes and alternatively spliced variants of dopamine D2 and D4 receptors. Biochemical and biophysical research communications 350, 634-640.
Choi, D. S., Blanco, E., Kim, Y. S., Rodriguez, A. A., Zhao, H., Huang, T. H., Chen, C. L., Jin, G., Landis, M. D., Burey, L. A., et al. (2014). Chloroquine eliminates cancer stem cells through deregulation of Jak2 and DNMT1. Stem cells.
Chou, T. C. (2010). Drug combination studies and their synergy quantification using the ChouTalalay method. Cancer research 70, 440-446.
Clarke, M. F., Dick, J. E., Dirks, P. B., Eaves, C. J., Jamieson, C. H., Jones, D. L., Visvader, J., Weissman, I. L., and Wahl, G. M. (2006). Cancer stem cells--perspectives on current status and future directions: AACR Workshop on cancer stem cells. Cancer research 66, 9339-9344.
Clarkson, B., Ohkita, T., Ota, K., and Fried, J. (1967). Studies of cellular proliferation in human leukemia. I. Estimation of growth rates of leukemic and normal hematopoietic cells in two adults with acute leukemia given single injections of tritiated thymidine. The Journal of clinical investigation 46, 506-529.
Clevenger, C. V., Chang, W. P., Ngo, W., Pasha, T. L., Montone, K. T., and Tomaszewski, J. E. (1995). Expression of prolactin and prolactin receptor in human breast carcinoma. Evidence for an autocrine/paracrine loop. The American journal of pathology 146, 695-705.
Codega, P., Silva-Vargas, V., Paul, A., Maldonado-Soto, A. R., Deleo, A. M., Pastrana, E., and Doetsch, F. (2014). Prospective identification and purification of quiescent adult neural stem cells from their in vivo niche. Neuron 82, 545-559.
Cohen, A. I., Todd, R. D., Harmon, S., and O'Malley, K. L. (1992). Photoreceptors of mouse retinas possess D4 receptors coupled to adenylate cyclase. Proceedings of the National Academy of Sciences of the United States of America 89, 12093-12097.
Collins, A. T., Berry, P. A., Hyde, C., Stower, M. J., and Maitland, N. J. (2005). Prospective identification of tumorigenic prostate cancer stem cells. Cancer research 65, 10946-10951.
Comings, D. E., Gonzalez, N., Wu, S., Gade, R., Muhleman, D., Saucier, G., Johnson, P., Verde, R., Rosenthal, R. J., Lesieur, H. R., et al. (1999). Studies of the 48 bp repeat polymorphism of the DRD4 gene in impulsive, compulsive, addictive behaviors: Tourette syndrome, ADHD, pathological gambling, and substance abuse. American journal of medical genetics 88, 358-368.
Coronas, V., Bantubungi, K., Fombonne, J., Krantic, S., Schiffmann, S. N., and Roger, M. (2004). Dopamine D3 receptor stimulation promotes the proliferation of cells derived from the post-natal subventricular zone. Journal of neurochemistry 91, 1292-1301.
Crandall, J. E., McCarthy, D. M., Araki, K. Y., Sims, J. R., Ren, J. Q., and Bhide, P. G. (2007). Dopamine receptor activation modulates GABA neuron migration from the basal forebrain to the cerebral cortex. The Journal of neuroscience : the official journal of the Society for Neuroscience 27, 3813-3822.
Crottes, D., Guizouarn, H., Martin, P., Borgese, F., and Soriani, O. (2013). The sigma-1 receptor: a regulator of cancer cell electrical plasticity? Frontiers in physiology 4, 175.
Cuzon, V. C., Yeh, P. W., Cheng, Q., and Yeh, H. H. (2006). Ambient GABA promotes cortical entry of tangentially migrating cells derived from the medial ganglionic eminence. Cerebral cortex 16, 1377-1388.
Dahlstroem, A., and Fuxe, K. (1964). Evidence for the Existence of Monoamine-Containing Neurons in the Central Nervous System. I. Demonstration of Monoamines in the Cell Bodies of Brain Stem Neurons. Acta physiologica Scandinavica Supplementum, SUPPL 232:231-255.
Dang, L., White, D. W., Gross, S., Bennett, B. D., Bittinger, M. A., Driggers, E. M., Fantin, V. R., Jang, H. G., Jin, S., Keenan, M. C., et al. (2010). Cancer-associated IDH1 mutations produce 2-hydroxyglutarate. Nature 465, 966.
Defagot, M. C., Falzone, T. L., Low, M. J., Grandy, D. K., Rubinstein, M., and Antonelli, M. C. (2000). Quantitative analysis of the dopamine D4 receptor in the mouse brain. Journal of neuroscience research 59, 202-208.
Deisseroth, K., Feng, G., Majewska, A. K., Miesenbock, G., Ting, A., and Schnitzer, M. J. (2006). Next-generation optical technologies for illuminating genetically targeted brain circuits. The Journal of neuroscience : the official journal of the Society for Neuroscience 26, 1038010386.
Di Giorgi-Gerevini, V., Melchiorri, D., Battaglia, G., Ricci-Vitiani, L., Ciceroni, C., Busceti, C. L., Biagioni, F., Iacovelli, L., Canudas, A. M., Parati, E., et al. (2005). Endogenous activation of metabotropic glutamate receptors supports the proliferation and survival of neural progenitor cells. Cell death and differentiation 12, 1124-1133.
Diamandis, P., Sacher, A. G., Tyers, M., and Dirks, P. B. (2009). New drugs for brain tumors? Insights from chemical probing of neural stem cells. Medical hypotheses 72, 683-687.
Diamandis, P., Wildenhain, J., Clarke, I. D., Sacher, A. G., Graham, J., Bellows, D. S., Ling, E. K., Ward, R. J., Jamieson, L. G., Tyers, M., and Dirks, P. B. (2007). Chemical genetics reveals a complex functional ground state of neural stem cells. Nature chemical biology 3, 268-273.
Diaz, J., Ridray, S., Mignon, V., Griffon, N., Schwartz, J. C., and Sokoloff, P. (1997). Selective expression of dopamine D3 receptor mRNA in proliferative zones during embryonic development of the rat brain. The Journal of neuroscience : the official journal of the Society for Neuroscience 17, 4282-4292.
Diehn, M., Cho, R. W., Lobo, N. A., Kalisky, T., Dorie, M. J., Kulp, A. N., Qian, D., Lam, J. S., Ailles, L. E., Wong, M., et al. (2009). Association of reactive oxygen species levels and radioresistance in cancer stem cells. Nature 458, 780-783.
Ding, Y. C., Chi, H. C., Grady, D. L., Morishima, A., Kidd, J. R., Kidd, K. K., Flodman, P., Spence, M. A., Schuck, S., Swanson, J. M., et al. (2002). Evidence of positive selection acting at the human dopamine receptor D4 gene locus. Proceedings of the National Academy of Sciences of the United States of America 99, 309-314.
Dizeyi, N., Bjartell, A., Nilsson, E., Hansson, J., Gadaleanu, V., Cross, N., and Abrahamsson, P. A. (2004). Expression of serotonin receptors and role of serotonin in human prostate cancer tissue and cell lines. The Prostate 59, 328-336.
Doetsch, F., and Alvarez-Buylla, A. (1996). Network of tangential pathways for neuronal migration in adult mammalian brain. Proceedings of the National Academy of Sciences of the United States of America 93, 14895-14900.
Doetsch, F., Garcia-Verdugo, J. M., and Alvarez-Buylla, A. (1999). Regeneration of a germinal layer in the adult mammalian brain. Proceedings of the National Academy of Sciences of the United States of America 96, 11619-11624.
Dulawa, S. C., Grandy, D. K., Low, M. J., Paulus, M. P., and Geyer, M. A. (1999). Dopamine D4 receptor-knock-out mice exhibit reduced exploration of novel stimuli. The Journal of neuroscience : the official journal of the Society for Neuroscience 19, 9550-9556.
Ebstein, R. P., Novick, O., Umansky, R., Priel, B., Osher, Y., Blaine, D., Bennett, E. R., Nemanov, L., Katz, M., and Belmaker, R. H. (1996). Dopamine D4 receptor (D4DR) exon III polymorphism associated with the human personality trait of Novelty Seeking. Nature genetics 12, 78-80.
Ehtesham, M., Mapara, K. Y., Stevenson, C. B., and Thompson, R. C. (2009). CXCR4 mediates the proliferation of glioblastoma progenitor cells. Cancer letters 274, 305-312.
Ellwanger, K., Eich, A., and Nickel, M. (2007). GABA and glutamate specifically induce contractions in the sponge Tethya wilhelma. Journal of comparative physiology A, Neuroethology, sensory, neural, and behavioral physiology 193, 1-11.
Emsley, J. G., and Hagg, T. (2003). Endogenous and exogenous ciliary neurotrophic factor enhances forebrain neurogenesis in adult mice. Experimental neurology 183, 298-310.
Eppert, K., Takenaka, K., Lechman, E. R., Waldron, L., Nilsson, B., van Galen, P., Metzeler, K. H., Poeppl, A., Ling, V., Beyene, J., et al. (2011). Stem cell gene expression programs influence clinical outcome in human leukemia. Nature medicine 17, 1086-1093.
Eriksson, P. S., Perfilieva, E., Bjork-Eriksson, T., Alborn, A. M., Nordborg, C., Peterson, D. A., and Gage, F. H. (1998). Neurogenesis in the adult human hippocampus. Nature medicine 4, 1313-1317.
Ernst, A., Alkass, K., Bernard, S., Salehpour, M., Perl, S., Tisdale, J., Possnert, G., Druid, H., and Frisen, J. (2014). Neurogenesis in the striatum of the adult human brain. Cell 156, 10721083.
Faraone, S. V., Biederman, J., Weiffenbach, B., Keith, T., Chu, M. P., Weaver, A., Spencer, T. J., Wilens, T. E., Frazier, J., Cleves, M., and Sakai, J. (1999). Dopamine D4 gene 7-repeat allele and attention deficit hyperactivity disorder. The American journal of psychiatry 156, 768-770.
Felder, C. C., Campbell, T., Albrecht, F., and Jose, P. A. (1990). Dopamine inhibits Na( )-H exchanger activity in renal BBMV by stimulation of adenylate cyclase. The American journal of physiology 259, F297-303.
Fenno, L., Yizhar, O., and Deisseroth, K. (2011). The development and application of optogenetics. Annual review of neuroscience 34, 389-412.
Fernando, R. N., Eleuteri, B., Abdelhady, S., Nussenzweig, A., Andang, M., and Ernfors, P. (2011). Cell cycle restriction by histone H2AX limits proliferation of adult neural stem cells. Proceedings of the National Academy of Sciences of the United States of America 108, 58375842.
Fietz, S. A., Kelava, I., Vogt, J., Wilsch-Brauninger, M., Stenzel, D., Fish, J. L., Corbeil, D., Riehn, A., Distler, W., Nitsch, R., and Huttner, W. B. (2010). OSVZ progenitors of human and ferret neocortex are epithelial-like and expand by integrin signaling. Nature neuroscience 13, 690-699.
Flint, A. C., Liu, X., and Kriegstein, A. R. (1998). Nonsynaptic glycine receptor activation during early neocortical development. Neuron 20, 43-53. Florio, M., and Huttner, W. B. (2014). Neural progenitors, neurogenesis and the evolution of the neocortex. Development 141, 2182-2194.
Folkman, J., Merler, E., Abernathy, C., and Williams, G. (1971). Isolation of a tumor factor responsible for angiogenesis. The Journal of experimental medicine 133, 275-288.
Fountain, S. J. (2010). Neurotransmitter receptor homologues of Dictyostelium discoideum. Journal of molecular neuroscience : MN 41, 263-266.
Freundlieb, N., Francois, C., Tande, D., Oertel, W. H., Hirsch, E. C., and Hoglinger, G. U. (2006). Dopaminergic substantia nigra neurons project topographically organized to the subventricular zone and stimulate precursor cell proliferation in aged primates. The Journal of neuroscience : the official journal of the Society for Neuroscience 26, 2321-2325.
Friedman, H. S., Prados, M. D., Wen, P. Y., Mikkelsen, T., Schiff, D., Abrey, L. E., Yung, W. K., Paleologos, N., Nicholas, M. K., Jensen, R., et al. (2009). Bevacizumab alone and in combination with irinotecan in recurrent glioblastoma. Journal of clinical oncology : official journal of the American Society of Clinical Oncology 27, 4733-4740.
Furnari, F. B., Fenton, T., Bachoo, R. M., Mukasa, A., Stommel, J. M., Stegh, A., Hahn, W. C., Ligon, K. L., Louis, D. N., Brennan, C., et al. (2007). Malignant astrocytic glioma: genetics, biology, and paths to treatment. Genes & development 21, 2683-2710.
Gaiano, N., Nye, J. S., and Fishell, G. (2000). Radial glial identity is promoted by Notch1 signaling in the murine forebrain. Neuron 26, 395-404.
Galli, R., Binda, E., Orfanelli, U., Cipelletti, B., Gritti, A., De Vitis, S., Fiocco, R., Foroni, C., Dimeco, F., and Vescovi, A. (2004). Isolation and characterization of tumorigenic, stem-like neural precursors from human glioblastoma. Cancer research 64, 7011-7021.
Ge, S., Goh, E. L., Sailor, K. A., Kitabatake, Y., Ming, G. L., and Song, H. (2006). GABA regulates synaptic integration of newly generated neurons in the adult brain. Nature 439, 589593.
Gill, R. S., Hsiung, M. S., Sum, C. S., Lavine, N., Clark, S. D., and Van Tol, H. H. (2010). The dopamine D4 receptor activates intracellular platelet-derived growth factor receptor beta to stimulate ERK1/2. Cellular signalling 22, 285-290.
Gingrich, J. A., and Caron, M. G. (1993). Recent advances in the molecular biology of dopamine receptors. Annual review of neuroscience 16, 299-321.
Giros, B., Sokoloff, P., Martres, M. P., Riou, J. F., Emorine, L. J., and Schwartz, J. C. (1989). Alternative splicing directs the expression of two D2 dopamine receptor isoforms. Nature 342, 923-926.
Glickstein, S. B., and Schmauss, C. (2001). Dopamine receptor functions: lessons from knockout mice [corrected]. Pharmacology & therapeutics 91, 63-83.
Gong, C., Bauvy, C., Tonelli, G., Yue, W., Delomenie, C., Nicolas, V., Zhu, Y., Domergue, V., Marin-Esteban, V., Tharinger, H., et al. (2013). Beclin 1 and autophagy are required for the tumorigenicity of breast cancer stem-like/progenitor cells. Oncogene 32, 2261-2272, 2272e 2261-2211.
Gorski, J. A., Talley, T., Qiu, M., Puelles, L., Rubenstein, J. L., and Jones, K. R. (2002). Cortical excitatory neurons and glia, but not GABAergic neurons, are produced in the Emx1-expressing lineage. The Journal of neuroscience : the official journal of the Society for Neuroscience 22, 6309-6314.
Graziane, N. M., Yuen, E. Y., and Yan, Z. (2009). Dopamine D4 Receptors Regulate GABAA Receptor Trafficking via an Actin/Cofilin/Myosin-dependent Mechanism. The Journal of biological chemistry 284, 8329-8336.
Greengard, P., Allen, P. B., and Nairn, A. C. (1999). Beyond the dopamine receptor: the DARPP-32/protein phosphatase-1 cascade. Neuron 23, 435-447.
Guillemot, F., and Joyner, A. L. (1993). Dynamic expression of the murine Achaete-Scute homologue Mash-1 in the developing nervous system. Mechanisms of development 42, 171-185.
Haller, J. L., Panyutin, I., Chaudhry, A., Zeng, C., Mach, R. H., and Frank, J. A. (2012). Sigma-2 receptor as potential indicator of stem cell differentiation. Molecular imaging and biology : MIB : the official publication of the Academy of Molecular Imaging 14, 325-335.
Hanahan, D., and Weinberg, R. A. (2011). Hallmarks of cancer: the next generation. Cell 144, 646-674.
Hand, R., Bortone, D., Mattar, P., Nguyen, L., Heng, J. I., Guerrier, S., Boutt, E., Peters, E., Barnes, A. P., Parras, C., et al. (2005). Phosphorylation of Neurogenin2 specifies the migration properties and the dendritic morphology of pyramidal neurons in the neocortex. Neuron 48, 4562.
Hansen, D. V., Lui, J. H., Parker, P. R., and Kriegstein, A. R. (2010). Neurogenic radial glia in the outer subventricular zone of human neocortex. Nature 464, 554-561.
Hara, T., Nakamura, K., Matsui, M., Yamamoto, A., Nakahara, Y., Suzuki-Migishima, R., Yokoyama, M., Mishima, K., Saito, I., Okano, H., and Mizushima, N. (2006). Suppression of basal autophagy in neural cells causes neurodegenerative disease in mice. Nature 441, 885-889.
Haydar, T. F., Wang, F., Schwartz, M. L., and Rakic, P. (2000). Differential modulation of proliferation in the neocortical ventricular and subventricular zones. The Journal of neuroscience : the official journal of the Society for Neuroscience 20, 5764-5774.
Hegi, M. E., Diserens, A. C., Gorlia, T., Hamou, M. F., de Tribolet, N., Weller, M., Kros, J. M., Hainfellner, J. A., Mason, W., Mariani, L., et al. (2005). MGMT gene silencing and benefit from temozolomide in glioblastoma. The New England journal of medicine 352, 997-1003.
Helmeste, D. M., and Tang, S. W. (2000). Dopamine D4 receptors. Japanese journal of pharmacology 82, 1-14.
Hemmati, H. D., Nakano, I., Lazareff, J. A., Masterman-Smith, M., Geschwind, D. H., BronnerFraser, M., and Kornblum, H. I. (2003). Cancerous stem cells can arise from pediatric brain tumors. Proceedings of the National Academy of Sciences of the United States of America 100, 15178-15183.
Hemmings, H. C., Jr., Greengard, P., Tung, H. Y., and Cohen, P. (1984). DARPP-32, a dopamine-regulated neuronal phosphoprotein, is a potent inhibitor of protein phosphatase-1. Nature 310, 503-505.
Heng, J. I., Moonen, G., and Nguyen, L. (2007). Neurotransmitters regulate cell migration in the telencephalon. The European journal of neuroscience 26, 537-546.
Hermann, P. C., Huber, S. L., Herrler, T., Aicher, A., Ellwart, J. W., Guba, M., Bruns, C. J., and Heeschen, C. (2007). Distinct populations of cancer stem cells determine tumor growth and metastatic activity in human pancreatic cancer. Cell stem cell 1, 313-323.
Hevner, R. F., Daza, R. A., Rubenstein, J. L., Stunnenberg, H., Olavarria, J. F., and Englund, C. (2003). Beyond laminar fate: toward a molecular classification of cortical projection/pyramidal neurons. Developmental neuroscience 25, 139-151.
Hevner, R. F., Shi, L., Justice, N., Hsueh, Y., Sheng, M., Smiga, S., Bulfone, A., Goffinet, A. M., Campagnoni, A. T., and Rubenstein, J. L. (2001). Tbr1 regulates differentiation of the preplate and layer 6. Neuron 29, 353-366.
Hoglinger, G. U., Rizk, P., Muriel, M. P., Duyckaerts, C., Oertel, W. H., Caille, I., and Hirsch, E. C. (2004). Dopamine depletion impairs precursor cell proliferation in Parkinson disease. Nature neuroscience 7, 726-735.
Ignatova, T. N., Kukekov, V. G., Laywell, E. D., Suslov, O. N., Vrionis, F. D., and Steindler, D. A. (2002). Human cortical glial tumors contain neural stem-like cells expressing astroglial and neuronal markers in vitro. Glia 39, 193-206.
Ishikawa, F., Yoshida, S., Saito, Y., Hijikata, A., Kitamura, H., Tanaka, S., Nakamura, R., Tanaka, T., Tomiyama, H., Saito, N., et al. (2007). Chemotherapy-resistant human AML stem cells home to and engraft within the bone-marrow endosteal region. Nature biotechnology 25, 1315-1321.
Iwakura, Y., Nawa, H., Sora, I., and Chao, M. V. (2008). Dopamine D1 receptor-induced signaling through TrkB receptors in striatal neurons. The Journal of biological chemistry 283, 15799-15806.
Jenkins, M. A., Wells, G., Bachman, J., Snyder, J. P., Jenkins, A., Huganir, R. L., Oswald, R. E., and Traynelis, S. F. (2014). Regulation of GluA1 alpha-amino-3-hydroxy-5-methyl-4isoxazolepropionic acid receptor function by protein kinase C at serine-818 and threonine-840. Molecular pharmacology 85, 618-629.
Jewell, J. L., Russell, R. C., and Guan, K. L. (2013). Amino acid signalling upstream of mTOR. Nature reviews Molecular cell biology 14, 133-139.
Jimenez, E., and Montiel, M. (2005). Activation of MAP kinase by muscarinic cholinergic receptors induces cell proliferation and protein synthesis in human breast cancer cells. Journal of cellular physiology 204, 678-686.
Jonsson, E. G., Nothen, M. M., Gustavsson, J. P., Neidt, H., Brene, S., Tylec, A., Propping, P., and Sedvall, G. C. (1997). Lack of evidence for allelic association between personality traits and the dopamine D4 receptor gene polymorphisms. The American journal of psychiatry 154, 697699.
Jovanovic, V., Guan, H. C., and Van Tol, H. H. (1999). Comparative pharmacological and functional analysis of the human dopamine D4.2 and D4.10 receptor variants. Pharmacogenetics 9, 561-568.
Jungwirth, N., Haeberle, L., Schrott, K. M., Wullich, B., and Krause, F. S. (2008). Serotonin used as prognostic marker of urological tumors. World journal of urology 26, 499-504.
Kamakura, S., Iwaki, A., Matsumoto, M., and Fukumaki, Y. (1997). Cloning and characterization of the 5'-flanking region of the human dopamine D4 receptor gene. Biochemical and biophysical research communications 235, 321-326.
Kaneko, N., Okano, H., and Sawamoto, K. (2006). Role of the cholinergic system in regulating survival of newborn neurons in the adult mouse dentate gyrus and olfactory bulb. Genes to cells : devoted to molecular & cellular mechanisms 11, 1145-1159.
Kayahara, M., Nakagawara, H., Kitagawa, H., and Ohta, T. (2007). The nature of neural invasion by pancreatic cancer. Pancreas 35, 218-223.
Kazmi, M. A., Snyder, L. A., Cypess, A. M., Graber, S. G., and Sakmar, T. P. (2000). Selective reconstitution of human D4 dopamine receptor variants with Gi alpha subtypes. Biochemistry 39, 3734-3744.
Kebabian, J. W., and Calne, D. B. (1979). Multiple receptors for dopamine. Nature 277, 93-96.
Kebabian, J. W., and Greengard, P. (1971). Dopamine-sensitive adenyl cyclase: possible role in synaptic transmission. Science 174, 1346-1349.
Kempermann, G., and Gage, F. H. (1999). New nerve cells for the adult brain. Scientific American 280, 48-53.
Kenific, C. M., and Debnath, J. (2014). Cellular and metabolic functions for autophagy in cancer cells. Trends in cell biology.
Kim, S. Y., Choi, K. C., Chang, M. S., Kim, M. H., Kim, S. Y., Na, Y. S., Lee, J. E., Jin, B. K., Lee, B. H., and Baik, J. H. (2006). The dopamine D2 receptor regulates the development of dopaminergic neurons via extracellular signal-regulated kinase and Nurr1 activation. The Journal of neuroscience : the official journal of the Society for Neuroscience 26, 4567-4576.
Kim, Y., Kim, E., Wu, Q., Guryanova, O., Hitomi, M., Lathia, J. D., Serwanski, D., Sloan, A. E., Weil, R. J., Lee, J., et al. (2012). Platelet-derived growth factor receptors differentially inform intertumoral and intratumoral heterogeneity. Genes & development 26, 1247-1262.
Kimura, S., Noda, T., and Yoshimori, T. (2007). Dissection of the autophagosome maturation process by a novel reporter protein, tandem fluorescent-tagged LC3. Autophagy 3, 452-460.
Kippin, T. E., Kapur, S., and van der Kooy, D. (2005). Dopamine specifically inhibits forebrain neural stem cell proliferation, suggesting a novel effect of antipsychotic drugs. The Journal of neuroscience : the official journal of the Society for Neuroscience 25, 5815-5823.
Kitambi, S. S., Toledo, E. M., Usoskin, D., Wee, S., Harisankar, A., Svensson, R., Sigmundsson, K., Kalderen, C., Niklasson, M., Kundu, S., et al. (2014). Vulnerability of glioblastoma cells to catastrophic vacuolization and death induced by a small molecule. Cell 157, 313-328.
Kitayama, T., Yoneyama, M., and Yoneda, Y. (2003). Possible regulation by N-methyl-daspartate receptors of proliferative progenitor cells expressed in adult mouse hippocampal dentate gyrus. Journal of neurochemistry 84, 767-780.
Kotecha, S. A., Oak, J. N., Jackson, M. F., Perez, Y., Orser, B. A., Van Tol, H. H., and MacDonald, J. F. (2002). A D2 class dopamine receptor transactivates a receptor tyrosine kinase to inhibit NMDA receptor transmission. Neuron 35, 1111-1122.
Kowalczyk, T., Pontious, A., Englund, C., Daza, R. A., Bedogni, F., Hodge, R., Attardo, A., Bell, C., Huttner, W. B., and Hevner, R. F. (2009). Intermediate neuronal progenitors (basal progenitors) produce pyramidal-projection neurons for all layers of cerebral cortex. Cerebral cortex 19, 2439-2450.
Kreso, A., and Dick, J. E. (2014). Evolution of the cancer stem cell model. Cell stem cell 14, 275-291.
Kreso, A., O'Brien, C. A., van Galen, P., Gan, O. I., Notta, F., Brown, A. M., Ng, K., Ma, J., Wienholds, E., Dunant, C., et al. (2013). Variable clonal repopulation dynamics influence chemotherapy response in colorectal cancer. Science 339, 543-548.
Kriegstein, A., and Alvarez-Buylla, A. (2009). The glial nature of embryonic and adult neural stem cells. Annual review of neuroscience 32, 149-184.
Kumamoto, N., Gu, Y., Wang, J., Janoschka, S., Takemaru, K., Levine, J., and Ge, S. (2012). A role for primary cilia in glutamatergic synaptic integration of adult-born neurons. Nature neuroscience 15, 399-405, S391.
Kuznetsova, A. Y., and Deth, R. C. (2008). A model for modulation of neuronal synchronization by D4 dopamine receptor-mediated phospholipid methylation. Journal of computational neuroscience 24, 314-329.
Kwan, K. Y., Lam, M. M., Krsnik, Z., Kawasawa, Y. I., Lefebvre, V., and Sestan, N. (2008). SOX5 postmitotically regulates migration, postmigratory differentiation, and projections of subplate and deep-layer neocortical neurons. Proceedings of the National Academy of Sciences of the United States of America 105, 16021-16026.
LaHoste, G. J., Swanson, J. M., Wigal, S. B., Glabe, C., Wigal, T., King, N., and Kennedy, J. L. (1996). Dopamine D4 receptor gene polymorphism is associated with attention deficit hyperactivity disorder. Molecular psychiatry 1, 121-124.
Laks, D. R., Masterman-Smith, M., Visnyei, K., Angenieux, B., Orozco, N. M., Foran, I., Yong, W. H., Vinters, H. V., Liau, L. M., Lazareff, J. A., et al. (2009). Neurosphere formation is an independent predictor of clinical outcome in malignant glioma. Stem cells 27, 980-987.
Lalonde, F. M., and Myslobodsky, M. (2003). Are dopamine antagonists a risk factor for breast cancer? An answer from Parkinson's disease. Breast 12, 280-282.
Lam, K. S., Aman, M. G., and Arnold, L. E. (2006). Neurochemical correlates of autistic disorder: a review of the literature. Research in developmental disabilities 27, 254-289.
Lao, C. L., Lu, C. S., and Chen, J. C. (2013). Dopamine D3 receptor activation promotes neural stem/progenitor cell proliferation through AKT and ERK1/2 pathways and expands type-B and C cells in adult subventricular zone. Glia 61, 475-489.
Lapidot, T., Sirard, C., Vormoor, J., Murdoch, B., Hoang, T., Caceres-Cortes, J., Minden, M., Paterson, B., Caligiuri, M. A., and Dick, J. E. (1994). A cell initiating human acute myeloid leukaemia after transplantation into SCID mice. Nature 367, 645-648.
Lathia, J. D., Gallagher, J., Heddleston, J. M., Wang, J., Eyler, C. E., Macswords, J., Wu, Q., Vasanji, A., McLendon, R. E., Hjelmeland, A. B., and Rich, J. N. (2010). Integrin alpha 6 regulates glioblastoma stem cells. Cell stem cell 6, 421-432.
Lavine, N., Ethier, N., Oak, J. N., Pei, L., Liu, F., Trieu, P., Rebois, R. V., Bouvier, M., Hebert, T. E., and Van Tol, H. H. (2002). G protein-coupled receptors form stable complexes with inwardly rectifying potassium channels and adenylyl cyclase. The Journal of biological chemistry 277, 46010-46019.
Le Novere, N., Li, L., and Girault, J. A. (2008). DARPP-32: molecular integration of phosphorylation potential. Cellular and molecular life sciences : CMLS 65, 2125-2127.
Lee, J., Kotliarova, S., Kotliarov, Y., Li, A., Su, Q., Donin, N. M., Pastorino, S., Purow, B. W., Christopher, N., Zhang, W., et al. (2006). Tumor stem cells derived from glioblastomas cultured in bFGF and EGF more closely mirror the phenotype and genotype of primary tumors than do serum-cultured cell lines. Cancer cell 9, 391-403.
Lefkowitz, R. J., and Shenoy, S. K. (2005). Transduction of receptor signals by beta-arrestins. Science 308, 512-517.
Li, D., Sham, P. C., Owen, M. J., and He, L. (2006). Meta-analysis shows significant association between dopamine system genes and attention deficit hyperactivity disorder (ADHD). Human molecular genetics 15, 2276-2284.
Li, J., Zhu, S., Kozono, D., Ng, K., Futalan, D., Shen, Y., Akers, J. C., Steed, T., Kushwaha, D., Schlabach, M., et al. (2014). Genome-wide shRNA screen revealed integrated mitogenic signaling between dopamine receptor D2 (DRD2) and epidermal growth factor receptor (EGFR) in glioblastoma. Oncotarget.
Li, X., Lewis, M. T., Huang, J., Gutierrez, C., Osborne, C. K., Wu, M. F., Hilsenbeck, S. G., Pavlick, A., Zhang, X., Chamness, G. C., et al. (2008). Intrinsic resistance of tumorigenic breast cancer cells to chemotherapy. Journal of the National Cancer Institute 100, 672-679.
Lichter, J. B., Barr, C. L., Kennedy, J. L., Van Tol, H. H., Kidd, K. K., and Livak, K. J. (1993). A hypervariable segment in the human dopamine receptor D4 (DRD4) gene. Human molecular genetics 2, 767-773.
Lidow, M. S., Wang, F., Cao, Y., and Goldman-Rakic, P. S. (1998). Layer V neurons bear the majority of mRNAs encoding the five distinct dopamine receptor subtypes in the primate prefrontal cortex. Synapse 28, 10-20.
Liu, R., Wang, X., Chen, G. Y., Dalerba, P., Gurney, A., Hoey, T., Sherlock, G., Lewicki, J., Shedden, K., and Clarke, M. F. (2007). The prognostic role of a gene signature from tumorigenic breast-cancer cells. The New England journal of medicine 356, 217-226.
Liu, X., Wang, Q., Haydar, T. F., and Bordey, A. (2005). Nonsynaptic GABA signaling in postnatal subventricular zone controls proliferation of GFAP-expressing progenitors. Nature neuroscience 8, 1179-1187.
Lohse, M. J., Benovic, J. L., Codina, J., Caron, M. G., and Lefkowitz, R. J. (1990). beta-Arrestin: a protein that regulates beta-adrenergic receptor function. Science 248, 1547-1550.
Lopez-Bendito, G., Lujan, R., Shigemoto, R., Ganter, P., Paulsen, O., and Molnar, Z. (2003). Blockade of GABA(B) receptors alters the tangential migration of cortical neurons. Cerebral cortex 13, 932-942.
Lujan, R., Shigemoto, R., and Lopez-Bendito, G. (2005). Glutamate and GABA receptor signalling in the developing brain. Neuroscience 130, 567-580.
Lung, F. W., Tzeng, D. S., and Shu, B. C. (2002). Ethnic heterogeneity in allele variation in the DRD4 gene in schizophrenia. Schizophrenia research 57, 239-245.
Macey, T. A., Gurevich, V. V., and Neve, K. A. (2004). Preferential Interaction between the dopamine D2 receptor and Arrestin2 in neostriatal neurons. Molecular pharmacology 66, 16351642.
Mach, R. H., Smith, C. R., al-Nabulsi, I., Whirrett, B. R., Childers, S. R., and Wheeler, K. T. (1997). Sigma 2 receptors as potential biomarkers of proliferation in breast cancer. Cancer research 57, 156-161.
Magnon, C., Hall, S. J., Lin, J., Xue, X., Gerber, L., Freedland, S. J., and Frenette, P. S. (2013). Autonomic nerve development contributes to prostate cancer progression. Science 341, 1236361.
Martins, R. A., and Pearson, R. A. (2008). Control of cell proliferation by neurotransmitters in the developing vertebrate retina. Brain research 1192, 37-60.
Masur, K., Niggemann, B., Zanker, K. S., and Entschladen, F. (2001). Norepinephrine-induced migration of SW 480 colon carcinoma cells is inhibited by beta-blockers. Cancer research 61, 2866-2869.
Matsumoto, M., Hidaka, K., Tada, S., Tasaki, Y., and Yamaguchi, T. (1995). Full-length cDNA cloning and distribution of human dopamine D4 receptor. Brain research Molecular brain research 29, 157-162.
May, P., and May, E. (1999). Twenty years of p53 research: structural and functional aspects of the p53 protein. Oncogene 18, 7621-7636.
Meador-Woodruff, J. H., Grandy, D. K., Van Tol, H. H., Damask, S. P., Little, K. Y., Civelli, O., and Watson, S. J., Jr. (1994). Dopamine receptor gene expression in the human medial temporal lobe. Neuropsychopharmacology : official publication of the American College of Neuropsychopharmacology 10, 239-248.
Meador-Woodruff, J. H., Haroutunian, V., Powchik, P., Davidson, M., Davis, K. L., and Watson, S. J. (1997). Dopamine receptor transcript expression in striatum and prefrontal and occipital cortex. Focal abnormalities in orbitofrontal cortex in schizophrenia. Archives of general psychiatry 54, 1089-1095.
Menezes, M. E., Devine, D. J., Shevde, L. A., and Samant, R. S. (2012). Dickkopf1: a tumor suppressor or metastasis promoter? International journal of cancer Journal international du cancer 130, 1477-1483.
Merico, D., Isserlin, R., Stueker, O., Emili, A., and Bader, G. D. (2010). Enrichment map: a network-based method for gene-set enrichment visualization and interpretation. PloS one 5, e13984.
Merlos-Suarez, A., Barriga, F. M., Jung, P., Iglesias, M., Cespedes, M. V., Rossell, D., Sevillano, M., Hernando-Momblona, X., da Silva-Diz, V., Munoz, P., et al. (2011). The intestinal stem cell signature identifies colorectal cancer stem cells and predicts disease relapse. Cell stem cell 8, 511-524.
Mich, J. K., Signer, R. A., Nakada, D., Pineda, A., Burgess, R. J., Vue, T. Y., Johnson, J. E., and Morrison, S. J. (2014). Prospective identification of functionally distinct stem cells and neurosphere-initiating cells in adult mouse forebrain. eLife 3, e02669.
Ming, G. L., and Song, H. (2011). Adult neurogenesis in the mammalian brain: significant answers and significant questions. Neuron 70, 687-702.
Mir, S. U., Ahmed, I. S., Arnold, S., and Craven, R. J. (2012). Elevated progesterone receptor membrane component 1/sigma-2 receptor levels in lung tumors and plasma from lung cancer patients. International journal of cancer Journal international du cancer 131, E1-9.
Mirzadeh, Z., Merkle, F. T., Soriano-Navarro, M., Garcia-Verdugo, J. M., and Alvarez-Buylla, A. (2008). Neural stem cells confer unique pinwheel architecture to the ventricular surface in neurogenic regions of the adult brain. Cell stem cell 3, 265-278.
Missale, C., Nash, S. R., Robinson, S. W., Jaber, M., and Caron, M. G. (1998). Dopamine receptors: from structure to function. Physiological reviews 78, 189-225.
Mohapel, P., Leanza, G., Kokaia, M., and Lindvall, O. (2005). Forebrain acetylcholine regulates adult hippocampal neurogenesis and learning. Neurobiology of aging 26, 939-946.
Molnar, Z., and Cheung, A. F. (2006). Towards the classification of subpopulations of layer V pyramidal projection neurons. Neuroscience research 55, 105-115.
Molyneaux, B. J., Arlotta, P., Menezes, J. R., and Macklis, J. D. (2007). Neuronal subtype specification in the cerebral cortex. Nature reviews Neuroscience 8, 427-437.
Monsma, F. J., Jr., McVittie, L. D., Gerfen, C. R., Mahan, L. C., and Sibley, D. R. (1989). Multiple D2 dopamine receptors produced by alternative RNA splicing. Nature 342, 926-929.
Mrzljak, L., Bergson, C., Pappy, M., Huff, R., Levenson, R., and Goldman-Rakic, P. S. (1996). Localization of dopamine D4 receptors in GABAergic neurons of the primate brain. Nature 381, 245-248.
Murat, A., Migliavacca, E., Gorlia, T., Lambiv, W. L., Shay, T., Hamou, M. F., de Tribolet, N., Regli, L., Wick, W., Kouwenhoven, M. C., et al. (2008). Stem cell-related "self-renewal" signature and high epidermal growth factor receptor expression associated with resistance to concomitant chemoradiotherapy in glioblastoma. Journal of clinical oncology : official journal of the American Society of Clinical Oncology 26, 3015-3024.
Narkar, V. A., Hussain, T., Pedemonte, C., and Lokhandwala, M. F. (2001). Dopamine D(2) receptor activation causes mitogenesis via p44/42 mitogen-activated protein kinase in opossum kidney cells. Journal of the American Society of Nephrology : JASN 12, 1844-1852.
Nguyen, L., Malgrange, B., Breuskin, I., Bettendorff, L., Moonen, G., Belachew, S., and Rigo, J. M. (2003). Autocrine/paracrine activation of the GABA(A) receptor inhibits the proliferation of neurogenic polysialylated neural cell adhesion molecule-positive (PSA-NCAM ) precursor cells from postnatal striatum. The Journal of neuroscience : the official journal of the Society for Neuroscience 23, 3278-3294.
Nguyen, L., Rigo, J. M., Rocher, V., Belachew, S., Malgrange, B., Rogister, B., Leprince, P., and Moonen, G. (2001). Neurotransmitters as early signals for central nervous system development. Cell and tissue research 305, 187-202.
Nieto, M., Monuki, E. S., Tang, H., Imitola, J., Haubst, N., Khoury, S. J., Cunningham, J., Gotz, M., and Walsh, C. A. (2004). Expression of Cux-1 and Cux-2 in the subventricular zone and upper layers II-IV of the cerebral cortex. The Journal of comparative neurology 479, 168-180.
Nissan, M. H., Pratilas, C. A., Jones, A. M., Ramirez, R., Won, H., Liu, C., Tiwari, S., Kong, L., Hanrahan, A. J., Yao, Z., et al. (2014). Loss of NF1 in cutaneous melanoma is associated with RAS activation and MEK dependence. Cancer research 74, 2340-2350.
Nixon, R. A. (2013). The role of autophagy in neurodegenerative disease. Nature medicine 19, 983-997. Niznik, H. B., and Van Tol, H. H. (1992). Dopamine receptor genes: new tools for molecular psychiatry. Journal of psychiatry & neuroscience : JPN 17, 158-180.
Noctor, S. C., Flint, A. C., Weissman, T. A., Dammerman, R. S., and Kriegstein, A. R. (2001). Neurons derived from radial glial cells establish radial units in neocortex. Nature 409, 714-720.
Noctor, S. C., Martinez-Cerdeno, V., Ivic, L., and Kriegstein, A. R. (2004). Cortical neurons arise in symmetric and asymmetric division zones and migrate through specific phases. Nature neuroscience 7, 136-144.
Noushmehr, H., Weisenberger, D. J., Diefes, K., Phillips, H. S., Pujara, K., Berman, B. P., Pan, F., Pelloski, C. E., Sulman, E. P., Bhat, K. P., et al. (2010). Identification of a CpG island methylator phenotype that defines a distinct subgroup of glioma. Cancer cell 17, 510-522.
O'Brien, C. A., Pollett, A., Gallinger, S., and Dick, J. E. (2007). A human colon cancer cell capable of initiating tumour growth in immunodeficient mice. Nature 445, 106-110.
O'Keeffe, G. C., Tyers, P., Aarsland, D., Dalley, J. W., Barker, R. A., and Caldwell, M. A. (2009). Dopamine-induced proliferation of adult neural precursor cells in the mammalian subventricular zone is mediated through EGF. Proceedings of the National Academy of Sciences of the United States of America 106, 8754-8759.
Oak, J. N., Lavine, N., and Van Tol, H. H. (2001). Dopamine D(4) and D(2L) Receptor Stimulation of the Mitogen-Activated Protein Kinase Pathway Is Dependent on trans-Activation of the Platelet-Derived Growth Factor Receptor. Molecular pharmacology 60, 92-103.
Oak, J. N., Oldenhof, J., and Van Tol, H. H. (2000). The dopamine D(4) receptor: one decade of research. European journal of pharmacology 405, 303-327.
Ogden, A. T., Waziri, A. E., Lochhead, R. A., Fusco, D., Lopez, K., Ellis, J. A., Kang, J., Assanah, M., McKhann, G. M., Sisti, M. B., et al. (2008). Identification of A2B5 CD133- tumor-initiating cells in adult human gliomas. Neurosurgery 62, 505-514; discussion 514-505.
Ohgaki, H., and Kleihues, P. (2005). Population-based studies on incidence, survival rates, and genetic alterations in astrocytic and oligodendroglial gliomas. Journal of neuropathology and experimental neurology 64, 479-489.
Ohtani, N., Goto, T., Waeber, C., and Bhide, P. G. (2003). Dopamine modulates cell cycle in the lateral ganglionic eminence. The Journal of neuroscience : the official journal of the Society for Neuroscience 23, 2840-2850.
Oldenhof, J., Vickery, R., Anafi, M., Oak, J., Ray, A., Schoots, O., Pawson, T., von Zastrow, M., and Van Tol, H. H. (1998). SH3 binding domains in the dopamine D4 receptor. Biochemistry 37, 15726-15736.
Ortega, F., Gascon, S., Masserdotti, G., Deshpande, A., Simon, C., Fischer, J., Dimou, L., Chichung Lie, D., Schroeder, T., and Berninger, B. (2013). Oligodendrogliogenic and neurogenic adult subependymal zone neural stem cells constitute distinct lineages and exhibit differential responsiveness to Wnt signalling. Nature cell biology 15, 602-613.
Ostrom, Q. T., Gittleman, H., Farah, P., Ondracek, A., Chen, Y., Wolinsky, Y., Stroup, N. E., Kruchko, C., and Barnholtz-Sloan, J. S. (2013). CBTRUS statistical report: Primary brain and central nervous system tumors diagnosed in the United States in 2006-2010. Neuro-oncology 15 Suppl 2, ii1-56.
Padmalatha, C., Harruff, R. C., Ganick, D., and Hafez, G. B. (1980). Glioblastoma multiforme with tuberous sclerosis. Report of a case. Archives of pathology & laboratory medicine 104, 649650.
Paez-Gonzalez, P., Asrican, B., Rodriguez, E., and Kuo, C. T. (2014). Identification of distinct ChAT( ) neurons and activity-dependent control of postnatal SVZ neurogenesis. Nature neuroscience 17, 934-942.
Pallini, R., Ricci-Vitiani, L., Banna, G. L., Signore, M., Lombardi, D., Todaro, M., Stassi, G., Martini, M., Maira, G., Larocca, L. M., and De Maria, R. (2008). Cancer stem cell analysis and clinical outcome in patients with glioblastoma multiforme. Clinical cancer research : an official journal of the American Association for Cancer Research 14, 8205-8212.
Palm, D., and Entschladen, F. (2007). Neoneurogenesis and the neuro-neoplastic synapse. Progress in experimental tumor research 39, 91-98.
Parras, C. M., Schuurmans, C., Scardigli, R., Kim, J., Anderson, D. J., and Guillemot, F. (2002). Divergent functions of the proneural genes Mash1 and Ngn2 in the specification of neuronal subtype identity. Genes & development 16, 324-338.
Parsons, D. W., Jones, S., Zhang, X., Lin, J. C., Leary, R. J., Angenendt, P., Mankoo, P., Carter, H., Siu, I. M., Gallia, G. L., et al. (2008). An integrated genomic analysis of human glioblastoma multiforme. Science 321, 1807-1812.
Pasca, S. P., Portmann, T., Voineagu, I., Yazawa, M., Shcheglovitov, A., Pasca, A. M., Cord, B., Palmer, T. D., Chikahisa, S., Nishino, S., et al. (2011). Using iPSC-derived neurons to uncover cellular phenotypes associated with Timothy syndrome. Nature medicine 17, 1657-1662.
Phillips, H. S., Kharbanda, S., Chen, R., Forrest, W. F., Soriano, R. H., Wu, T. D., Misra, A., Nigro, J. M., Colman, H., Soroceanu, L., et al. (2006). Molecular subclasses of high-grade glioma predict prognosis, delineate a pattern of disease progression, and resemble stages in neurogenesis. Cancer cell 9, 157-173.
Pierce, G. B., Jr., Dixon, F. J., Jr., and Verney, E. L. (1960). Teratocarcinogenic and tissueforming potentials of the cell types comprising neoplastic embryoid bodies. Laboratory investigation; a journal of technical methods and pathology 9, 583-602.
Pierce, G. B., and Wallace, C. (1971). Differentiation of malignant to benign cells. Cancer research 31, 127-134.
Piomelli, D., Pilon, C., Giros, B., Sokoloff, P., Martres, M. P., and Schwartz, J. C. (1991). Dopamine activation of the arachidonic acid cascade as a basis for D1/D2 receptor synergism. Nature 353, 164-167.
Pivonello, R., Ferone, D., Lombardi, G., Colao, A., Lamberts, S. W., and Hofland, L. J. (2007). Novel insights in dopamine receptor physiology. European journal of endocrinology / European Federation of Endocrine Societies 156 Suppl 1, S13-21.
Platel, J. C., Dave, K. A., Gordon, V., Lacar, B., Rubio, M. E., and Bordey, A. (2010). NMDA receptors activated by subventricular zone astrocytic glutamate are critical for neuroblast survival prior to entering a synaptic network. Neuron 65, 859-872.
Pleasure, S. J., Collins, A. E., and Lowenstein, D. H. (2000). Unique expression patterns of cell fate molecules delineate sequential stages of dentate gyrus development. The Journal of neuroscience : the official journal of the Society for Neuroscience 20, 6095-6105.
Pollard, S. M., Yoshikawa, K., Clarke, I. D., Danovi, D., Stricker, S., Russell, R., Bayani, J., Head, R., Lee, M., Bernstein, M., et al. (2009). Glioma stem cell lines expanded in adherent culture have tumor-specific phenotypes and are suitable for chemical and genetic screens. Cell stem cell 4, 568-580.
Ponti, G., Obernier, K., Guinto, C., Jose, L., Bonfanti, L., and Alvarez-Buylla, A. (2013). Cell cycle and lineage progression of neural progenitors in the ventricular-subventricular zones of adult mice. Proceedings of the National Academy of Sciences of the United States of America 110, E1045-1054.
Primus, R. J., Thurkauf, A., Xu, J., Yevich, E., McInerney, S., Shaw, K., Tallman, J. F., and Gallagher, D. W. (1997). II. Localization and characterization of dopamine D4 binding sites in rat and human brain by use of the novel, D4 receptor-selective ligand [3H]NGD 94-1. The Journal of pharmacology and experimental therapeutics 282, 1020-1027.
Prince, M. E., Sivanandan, R., Kaczorowski, A., Wolf, G. T., Kaplan, M. J., Dalerba, P., Weissman, I. L., Clarke, M. F., and Ailles, L. E. (2007). Identification of a subpopulation of cells with cancer stem cell properties in head and neck squamous cell carcinoma. Proceedings of the National Academy of Sciences of the United States of America 104, 973-978.
Quintana, E., Shackleton, M., Sabel, M. S., Fullen, D. R., Johnson, T. M., and Morrison, S. J. (2008). Efficient tumour formation by single human melanoma cells. Nature 456, 593-598.
Quirion, R., Bowen, W. D., Itzhak, Y., Junien, J. L., Musacchio, J. M., Rothman, R. B., Su, T. P., Tam, S. W., and Taylor, D. P. (1992). A proposal for the classification of sigma binding sites. Trends in pharmacological sciences 13, 85-86.
Rakic, P. (1972). Mode of cell migration to the superficial layers of fetal monkey neocortex. The Journal of comparative neurology 145, 61-83. Rakic, P. (1978). Neuronal migration and contact guidance in the primate telencephalon. Postgraduate medical journal 54 Suppl 1, 25-40.
Rao, P. A., Pickar, D., Gejman, P. V., Ram, A., Gershon, E. S., and Gelernter, J. (1994). Allelic variation in the D4 dopamine receptor (DRD4) gene does not predict response to clozapine. Archives of general psychiatry 51, 912-917.
Rehn, A. E., and Rees, S. M. (2005). Investigating the neurodevelopmental hypothesis of schizophrenia. Clinical and experimental pharmacology & physiology 32, 687-696.
Rivera, A., Cuellar, B., Giron, F. J., Grandy, D. K., de la Calle, A., and Moratalla, R. (2002). Dopamine D4 receptors are heterogeneously distributed in the striosomes/matrix compartments of the striatum. Journal of neurochemistry 80, 219-229.
Rodolfo, C., Di Bartolomeo, S., and Cecconi, F. (2015). Autophagy in stem and progenitor cells. Cellular and molecular life sciences : CMLS.
Ronai, Z., Barta, C., Guttman, A., Lakatos, K., Gervai, J., Staub, M., and Sasvari-Szekely, M. (2001). Genotyping the -521C/T functional polymorphism in the promoter region of dopamine D4 receptor (DRD4) gene. Electrophoresis 22, 1102-1105.
Rondou, P., Haegeman, G., and Van Craenenbroeck, K. (2010). The dopamine D4 receptor: biochemical and signalling properties. Cellular and molecular life sciences : CMLS 67, 19711986.
Rondou, P., Haegeman, G., Vanhoenacker, P., and Van Craenenbroeck, K. (2008). BTB Protein KLHL12 targets the dopamine D4 receptor for ubiquitination by a Cul3-based E3 ligase. The Journal of biological chemistry 283, 11083-11096.
Rubinstein, M., Cepeda, C., Hurst, R. S., Flores-Hernandez, J., Ariano, M. A., Falzone, T. L., Kozell, L. B., Meshul, C. K., Bunzow, J. R., Low, M. J., et al. (2001). Dopamine D4 receptordeficient mice display cortical hyperexcitability. The Journal of neuroscience : the official journal of the Society for Neuroscience 21, 3756-3763.
Rubinstein, M., Phillips, T. J., Bunzow, J. R., Falzone, T. L., Dziewczapolski, G., Zhang, G., Fang, Y., Larson, J. L., McDougall, J. A., Chester, J. A., et al. (1997). Mice lacking dopamine D4 receptors are supersensitive to ethanol, cocaine, and methamphetamine. Cell 90, 991-1001.
Sachlos, E., Risueno, R. M., Laronde, S., Shapovalova, Z., Lee, J. H., Russell, J., Malig, M., McNicol, J. D., Fiebig-Comyn, A., Graham, M., et al. (2012). Identification of drugs including a dopamine receptor antagonist that selectively target cancer stem cells. Cell 149, 1284-1297.
Sahara, S., and O'Leary, D. D. (2009). Fgf10 regulates transition period of cortical stem cell differentiation to radial glia controlling generation of neurons and basal progenitors. Neuron 63, 48-62.
Santini, E., Heiman, M., Greengard, P., Valjent, E., and Fisone, G. (2009). Inhibition of mTOR signaling in Parkinson's disease prevents L-DOPA-induced dyskinesia. Science signaling 2, ra36.
Sarkar, C., Das, S., Chakroborty, D., Chowdhury, U. R., Basu, B., Dasgupta, P. S., and Basu, S. (2006). Cutting Edge: Stimulation of dopamine D4 receptors induce T cell quiescence by upregulating Kruppel-like factor-2 expression through inhibition of ERK1/ERK2 phosphorylation. Journal of immunology 177, 7525-7529.
Sarkar, S., Carroll, B., Buganim, Y., Maetzel, D., Ng, A. H., Cassady, J. P., Cohen, M. A., Chakraborty, S., Wang, H., Spooner, E., et al. (2013). Impaired autophagy in the lipid-storage disorder Niemann-Pick type C1 disease. Cell reports 5, 1302-1315.
Sarrouilhe, D., Clarhaut, J., Defamie, N., and Mesnil, M. (2015). Serotonin and cancer: what is the link? Current molecular medicine 15, 62-77.
Schaeren-Wiemers, N., Andre, E., Kapfhammer, J. P., and Becker-Andre, M. (1997). The expression pattern of the orphan nuclear receptor RORbeta in the developing and adult rat nervous system suggests a role in the processing of sensory information and in circadian rhythm. The European journal of neuroscience 9, 2687-2701.
Schlett, K. (2006). Glutamate as a modulator of embryonic and adult neurogenesis. Current topics in medicinal chemistry 6, 949-960.
Schuller, H. M. (1989). Cell type specific, receptor-mediated modulation of growth kinetics in human lung cancer cell lines by nicotine and tobacco-related nitrosamines. Biochemical pharmacology 38, 3439-3442.
Schuller, H. M. (2008). Neurotransmission and cancer: implications for prevention and therapy. Anti-cancer drugs 19, 655-671.
Seeman, P. (2006). Targeting the dopamine D2 receptor in schizophrenia. Expert opinion on therapeutic targets 10, 515-531.
Seeman, P., Guan, H. C., and Van Tol, H. H. (1993). Dopamine D4 receptors elevated in schizophrenia. Nature 365, 441-445.
Seifert, P., Benedic, M., and Effert, P. (2002). Nerve fibers in tumors of the human urinary bladder. Virchows Archiv : an international journal of pathology 440, 291-297.
Seri, B., Garcia-Verdugo, J. M., McEwen, B. S., and Alvarez-Buylla, A. (2001). Astrocytes give rise to new neurons in the adult mammalian hippocampus. The Journal of neuroscience : the official journal of the Society for Neuroscience 21, 7153-7160.
Sessa, A., Mao, C. A., Hadjantonakis, A. K., Klein, W. H., and Broccoli, V. (2008). Tbr2 directs conversion of radial glia into basal precursors and guides neuronal amplification by indirect neurogenesis in the developing neocortex. Neuron 60, 56-69.
Shchors, K., Massaras, A., and Hanahan, D. (2015). Dual Targeting of the Autophagic Regulatory Circuitry in Gliomas with Repurposed Drugs Elicits Cell-Lethal Autophagy and Therapeutic Benefit. Cancer cell 28, 456-471.
Siddiqui, E. J., Thompson, C. S., Mikhailidis, D. P., and Mumtaz, F. H. (2005). The role of serotonin in tumour growth (review). Oncology reports 14, 1593-1597.
Singh, S. K., Clarke, I. D., Terasaki, M., Bonn, V. E., Hawkins, C., Squire, J., and Dirks, P. B. (2003). Identification of a cancer stem cell in human brain tumors. Cancer research 63, 58215828.
Singh, S. K., Hawkins, C., Clarke, I. D., Squire, J. A., Bayani, J., Hide, T., Henkelman, R. M., Cusimano, M. D., and Dirks, P. B. (2004). Identification of human brain tumour initiating cells. Nature 432, 396-401.
Soda, T., Nakashima, R., Watanabe, D., Nakajima, K., Pastan, I., and Nakanishi, S. (2003). Segregation and coactivation of developing neocortical layer 1 neurons. The Journal of neuroscience : the official journal of the Society for Neuroscience 23, 6272-6279.
Sokoloff, P., Diaz, J., Le Foll, B., Guillin, O., Leriche, L., Bezard, E., and Gross, C. (2006). The dopamine D3 receptor: a therapeutic target for the treatment of neuropsychiatric disorders. CNS & neurological disorders drug targets 5, 25-43.
Son, M. J., Woolard, K., Nam, D. H., Lee, J., and Fine, H. A. (2009). SSEA-1 is an enrichment marker for tumor-initiating cells in human glioblastoma. Cell stem cell 4, 440-452.
Song, J., Zhong, C., Bonaguidi, M. A., Sun, G. J., Hsu, D., Gu, Y., Meletis, K., Huang, Z. J., Ge, S., Enikolopov, G., et al. (2012). Neuronal circuitry mechanism regulating adult quiescent neural stem-cell fate decision. Nature 489, 150-154.
Sotelo, J., Briceno, E., and Lopez-Gonzalez, M. A. (2006). Adding chloroquine to conventional treatment for glioblastoma multiforme: a randomized, double-blind, placebo-controlled trial. Annals of internal medicine 144, 337-343.
Spano, P. F., Govoni, S., and Trabucchi, M. (1978). Studies on the pharmacological properties of dopamine receptors in various areas of the central nervous system. Advances in biochemical psychopharmacology 19, 155-165.
Spinelli, V., Chinot, O., Cabaniols, C., Giorgi, R., Alla, P., and Lehucher-Michel, M. P. (2010). Occupational and environmental risk factors for brain cancer: a pilot case-control study in France. Presse medicale 39, e35-44.
Spooren, A., Rondou, P., Debowska, K., Lintermans, B., Vermeulen, L., Samyn, B., Skieterska, K., Debyser, G., Devreese, B., Vanhoenacker, P., et al. (2010). Resistance of the dopamine D4 receptor to agonist-induced internalization and degradation. Cellular signalling 22, 600-609.
Stupp, R., Mason, W. P., van den Bent, M. J., Weller, M., Fisher, B., Taphoorn, M. J., Belanger, K., Brandes, A. A., Marosi, C., Bogdahn, U., et al. (2005). Radiotherapy plus concomitant and adjuvant temozolomide for glioblastoma. The New England journal of medicine 352, 987-996.
Subramanian, A., Tamayo, P., Mootha, V. K., Mukherjee, S., Ebert, B. L., Gillette, M. A., Paulovich, A., Pomeroy, S. L., Golub, T. R., Lander, E. S., and Mesirov, J. P. (2005). Gene set enrichment analysis: a knowledge-based approach for interpreting genome-wide expression profiles. Proceedings of the National Academy of Sciences of the United States of America 102, 15545-15550.
Sun, G. J., Zhou, Y., Stadel, R. P., Moss, J., Yong, J. H., Ito, S., Kawasaki, N. K., Phan, A. T., Oh, J. H., Modak, N., et al. (2015). Tangential migration of neuronal precursors of glutamatergic neurons in the adult mammalian brain. Proceedings of the National Academy of Sciences of the United States of America 112, 9484-9489.
Suter, D. M., Tirefort, D., Julien, S., and Krause, K. H. (2009). A Sox1 to Pax6 switch drives neuroectoderm to radial glia progression during differentiation of mouse embryonic stem cells. Stem cells 27, 49-58.
Svenningsson, P., Nishi, A., Fisone, G., Girault, J. A., Nairn, A. C., and Greengard, P. (2004). DARPP-32: an integrator of neurotransmission. Annual review of pharmacology and toxicology 44, 269-296.
Swift, J. L., Godin, A. G., Dore, K., Freland, L., Bouchard, N., Nimmo, C., Sergeev, M., De Koninck, Y., Wiseman, P. W., and Beaulieu, J. M. (2011). Quantification of receptor tyrosine kinase transactivation through direct dimerization and surface density measurements in single cells. Proceedings of the National Academy of Sciences of the United States of America 108, 7016-7021.
Talkowski, M. E., Kirov, G., Bamne, M., Georgieva, L., Torres, G., Mansour, H., Chowdari, K. V., Milanova, V., Wood, J., McClain, L., et al. (2008). A network of dopaminergic gene variations implicated as risk factors for schizophrenia. Human molecular genetics 17, 747-758.
Tanaka, T., Igarashi, S., Onodera, O., Tanaka, H., Kameda, K., Takahashi, K., Tsuji, S., and Ihda, S. (1995). Lack of association between dopamine D4 receptor gene and schizophrenia. American journal of medical genetics 60, 580-582.
Thaker, P. H., Han, L. Y., Kamat, A. A., Arevalo, J. M., Takahashi, R., Lu, C., Jennings, N. B., Armaiz-Pena, G., Bankson, J. A., Ravoori, M., et al. (2006). Chronic stress promotes tumor growth and angiogenesis in a mouse model of ovarian carcinoma. Nature medicine 12, 939-944.
Tong, C. K., Chen, J., Cebrian-Silla, A., Mirzadeh, Z., Obernier, K., Guinto, C. D., Tecott, L. H., Garcia-Verdugo, J. M., Kriegstein, A., and Alvarez-Buylla, A. (2014). Axonal control of the adult neural stem cell niche. Cell stem cell 14, 500-511.
Tropepe, V., Sibilia, M., Ciruna, B. G., Rossant, J., Wagner, E. F., and van der Kooy, D. (1999). Distinct neural stem cells proliferate in response to EGF and FGF in the developing mouse telencephalon. Developmental biology 208, 166-188.
Tsang, W. Y., and Chan, J. K. (1992). Neural invasion in intraductal carcinoma of the breast. Human pathology 23, 202-204.
Uchida, N., Buck, D. W., He, D., Reitsma, M. J., Masek, M., Phan, T. V., Tsukamoto, A. S., Gage, F. H., and Weissman, I. L. (2000). Direct isolation of human central nervous system stem cells. Proceedings of the National Academy of Sciences of the United States of America 97, 14720-14725.
Unland, R., Kerl, K., Schlosser, S., Farwick, N., Plagemann, T., Lechtape, B., Clifford, S. C., Kreth, J. H., Gerss, J., Muhlisch, J., et al. (2013). Epigenetic repression of the dopamine receptor D4 in pediatric tumors of the central nervous system. Journal of neuro-oncology.
Valerio, A., Belloni, M., Gorno, M. L., Tinti, C., Memo, M., and Spano, P. (1994). Dopamine D2, D3, and D4 receptor mRNA levels in rat brain and pituitary during aging. Neurobiology of aging 15, 713-719.
Valjent, E., Bertran-Gonzalez, J., Bowling, H., Lopez, S., Santini, E., Matamales, M., BonitoOliva, A., Herve, D., Hoeffer, C., Klann, E., et al. (2011). Haloperidol regulates the state of phosphorylation of ribosomal protein S6 via activation of PKA and phosphorylation of DARPP32. Neuropsychopharmacology : official publication of the American College of Neuropsychopharmacology 36, 2561-2570.
Vallone, D., Picetti, R., and Borrelli, E. (2000). Structure and function of dopamine receptors. Neuroscience and biobehavioral reviews 24, 125-132.
Van Craenenbroeck, K., Borroto-Escuela, D. O., Romero-Fernandez, W., Skieterska, K., Rondou, P., Lintermans, B., Vanhoenacker, P., Fuxe, K., Ciruela, F., and Haegeman, G. (2011). Dopamine D4 receptor oligomerization--contribution to receptor biogenesis. The FEBS journal 278, 1333-1344.
Van Craenenbroeck, K., Gellynck, E., Lintermans, B., Leysen, J. E., Van Tol, H. H., Haegeman, G., and Vanhoenacker, P. (2006). Influence of the antipsychotic drug pipamperone on the expression of the dopamine D4 receptor. Life sciences 80, 74-81.
Van Tol, H. H., Bunzow, J. R., Guan, H. C., Sunahara, R. K., Seeman, P., Niznik, H. B., and Civelli, O. (1991). Cloning of the gene for a human dopamine D4 receptor with high affinity for the antipsychotic clozapine. Nature 350, 610-614.
Van Tol, H. H., Wu, C. M., Guan, H. C., Ohara, K., Bunzow, J. R., Civelli, O., Kennedy, J., Seeman, P., Niznik, H. B., and Jovanovic, V. (1992). Multiple dopamine D4 receptor variants in the human population. Nature 358, 149-152.
van Waarde, A., Rybczynska, A. A., Ramakrishnan, N., Ishiwata, K., Elsinga, P. H., and Dierckx, R. A. (2010). Sigma receptors in oncology: therapeutic and diagnostic applications of sigma ligands. Current pharmaceutical design 16, 3519-3537.
Vance, J. E. (2006). Lipid imbalance in the neurological disorder, Niemann-Pick C disease. FEBS letters 580, 5518-5524.
Vanner, R. J., Remke, M., Gallo, M., Selvadurai, H. J., Coutinho, F., Lee, L., Kushida, M., Head, R., Morrissy, S., Zhu, X., et al. (2014). Quiescent sox2( ) cells drive hierarchical growth and relapse in sonic hedgehog subgroup medulloblastoma. Cancer cell 26, 33-47.
Venkatesh, H. S., Johung, T. B., Caretti, V., Noll, A., Tang, Y., Nagaraja, S., Gibson, E. M., Mount, C. W., Polepalli, J., Mitra, S. S., et al. (2015). Neuronal Activity Promotes Glioma Growth through Neuroligin-3 Secretion. Cell.
Ventura, S., Pennefather, J., and Mitchelson, F. (2002). Cholinergic innervation and function in the prostate gland. Pharmacology & therapeutics 94, 93-112.
Verhaak, R. G., Hoadley, K. A., Purdom, E., Wang, V., Qi, Y., Wilkerson, M. D., Miller, C. R., Ding, L., Golub, T., Mesirov, J. P., et al. (2010). Integrated genomic analysis identifies clinically relevant subtypes of glioblastoma characterized by abnormalities in PDGFRA, IDH1, EGFR, and NF1. Cancer cell 17, 98-110.
Vilner, B. J., John, C. S., and Bowen, W. D. (1995). Sigma-1 and sigma-2 receptors are expressed in a wide variety of human and rodent tumor cell lines. Cancer research 55, 408-413.
Wakade, C. G., Mahadik, S. P., Waller, J. L., and Chiu, F. C. (2002). Atypical neuroleptics stimulate neurogenesis in adult rat brain. Journal of neuroscience research 69, 72-79.
Wang, C., Liang, C. C., Bian, Z. C., Zhu, Y., and Guan, J. L. (2013). FIP200 is required for maintenance and differentiation of postnatal neural stem cells. Nature neuroscience 16, 532-542.
Wang, J., Sakariassen, P. O., Tsinkalovsky, O., Immervoll, H., Boe, S. O., Svendsen, A., Prestegarden, L., Rosland, G., Thorsen, F., Stuhr, L., et al. (2008). CD133 negative glioma cells form tumors in nude rats and give rise to CD133 positive cells. International journal of cancer Journal international du cancer 122, 761-768.
Wang, X., Zhong, P., and Yan, Z. (2002). Dopamine D4 receptors modulate GABAergic signaling in pyramidal neurons of prefrontal cortex. The Journal of neuroscience : the official journal of the Society for Neuroscience 22, 9185-9193.
Weddle, D. L., Tithoff, P., Williams, M., and Schuller, H. M. (2001). Beta-adrenergic growth regulation of human cancer cell lines derived from pancreatic ductal carcinomas. Carcinogenesis 22, 473-479.
Wedemeyer, C., Goutman, J. D., Avale, M. E., Franchini, L. F., Rubinstein, M., and Calvo, D. J. (2007). Functional activation by central monoamines of human dopamine D(4) receptor polymorphic variants coupled to GIRK channels in Xenopus oocytes. European journal of pharmacology 562, 165-173.
Whitaker-Azmitia, P. M. (1991). Role of serotonin and other neurotransmitter receptors in brain development: basis for developmental pharmacology. Pharmacological reviews 43, 553-561.
Winner, B., Desplats, P., Hagl, C., Klucken, J., Aigner, R., Ploetz, S., Laemke, J., Karl, A., Aigner, L., Masliah, E., et al. (2009). Dopamine receptor activation promotes adult neurogenesis in an acute Parkinson model. Experimental neurology 219, 543-552.
Witter, M. P. (2007). The perforant path: projections from the entorhinal cortex to the dentate gyrus. Progress in brain research 163, 43-61.
Wong, H. P., Yu, L., Lam, E. K., Tai, E. K., Wu, W. K., and Cho, C. H. (2007). Nicotine promotes cell proliferation via alpha7-nicotinic acetylcholine receptor and catecholaminesynthesizing enzymes-mediated pathway in human colon adenocarcinoma HT-29 cells. Toxicology and applied pharmacology 221, 261-267.
Xu, J., Zeng, C., Chu, W., Pan, F., Rothfuss, J. M., Zhang, F., Tu, Z., Zhou, D., Zeng, D., Vangveravong, S., et al. (2011). Identification of the PGRMC1 protein complex as the putative sigma-2 receptor binding site. Nature communications 2, 380.
Yang, M. C., Wang, H. C., Hou, Y. C., Tung, H. L., Chiu, T. J., and Shan, Y. S. (2015). Blockade of autophagy reduces pancreatic cancer stem cell activity and potentiates the tumoricidal effect of gemcitabine. Molecular cancer 14, 179.
Yang, P., Arnold, S. A., Habas, A., Hetman, M., and Hagg, T. (2008). Ciliary neurotrophic factor mediates dopamine D2 receptor-induced CNS neurogenesis in adult mice. The Journal of neuroscience : the official journal of the Society for Neuroscience 28, 2231-2241.
Yazdankhah, M., Farioli-Vecchioli, S., Tonchev, A. B., Stoykova, A., and Cecconi, F. (2014). The autophagy regulators Ambra1 and Beclin 1 are required for adult neurogenesis in the brain subventricular zone. Cell death & disease 5, e1403.
Yeh, C. T., Wu, A. T., Chang, P. M., Chen, K. Y., Yang, C. N., Yang, S. C., Ho, C. C., Chen, C. C., Kuo, Y. L., Lee, P. Y., et al. (2012). Trifluoperazine, an antipsychotic agent, inhibits cancer stem cell growth and overcomes drug resistance of lung cancer. American journal of respiratory and critical care medicine 186, 1180-1188.
Yoneshima, H., Yamasaki, S., Voelker, C. C., Molnar, Z., Christophe, E., Audinat, E., Takemoto, M., Nishiwaki, M., Tsuji, S., Fujita, I., and Yamamoto, N. (2006). Er81 is expressed in a subpopulation of layer 5 neurons in rodent and primate neocortices. Neuroscience 137, 401412.
Yoon, S., and Baik, J. H. (2013). Dopamine D2 receptor-mediated epidermal growth factor receptor transactivation through a disintegrin and metalloprotease regulates dopaminergic neuron development via extracellular signal-related kinase activation. The Journal of biological chemistry 288, 28435-28446.
Yue, W., Hamai, A., Tonelli, G., Bauvy, C., Nicolas, V., Tharinger, H., Codogno, P., and Mehrpour, M. (2013). Inhibition of the autophagic flux by salinomycin in breast cancer stemlike/progenitor cells interferes with their maintenance. Autophagy 9, 714-729.
Zhao, C. M., Hayakawa, Y., Kodama, Y., Muthupalani, S., Westphalen, C. B., Andersen, G. T., Flatberg, A., Johannessen, H., Friedman, R. A., Renz, B. W., et al. (2014). Denervation suppresses gastric tumorigenesis. Science translational medicine 6, 250ra115.
Zhao, S., Nichols, J., Smith, A. G., and Li, M. (2004). SoxB transcription factors specify neuroectodermal lineage choice in ES cells. Molecular and cellular neurosciences 27, 332-342.
Zhen, X., Zhang, J., Johnson, G. P., and Friedman, E. (2001). D(4) dopamine receptor differentially regulates Akt/nuclear factor-kappa b and extracellular signal-regulated kinase pathways in D(4)MN9D cells. Molecular pharmacology 60, 857-864.
Zhong, Y., Takemoto, M., Fukuda, T., Hattori, Y., Murakami, F., Nakajima, D., Nakayama, M., and Yamamoto, N. (2004). Identification of the genes that are expressed in the upper layers of the neocortex. Cerebral cortex 14, 1144-1152.
Cite This Work
To export a reference to this article please select a referencing stye below:
Related Services
View all


Related Content
All TagsContent relating to: "Biomedical Science"
Biomedical Science focuses on how cells, organs and systems function in the human body and underpins much of modern medicine. Biomedical Science applies parts of natural and/or formal sciences to help develop advances in healthcare.
Related Articles

DMCA / Removal Request
If you are the original writer of this dissertation and no longer wish to have your work published on the UKDiss.com website then please: