Evaluation Mumbai Real Estate Market
Info: 8949 words (36 pages) Dissertation
Published: 13th Dec 2019
Tagged: EconomicsReal Estate
Chapter 1 – Introduction
Introduction to Mumbai Market
Mumbai Metropolitan Region (MMR) is the largest conurbation in India with a population of 20.7 million. Due to such huge population MMR is also one of the biggest real estate markets in the country. The market can be divided into six major sub regions as shown below.
Figure 1: Mumbai Metropolitan Region – Real estate markets
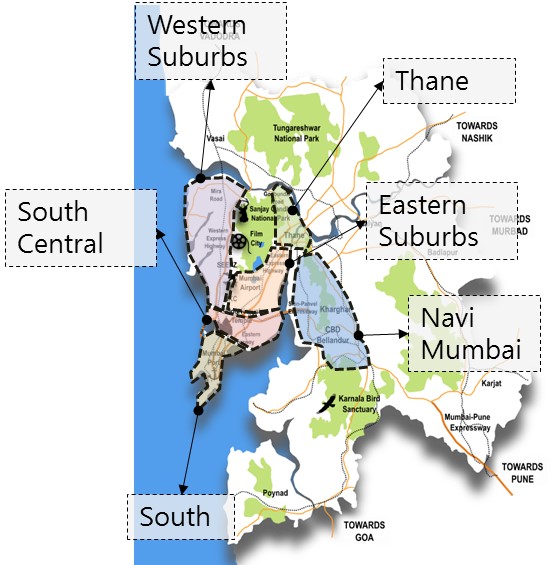
Source – Commonfloor.com, Cushman and Wakefield India
The prominent localities or micro markets which come under these sub regions are listed below.
- Mumbai South – The major localities include Cuffe Parade, Colaba, Nariman Point, Fort, Malabar Hill, Churchgate among others.
- South Central – The major localities include Lower Parel, Worli, Dadar, Wadala, Matunga, Prabhadevi, Mahim, among others.
- Western Suburbs – The major localities include Bandra, Andheri, Malad, Khar, Goregaon, Kandivli, Borivali, among others.
- Eastern Suburbs – The major localities include Chembur, Powai, Ghatkopar, Bhandup, Mulund, among others.
- Thane – Thane is a satellite city to Mumbai and the major localities in Thane include Ghodbunder road, Majiwada, Bhiwandi, Kalwa, Dighe, among others.
- Navi Mumbai – Navi Mumbai is also a satellite city to Mumbai and the major localities there include Vashi, Kharghar, Airoli, Ghansoli, Sanpada, Panvel, Ulwe, among others.
Mumbai realty market update – Q4 2016
The skyrocketing prices of Mumbai have deterred the consumer sentiments for past 1-2 years. The overall real estate activity in the region in Q4 2016 as compared to the earlier quarter. The unit launches continued to decline and dropped by almost 16% from the previous quarter and stood at 5,700[1]. The recent demonetization also prompted the developers to adopt a cautious approach towards launching new projects.
Thane continued to attract most of the launches in the MMR (40%) and was followed by Eastern suburbs (28%) and Western suburbs (23%)[2]. Project launches in the southern sub regions have subdued in the recent years due to high land values and unavailability of large land parcels. 1 and 2 Bedroom Hall Kitchen (BHK) units together comprised of 74% of the launches. Segment wise, the launches can be classified into three major segments based on the ticket prices of the units such as
- Affordable – INR 0 – 6 million
- Mid Segment – INR 6 million – 12 million
- High End – above INR 12 million
Nearly 80% of the unit launches were witnessed in the mid segment, followed by the high-end segment (20%)[3]. It is interesting to note that the affordable segment did not witness any launches in this quarter. Thane also recorded the maximum share of launches in the mid segment at 49% share followed by Eastern and western suburbs. Meanwhile, the high-end segment launches were equally spread across Eastern suburbs and South central sub regions.
Simultaneously the capital values continued to remain range-bound across all submarkets during the quarter as buyers and sellers are in a wait-and-watch mode to realize the complete impact of demonetization. The current capital values across various sub regions are shown below.
Table 1: Mumbai – Capital Values, Q4 2016
| High End Segment | |||
| Sub Region | Average quoted rate (INR/sqft) | Y-o-Y Change (%) | Short Term Outlook |
| South | 40,000 – 83,000 | 0% | Stable |
| South Central | 23,000 – 80,000 | 0% | Stable |
| Eastern Suburbs | 12,000 – 40,000 | 0% | Stable |
| Western Suburbs | 12,000 – 50,000 | -6 % | Stable |
| Mid Segment | |||
| Eastern Suburbs | 10,000 -25,000 | 0% | Stable |
| Western Suburbs | 9,000 – 26,000 | 0% | Stable |
| Thane | 7,000 – 14,000 | 0% | Stable |
| Navi Mumbai | 5,000 – 15,000 | 0% | Stable |
Source – Cushman and Wakefield India
Mumbai – Investment Outlook
Over the last decade, real estate investments have seen a sharp growth trajectory in India. With the coming of a stable and pro-business government at the centre, strong GDP growth rate and strong economic outlook have reinstated confidence among investors, enabling them to increase their exposure to the real estate sector in India.
The real estate sector attracted almost USD 4.2 Bn worth of investments in 2016. The residential assets accounted for 54% of the total investments in the real estate sector with investments worth USD 2.25 Bn. In terms of geographic preference, Mumbai remained the top city attracting 41% of the total investments in residential sector. Mumbai received investments worth USD 930 Mn, as increase of 56% over last year. The share of investments among the top 8 cities in India are show below.[4]
Figure 2: Pan India share of residential investments, 2016
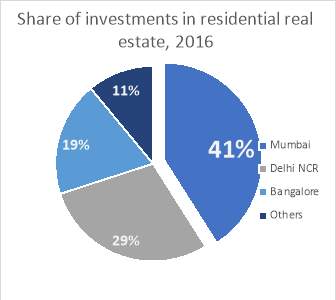
Source – Cushman and Wakefield India
The demand for residential spaces in cities is expected to increase as the levels of urbanization is expected to accelerate from 31% in 2011 to 40% by 2030. Also, government schemes like “Make in India”, “Smart City Project”, “Industrial Corridors (DMIC, AKIC) are expected to fuel tremendous demographic shift by reducing the dependence on agriculture and provide better employment opportunities in the urban centres across India. This will result in rapid migration, increase in per capita income and change in urban demographics which will in turn fuel the real estate demand in the Indian cities.
As per Cushman & Wakefield’s estimates, total urban housing demand is expected to reach 4.2 million units during 2017 – 2020. Mumbai is expected to see a cumulative demand of almost 700,000 units during the same period and will account for 17% share among the top Indian cities. However, as per the current pace of project launches and recent events, Mumbai is expected to witness a supply of 200,000 units during 2017 – 2020. Thus, there will be a huge demand and supply gap of housing by 2020 and therefore this provides with the need to study project financing methods and scenarios prevalent in Mumbai as developers will require funding to launch new projects to match this demand – supply mismatch.
Need for study
The background study of Mumbai’s real estate sector sets the stage for the requirement of the study of real estate financing strategies. The major proponents for this study are as follows.
- Mumbai still remains the most attractive real estate investment destination in India.
- Demand and supply gap – Developers will need financing to come up with new projects to meet the demand.
- Better understanding of financing structures prevalent in the industry.
- Understanding of valuation methods which is a primary requisite for project financing.
- Provide an opportunity to pursue a career in real estate finance and capital markets.
Chapter 2 – Literature Review
Real estate valuations
The valuation of real estate is a focal principle for all organizations. Land and property are variables of generation and, as with whatever other resource, the estimation of the land streams from the utilization to which it is put, and that thus is reliant upon the request (and supply) for the item that is created. Valuation, in its least difficult frame, is the assurance of the sum for which the property will execute on a specific date. In any case, there is an extensive variety of purposes for which valuations are required. These range from valuations for buy and sale, exchange, tax evaluation, confiscation, legacy or bequest settlement, speculation and financing.
Discounted Cash Flow Method
The discounted cash flow (DCF) method is one of the most well established and accepted method of valuing real estate properties wherein the weighted average cost of capital (WACC) is being used as the discount rate. One of the major advantages of the DCF method is that apart from taking into account the time value of money, it provides a unique result regardless of the risk preference of the investor (Gimpelevich, 2011). Also, the procedure is simple and can be easily utilised by valuers.
The discounted cash flow (DCF) method is a valuation strategy that looks to decide the productivity, or insignificant reasonability, of a speculation by inspecting anticipated future wage or income from the venture, and afterward discounting that income to provide an estimated current value of the venture or the investment. This assessed current value is ordinarily called as the net present value, or NPV. For assessment of real estate ventures, the discount rate is usually the desired or expected yearly rate of return.
In order to value a real estate project, the following factors should be included in the analysis –
- Initial Cost – This includes the sale price or the construction cost of the property.
- Financing Costs – This includes the interest costs or other costs which are associated with the financing of the project.
- Holding period – Generally for real estate developments, the holding period varies from 5 – 15 years. However, it can vary depending on the investors and developers.
- Projected Cashflows – This will include the forecasted cash inflows and outflows based on the type of the property and its payment plan.
- Additional year by year costs – These include additional costs such as marketing costs, brokerage costs and any other maintenance costs associated with the project.
- Sale profit – It is the expected amount of profit which the builder or the owner expects to gain if he/she has to sell the property at the end of the holding period.
Various factors must be assessed in the DCF calculation; these can be hard to bind definitely, and incorporate things, for example, repair and support costs, anticipated rental increments and property estimation increments. These things are normally evaluated utilizing a study of comparative properties in the range. While deciding exact figures for anticipating future expenses and money streams can be challenging, once these projections and the discount rate are resolved, the estimation of net present value is very clear and easy.
In spite of the fact that the DCF technique assumes an essential part in valuation, it experiences no less than three pitfalls. Firstly, one doesn’t consider vulnerability in the evaluated income streams or cash flows; the whole procedure is in this way devalued when estimates don’t materialise or notwithstanding when sources of info are marginally controlled (Hoesli, Jani, and Bender,2006). This feedback is especially extreme in real estate valuation since the terminal value, which is reliant on the last anticipated free cash flows, the perpetual growth rate and on the discount rate, is in majority of the cases the biggest component of the present value of the property. In the event that such parameters are not decided thoroughly, the assessed estimation of a property can be exceptionally far away from its fairly estimated worth. At the point when the latter value is known, one can likewise say that it is anything but difficult to set parameters in order to acquire a present value that is near it.
Another downside of the DCF strategy is that there is a circularity issue when some portion of the asset is financed by debt. Without a doubt, the estimation of the asset is required to register the WACC, yet the estimation of the asset is accurately what we are searching for. At last, the discount rate is thought to be steady through time however research has demonstrated that costs and profits for budgetary resources are connected more to changes in the required rate of return than to changes in expected income streams.
Adjusted Present Value Method
Adjusted present value (APV) methodology was developed by Myers and can be used to value real estate projects with the addition of Monte Carlo simulations. Under a few presumptions, the APV strategy yields an indistinguishable outcome from the generally utilized DCF method (Fernandez, 2005), however it takes care of the circularity issue made by debt financing. Furthermore, with Monte Carlo simulations, which depend on factual measures and likelihood conveyances of the factors that enter in the APV strategy, address the uncertainty issue (Hoesli, Jani and Bender,2006).
The APV methodology hypothesizes that an asset has an incentive under impeccable economic situations in addition, perhaps, an extra value coming because of market imperfections. If we consider the debt financing as a market imperfection and using the projected cashflows for a limited time period, the property value can be given as follows –
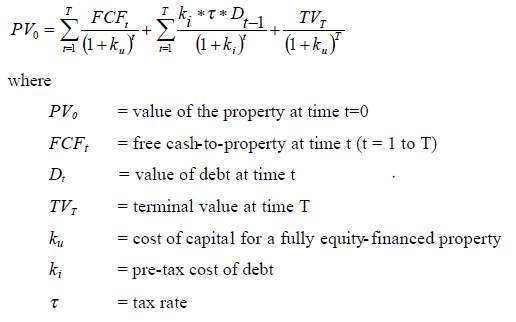
The major advantage of the equation above with respect to the DCF methodology is that this equation separately considers the impacts of debt financing and therefore it is able to resolve the circularity issue.
Real Estate Financing
Debt
Real estate bank financing can be classified under three major categories depending on the lender and the usage of the loan (Morri, 2015):
- Loans against property which is granted to private individuals.
- Loans against properties which is granted to firms or companies. This loan is intended to cover the firm’s financial requirements.
- Structured property financing granted to companies or real estate funds intended
- To finance the acquisition of an income producing property or a trading portfolio of properties.
- To finance construction of properties to be leased or sold.
Structured real estate financing operations will ideally be coordinated towards SPVs. The partition between the real estate project to be financed and the operations of the sponsors of the assets will guarantee that they are monetarily and fiscally segregated (ring-fenced financing) and will thus profit both the sponsors of the assets and the loaning banks.
Generally, debt financing can be available for any kind off real estate property if they are able to generate cash flows in the present or in the future. As per Morri (2015), these properties, whether existing or to be developed in future, are eligible for project financing –
- office / Commercial spaces
- high street retail/shopping centres
- entertainment centres/theme parks
- multiplexes
- hotels
- logistic warehouses and industrial complexes
- retirement homes
- residential complexes.
The loan might be proposed to bolster development costs or to pay the procurement cost. In the former case, it will be important to give an exact gauge of the expenses of the venture and of the money streams which the property may create once finished: the allowing of the advance may likewise be restrictive upon the offer of units effectively sold (especially if there should arise an occurrence of private improvement ventures). In the last case, it will be important to give careful consideration to the applicable conditions in the rent understandings.
The capital structure of any real estate project may be made up of three parts (Morri, 2015):
- equity
- debt capital
- hybrid financing
Meanwhile, the amount of debt to be financed depends on these factors (Morri, 2015):
- the reliability of the borrower
- the transaction for which the loan is intended and its operational risk
- any guarantees provided
This sum might be allowed as one single credit line, albeit on the other hand auxiliary credit lines may likewise be provided without a doubt, such as a particularly committed VAT line. In all cases, the value that will be infused by the support usually be less than 20–30% of the overall cost of the property. In development ventures, this value level frequently compares to the procurement cost of the range to be created. Since lower value rates will involve higher utilizing and higher dangers for the bank, credit lines surpassing 70–80% of the development cost (additionally characterized as mezzanine finance) accompany fundamentally higher expenses.
Equity
Equity financing in land is given by various customary and non-conventional investors. These funds are given by the financial specialists to get shares and in the meantime the investors are likewise given a partake in the benefits earned from the specific property.
Equity financing is considered as one of the least demanding strategies for financing interests in the real estate domain.
As per the idea of equity finance, the money is given as equities. These finances are offered by various money related organizations including banks and non-banks. In the meantime, equity financing in real estate should likewise be possible by the non-customary sources like business partners, companions, relatives and private speculators. Through debt financing, the cash is obtained from the banks however equity financing in real estate is really putting the cash in the property and along these lines, the investors turn out to be more intrigued.
There are various explanations behind utilizing equity financing in real estate investments. The prime reason is equity financing is exceptionally viable in cutting down the measure of cashflows that leaves the income properties. In the meantime, there are various methods for making reimbursements for these finances.
Among the reimbursement frames for equity finances, imparting benefits and profits to the financial investor are exceptionally well known. The benefits from a property can be shared every year or semi-annually as indicated by a pre-settled rate. The reimbursement sum and rates are controlled by various components including the yearly salary, capital gains etc.
Another vital reason of giving equity financing in real estate is that the investor gets a partake in the property. At whatever point the investor is putting resources into the equity of a property, the cash is really not loaned but rather it is included the capital thus the investor is furnished with these shares.
Private equity and FDI has also increased in India considerably over the last few years. FDI was allowed in Indian Real Estate vide press note 2 of 2005. This was land-mark legislation as it allowed investment into one of the most sensitive sectors in India. 2005-08 attracted big foreign players, some invested in listed developer space looking for returns based on the rise of Sensex while others invested in unlisted developer entities. Though the overall experience of PE funds has been mixed in India till now, the revival of the Indian economy and the expected growth of the real estate industry provides a good opportunity for PE investments in Indian realty sector. Therefore, it is important to study various PE investment structures used in real estate financing.
Chapter 3 – Research Design and Methodology
Problem Statement
This research project is focused on gaining better understanding and knowledge regarding real estate financing and valuation. As I am interested to work in the field of real estate capital markets in the future, this project will provide me with the opportunity to study and understand various concepts regarding real estate finance. The major focus points of the project will be as follows:
- To do valuation of a newly launched project in Mumbai, India.
- To devise various financing strategies for the construction of the above project.
- To prepare an information memorandum for financing of the project.
Objectives
The major objectives of the research are –
- To study various valuation methods for residential real estate projects.
- To study the various financing strategies and structures for residential real estate projects.
- To do valuation of a newly launched project in Mumbai, India.
- To study the dynamics of the market of the selected project.
- To devise various financing strategies for the construction of the above project.
- To prepare an information memorandum for financing of the project.
Research Methodology
The following research methodology will be followed during the whole research period.
Figure 3: Research Methodology
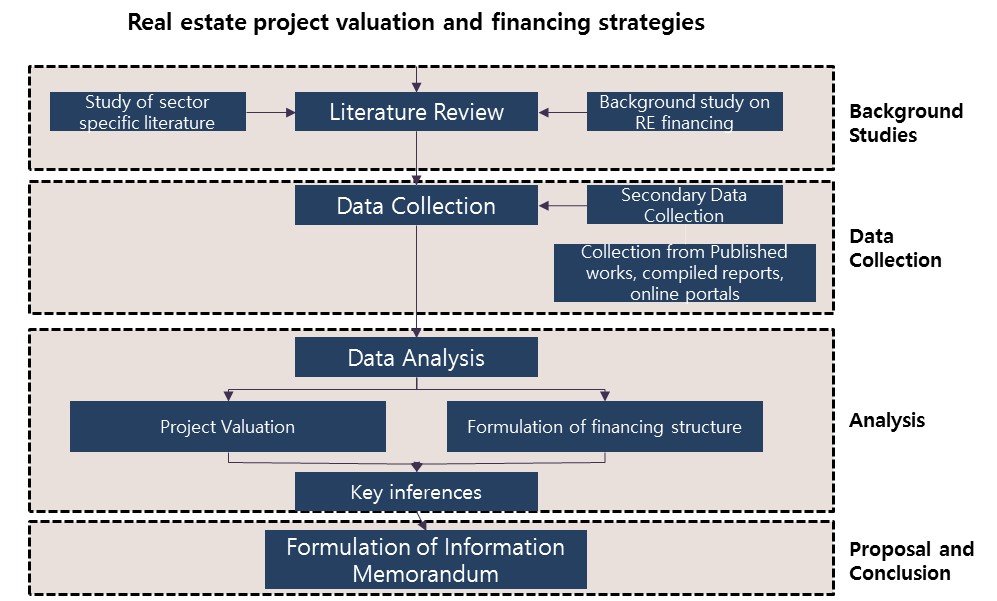
The whole research can be divided into four major stages namely Background Studies, Data Collection, Analysis, Proposal and Conclusion. Background studies includes the study of Mumbai’s real estate market and provides the foundation and understanding of the dynamics of its real estate sector. The literature review will provide the foundation for project valuation techniques and financing strategies. The next stage is data collection which will include both primary and secondary data collection. Primary data collection will include market data collection of the selected case study and its micro market while secondary data collection will include collation of data from various published sources such as market reports, project and developer financial etc. The Analysis stage will include the real-time valuation of the case study project and formulation of a financing structure for the same. This stage will also conclude with the inferences drawn from the analysis. The final stage will comprise of preparation of an Information Memorandum which is utilized as a pitch document for project financing.
Case Study Selection
The project selected for the purpose of this research is Omkar 1973. Omkar 1973 is a residential project in South Central Mumbai which is currently under construction. The rationale for the selection of this project is as follows-
- Omkar 1973 is currently under construction and therefore will provide a real-time opportunity to study real estate project valuation and financing.
- Omkar Realtors, the developers of the project are a reputed firm and is listed in the Bombay Stock Exchange and therefore the company financials can be obtained from secondary sources.
The development overview of Omkar 1973 is shown below.
Table 2: Omkar 1973, Project Overview
| Development Overview | |||
| Location | Worli | ||
| Project Timeline | 2016 – 2022 | ||
| Land area | 4.5 acres | ||
| No. of units | 449 | ||
| Sizing and Pricing | |||
| Configuration | 3,4,5,5+ BHK | ||
| Size range | 2,515 – 18,190 sqft | ||
| Current Price (Rs per sqft) | 35,000 | ||
| Current Ticket Price (Rs) | 8.8 – 63.7 Cr | ||
| Development Quantum | |||
| Total FSI permitted | 4 | ||
| Total Saleable Area | 2.4 Mn sqft | ||
| Project Density | |||
| Unit Density | 99 units/acre | ||
| Population Density | 446 persons/acre | ||
| Development Density | 420,000 sqft/acre | ||
Source – Primary survey and Project website
Data Collection Approach
Both primary and secondary survey have been utilized to gather all the required data.
- Primary Survey – Primary survey was utilized to gather information regarding the case study project. In order to get in depth information regarding the property prices, expected delivery and construction timeline, the developer’s office in Mumbai was contacted via telephone and emails.
- Secondary Survey – Secondary survey included the data gathering from published or online sources regarding Mumbai’s real estate market and the case study project. Online portals such as housing.com, commonfloor.com and magicbricks.com were also used to get insights regarding Mumbai, Worli and the case study project.
Limitations of the Study
Some of the major limitations of this study are as follows –
- The study includes many assumptions and ideal case scenarios for simplicity and learning purposes.
- Difficulty in getting the exact financing structure of a project and other data from the developer.
- The term loan structure consists of an ideal scenario with a 5-year timeline and 10 % interest rate.
- Sales timeline and its characteristics are to be assumed based on market research and knowledge.
Chapter 4 – Analysis and Interpretation
Micro market overview – Worli
Over the recent years, Worli has emerged as one of the most prominent real estate micro-markets in Mumbai. The key attributes which contributed to emergence of Worli as a muchsought after residential micro-market is its strategic location, which connects the island city’s northern and southern parts and sanctioning of higher FSI to mill land redevelopment projects. Worli is also distinctive due to its proximity to the CBD (Nariman Point) on one side and Bandra-Kurla Complex (BKC) and the airport on the other, also enhanced recently due to the sea link. As a result, Worli has also recorded real estate demand due to spill-over from the nearby residential and commercial centres, mainly CBD.
The commissioning of the iconic Worli-Bandra sea link in 2009 has added significantly to its robustness, with commuting time from western suburbs reducing substantially. Apart from road linkage, Worli also enjoys good railway connectivity through Dadar, Mahalaxmi and Elphinstone railway stations. In addition, new infrastructure projects like the Wadala-Jacob Circle monorail line, will provide great transportation connectivity to Worli. The planned monorail is expected to boost direct connectivity to suburban locations and reduce travel time.
In this backdrop, Worli offers ideal setting for real estate developments. The micro market enjoys a blend of residential, commercial and retail developments, which has provided it with an edge over other micro-markets. Moreover, Worli has been one of the preferred office areas in Mumbai since the late 70’s. As a result, several major companies like GSK Pharma, TATA, Novartis, HDFC Bank, Yes Bank, Siemens, etc. have registered their presence here. With respect to commercial real estate, major attributes like recent emergence of grade A buildings with latest amenities and modern architecture, ample car parking, etc, have resulted in driving commercial real estate demand in the micro market. Furthermore, with limited availability of land for new development has resulted in restrained new supply, particularly for commercial sector. This coupled with buoyant real estate demand, real estate market in the precinct has kept its momentum in recent years.
Furthermore, Worli is privileged to have the longest stretch of sea along its side, after Marine Drive, a fact that has gone a long way in enhancing its attraction and appeal as a residential destination. Extending from Haji Ali in the south to Prabhadevi in the north, Worli is dotted with several premium residential properties including the famous Samudra Mahal. In order to leverage its prime setting, quite a few reputed developers are currently active in Worli, coming up with luxury residential projects. Major developers include Lodha, Indiabulls, Peninsula Land, Marathon, Ahuja, DB Group, L&T, Bombay Realty, among others.
A number of prominent residential projects are currently under construction in the micro market. A few major projects include Palais Royale, Indiabulls Blu, Orchid Turf View, Oberoi Oasis etc. There are also some SRA projects ongoing in Worli, including Lokhandwala Minerva and Parinee Worli. Some of these projects are listed below.
Table 3: Key residential projects in Worli, Mumbai
| Project | Developer | Units | Expected year of Possession | Configura-tion (BHK) | Quoted Rate – Q4 2016 (INR / sq. ft.) | Floor Rise (INR / sq. Ft.) | Estimated Ticket Size (Cr) |
| Metal Box | K Raheja | 67 | 2019 | 4 | 50,000 | 250 | 21 – 25 |
| Ahuja Tower | Ahuja Constructions | 50 | 2017 | 4, 6 | 45,000 | 100 | 25 – 50 |
| Orchid Crown | DB Realty | 693 | 2018 | 3, 4, 5 | 50,000 | 180 | 7 – 19 |
| World Crest | Lodha Group | 204 | 2017 | 3, 4 | 37,000 | 180 | 11 – 13 |
| World One | Lodha Group | 323 | 2018 | 3, 4, 5, 6 | 45,000 | 180 | 12.7 – 55 |
| Indiabulls Blu | Indiabulls Real Estate Ltd | 315 | 2018 | 2, 2.5, 3, 4 | 65,000 | 225 | 6 – 15 |
| Minerva | Lokhandwala Infrastructure | 322 | 2018 | 3, 4, 5, 6 | 36,000 | 152 | 8 – 33 |
| The Park | Lodha | 880 | 2019 | 2, 3, 4, 5 | 30,600 | NA | 3.6 – 8 |
| Imperial Tower | SD Corp | 228 | 2020 | 3, 4, 5, 6 | 60,000 | NA | 15 – 67 |
Source – Magicbricks.com, Primary survey
Though the real estate activity has been upbeat in Worli, the overall high prices in the Mumbai region have kept the average resale prices almost similar to that of last year. In terms of resale prices, Worli witnessed a compounded annual growth rate of only 1.2% from 2015 to 2016. The variation in prices is shown below.
Figure 4: Resale price movement in Worli
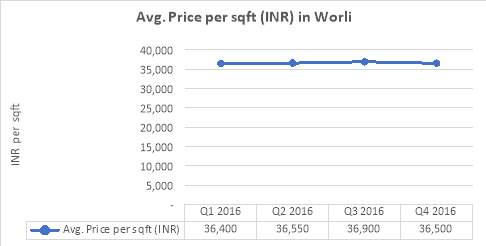
Source – Housing.com, commonfloor.com
Project Details – Omkar 1973
The subject property is located near Century Mills off Annie Besant Road, accessed by Hind Cycle Marg. It is a residential complex which comprise of 3 towers of 74, 76, and 61 storeys each. The land area of the subject property is approximately 4.5 acres.
Figure 5: Omkar 1973 – Location Map
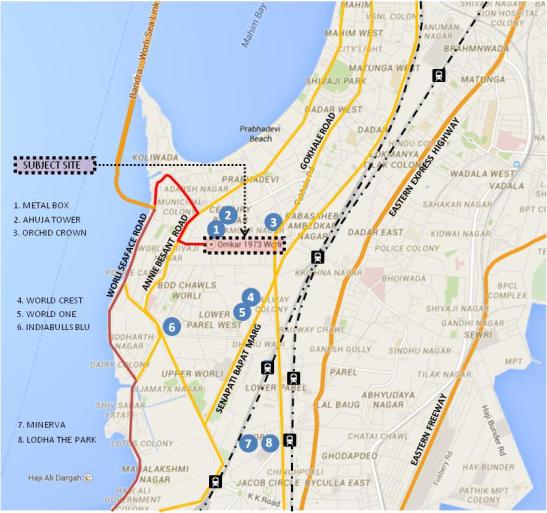
Omkar 1973 is a high-end luxury project being developed by Omkar Realtors. The project is a high-density project which is spread over an area of 4.5 acres of land. It comprises of three residential towers with some amenities like clubhouse, pool area etc. The project comes under the U1 Zoning regulations of MMRDA and has a Floor Space Index (FSI) limit of 4. The tower wise details of units and saleable area is shown below.
Table 4: Tower wise area details, Omkar 1973
| Tower | Total Units | Total Saleable Area (sqft) |
| Omkar 1973 – Tower ‘A’ | 182 | 5,95,030 |
| Omkar 1973 – Tower ‘B’ | 179 | 9,61,535 |
| Omkar 1973 – Tower ‘C’ | 88 | 8,42,080 |
| Total | 449 | 23,98,645 |
Calculation Assumptions
In order to calculate the net present value of the project and devise a financing strategy, these assumptions have been taken –
- Loading – 65%
- Construction above FSI limit – 15%
- Area of car park – 350 sqft
- Amenities – 10% of resi. Area
- Marketing Costs – 5% of sales
- Brokerage Costs – 5% of sales
- Booking Amount – 10% of Sale Price
- Approval Costs – INR 2,000 per sqft
- Property Affairs Costs – INR 2,000 per sqft
- Land Costs – INR 1,500 Mn per acre
- Discount Rate – 12%
- Apartment sales to be completed till 2020
- Apartment sales to proceed as per sizes
- Term loan rate – 10% p.a.
- Debt financing for RE projects – 70% of construction costs
- Inflation rate for construction cost – 5% p.a.
- Increase in sale price – 2% p.a.
Project Valuation
In order to the valuation of Omkar 1973, the discounted cash flow method has been used as it is the most popular methodology which is used in the Indian realty sector. The analysis is being done using these steps to calculate the net present value of the project –
- Area Calculations – The first part of the analysis includes defining various areas such as total saleable area, FSI area and total constructed area. These areas are calculated and utilised in the further steps of the analysis.
- Sales Timeline – A sales timeline is being made assuming the tentative project timeline. The no. of units (and consecutively the equivalent saleable area) is been projected. The final outcome of this step is to come up with the total inflows from the sale of the units based on the pricing plan of the project. This step will also include the formulation of the value of sales created each year.
- Project Valuation – This is the final step which will be started by the calculation of the weighted average construction cost based on the construction break up prepared in the first step and their industry prevalent construction costs. After the calculation of the weighted average construction cost, the total cash flows will be calculated from which we will calculate the net present value (NPV) of the project and its internal rate of return (IRR).
Area Calculations
Different areas with regard to the subject property are needed to be understood and calculated for the purpose of the valuation. These terms are defined for your understanding below.
Carpet Area
The carpet area comprises of the area of an apartment which can be actually covered by a carpet, or in other words the area of the unit excluding the thickness of its inner walls. It doesn’t include the common spaces such as lift lobby, corridor stairs etc. It is the actual area which you get to use in an apartment or unit.
Built up area
The built-up area includes the carpet area and the wall area. The wall area which is added to the carpet area doesn’t means the surface area but it includes the thickness of the inner walls.
Figure 6: Carpet area vs Built up area
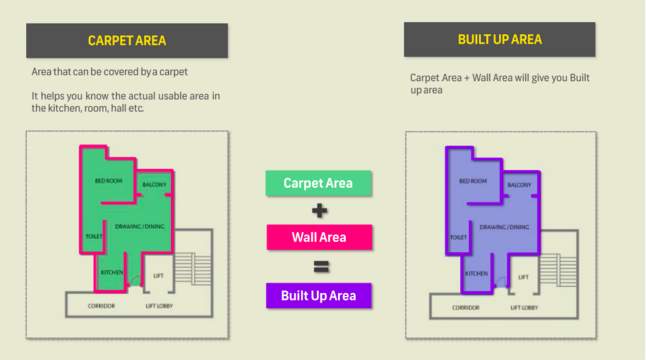
Source – Housing.com
Super Built Up area/ Saleable area
The super built up area includes the built-up area as well as the common area which consists of the corridor, lift lobby, lift etc. Sometimes the builders also include amenities like pool, garden and clubhouse in the common area. The common area is equitably distributed among all the units based on their built-up areas. A builder charges the customer based on the super built up area and therefore it is also referred to as saleable area.
Figure 7: Saleable area
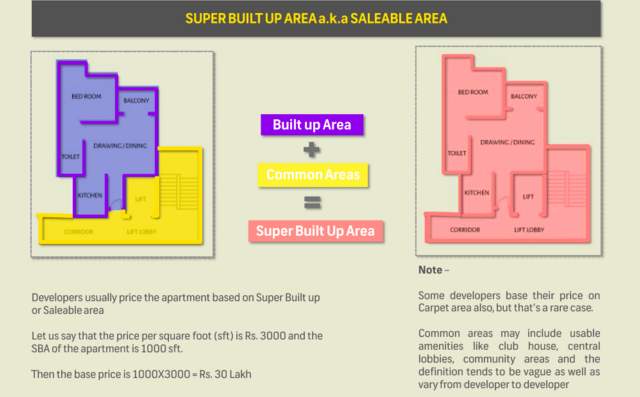
Source – Housing.com
FSI (Floor Space Index) Area
The FSI area is the constructible area as per the norms of the development authority. FSI stands for the total constructible area divided by the ground coverage. The FSI is given by numbers such as 1,2,3, and 4. The mandated FSI for this project is 4. However, as per the rules of the development authority in Mumbai, the developers can build 15% more than the permitted FSI area (residential part only) by paying certain fees to the concerned authorities.
Thus, the total residential constructible area has been calculated at first based on the available data on saleable areas and certain assumptions listed before.
Table 5: Residential area calculations
| Residential | Area in sqft |
| FSI Area | 14,53,724 |
| Loading | 0.65 |
| Saleable Area | 23,98,645 |
| Res. Constructed Area | 16,71,783 |
Another important parameter which needs to be included while calculating the total constructible area is the parking area. Nowadays parking is an important requirement, and this being a super luxury project, it is expected that the consumers will definitely need parking spaces. Therefore, the total area required for parking is calculated based on the no. of parking bays as per the units. The standard area of a parking bay is being assumed at 350 sqft. The calculations are shown below.
Table 6: Car Parking – Area required
| Car Parking – Area required | ||
| Apartment Type | No. of Units | No. of Bays |
| 3 BHK | 178 | 356 |
| 4 BHK | 190 | 570 |
| 5 BHK | 81 | 324 |
| Total | 449 | 1,250 |
| Total Area Required (sq.ft) | 4,37,500 | |
Finally, we need to consider the common areas and amenities which will include spaces such as the lift lobby, corridors, club house etc. For this project, it is assumed that the amenities will comprise of 10% of the total residential constructible area. Thus, the area for amenities comes out to be 1,67,178 sqft.
The total constructible area which is required for the calculation of construction costs is the addition of residential, parking and amenities areas. After adding all these areas, the total constructible area of the project comes to be 22,76,461 sqft.
Sales Timeline
The project was launched in 2016 and is expected to be completed by 2022. However, as the sales of units start as soon as a project is launched, the timeline for sales start from the fiscal year 2016 – 17. In India, most of the sales occur in the initial years of the launch of a project. It is also assumed that the units will be sold as per their sizes e.g. – The 2 BHKs will be sold first, then 3 BHKs, then 4 BHKs and then 5 BHKs. It is also assumed that the sales will be completed in the first four years since the project launch because of the reputation of the builder and the type of the project. Also, another important point to consider is the payment plan – which will help us in getting the cash inflows. In India, the most popular payment plan for real estate projects is the payment as per project completion and therefore it is assumed that the payments are being made as per the construction status. The calculations are shown below.
Table 7: Omkar 1973 – Sales Timeline
| Parameters | Mar-17 | Mar-18 | Mar-19 | Mar-20 | Mar-21 | Mar-22 |
| Percentage Constructed | 0% | 20% | 40.0% | 60.0% | 80.0% | 100.0% |
| Sale rate per sqft (INR) | 35,000 | 35,700 | 36,400 | 37,150 | – | – |
| Units to be sold | 126 | 154 | 76 | 93 | – | – |
| Saleable area (sqft) | 3,77,748 | 6,68,869 | 6,60,720 | 6,91,308 | – | – |
| Proceed from fresh Sales (INR Mn) | 1,322 | 4,776 | 9,620 | 15,409 | – | – |
| Proceeds from earlier sales (INR Mn) | 1,322 | 7,420 | 12,230 | 17,366 | 17,366 | |
| Total Inflows (INR Mn) | 1,322 | 6,098 | 17,040 | 27,639 | 17,366 | 17,366 |
Meanwhile, it should be noted that the marketing and brokerage expenses are calculated based on the value of the sales created. Therefore, the value of the sales created as per the sale of the units is being shown below.
Table 8: Value of sales
| Parameter | Mar-17 | Mar-18 | Mar-19 | Mar-20 |
| Total Value of sales (INR Mn) | 13,221 | 23,879 | 24,050 | 25,682 |
The marketing and brokerage costs are finally calculated based on the above sales figures. For this project, both marketing and brokerage costs are assumed to be 5% of the sales.
Project Valuation
The discounted cashflow method (DCF) has been used to calculate the net present value of the project. The inflows have been calculated in the step before during the formulation of the sales timeline while the outflows have been considered during this step. In order to calculate the construction cost, the weighted average construction cost was calculated as shown below.
Table 9: Weighted average cost of construction
| Const. Cost Calc. | INR per sqft | Construction Area | In Sqft |
| Res. Const. Cost | 9,000 | Res. Const. Area | 1671783 |
| Car Parking Cost | 2,000 | Car Parking Area | 437500 |
| Amenity Area Cost | 5,500 | Amenity Area | 167178.3 |
| Wtd. Avg. Const. Cost (INR per sqft) | 7398 | ||
After calculating the weighted average cost of construction, the other outflows were calculated and the comprehensive analysis was done to get the net cashflows for the project lifecycle. Tax and interest components were also added to get as close to a rea life situation. The final analysis is shown below.
Table 10: Net Cashflow analysis, Omkar 1973
| Parameters (All values in INR Mn) | Mar-17 | Mar-18 | Mar-19 | Mar-20 | Mar-21 | Mar-22 |
| Percentage Constructed | 0% | 20% | 40.0% | 60.0% | 80.0% | 100.0% |
| Construction Cost | – | 3,368 | 3,537 | 3,713 | 3,899 | 4,094 |
| Approval Cost | 4,553 | – | – | – | – | – |
| Land Cost | 6,750 | – | – | – | – | – |
| Property Affairs | 4,553 | – | – | – | – | – |
| Marketing Costs | 661 | 1,194 | 1,203 | 1,284 | – | – |
| Brokerage Costs | 661 | 1,194 | 1,203 | 1,284 | – | – |
| Sales Revenues | 1,322 | 6,098 | 17,040 | 27,639 | 17,366 | 17,366 |
| Interest Costs | – | – | 6,300 | 2,400 | 1,200 | 600 |
| Cashflows | -15,856 | 342 | 4,798 | 18,958 | 12,267 | 12,672 |
| Tax payments (34.61%) | -5,488 | 118 | 1,661 | 6,561 | 4,246 | 4,386 |
| Set off Tax Losses/ Net Tax | -5,488 | -5,369 | -3,709 | 2,852 | 4,246 | 4,386 |
| Final Cashflows | -15,856 | 342 | 4,798 | 16,105 | 8,022 | 8,286 |
While calculating the final cashflows, the concept of set off taxes/ net tax was also introduced. As per the Indian laws, if a company faces negative taxes then that can be set off within the next seven years. In the above table, it can be seen that due to negative cashflows in the first year, the concerned corporate tax will be negative and therefore that amount has been set off in the corresponding years to give the developers the benefit of the situation.
After calculating the final cashflows, the net present value of the project was calculated assuming a discount rate of 12%. The NPV of the project stands at INR 9,540 Mn and the internal rate of return (IRR) stands at 29%.
Financing Structure
Every real estate project needs to funded either by debt, equity or a mixture of both. In India, one can seek a construction finance term loan for up to 70% of the total construction cost. Therefore, I am suggesting a term loan for the construction of this project. The details of the loan are given below.
- Construction Cost – INR 43,151 Mn
- Equity Financing – INR 13,151 Mn
- Term Loan – INR 30,000 Mn at the rate of 10% per annum
- Loan Tenure – 5 years
It should be noted that this is an ideal case scenario wherein the rate of interest is 10% and the tenure of the loan is only 5 years. This scenario has been taken only for the learning purposes because the project had strong cashflows and has the ability to pay back the loan in the given period. However, in real life scenarios, the term loan tenure can be of 10 – 15 years depending upon the size of the loan and project cashflows. The repayment schedule of the term loan is shown below.
Table 11: Term loan repayment schedule
| Parameters (All values in INR Mn) | Mar-17 | Mar-18 | Mar-19 | Mar-20 | Mar-21 | Mar-22 |
| Loan Taken | 30,000 | – | – | – | – | – |
| Repayments | – | – | 6,000 | 12,000 | 6,000 | 6,000 |
| Interest Costs | – | – | 6,300 | 2,400 | 1,200 | 600 |
For the purpose of construction, the loan amount of INR 30,000 Mn will be disbursed to the developers during March 2017 (Year 0). There is no repayment of the principal and the interest during the first year (march 2018) due to low cashflows and therefore the payments start from the next year when the cashflows grow.
Chapter 5 – Conclusion
Conclusions and key learnings
The key idea behind taking this project was to utilize the knowledge of finance and real estate to do a real-time valuation of a project. This project provided me with the opportunity to –
- Have a better understanding of real estate valuation and financing strategies.
- To leverage earlier experience in town planning and real estate.
- Further application of DCF method for valuations.
During the whole tenure of the project, some of the major learnings which I had are as follows –
- Understanding of real estate terms and definitions. Several real estate concepts like loading, saleable area, built up area etc. were explored during the course of the project and understood in order to do the analysis.
- Understanding of cash inflows and outflows with respect to a real estate project. Some new terms like set off taxes were explored and utilized during the analysis.
- Understanding of the term loan structure was an important learning. It also helped me to understand the repayment schedule and how to adjust it based on the cashflows of the project.
Overall I would like to convey that this project has made me better prepared to pursue a career in real estate capital markets which had been one of the key objectives of the study.
Future Scope
This study has taken a lot of assumptions and ideal case scenarios have been considered for analysis. A more detailed version of the valuation and financing structure can be done wherein the following analytical tools or analysis can be included –
- Utilization of the DCF as well as the Adjusted present value (APV) method for valuing the same project and measure the discrepancies in the two methods.
- Doing a scenario/ sensitivity analysis of the term loan structure by analyzing for different time periods and different interest rates.
- Devising other financing strategies for the project, especially the inclusion of private equity investment.
[1] (Cushman and Wakefield India, 2017)
[2] (Cushman and Wakefield India, 2017)
[3] (Cushman and Wakefield India, 2017)
[4] (Cushman and Wakefield India, 2017)
Cite This Work
To export a reference to this article please select a referencing stye below:
Related Services
View all


Related Content
All TagsContent relating to: "Real Estate"
Real estate consists of land and the buildings and natural features or resources upon it or attached to it, such as trees, water, bridges, fences etc.
Related Articles

DMCA / Removal Request
If you are the original writer of this dissertation and no longer wish to have your work published on the UKDiss.com website then please: