Monochloramine to Eliminate Biofilm in Water Treatment System
Info: 11841 words (47 pages) Dissertation
Published: 8th Jun 2021
Contents
CONFIRMATION OF ETHICS CLEARANCE
2.1 History of Water Disinfection
2.2 History of Water Chlorination
2.2.1 History of Chlorination before 1900
2.2.2 History of Chlorination after 1900
2.3 Chlorine as a disinfectant
2.4 Chloramine as a disinfectant
2.4.1 Advantages of Monochloramine
2.4.2 Drawbacks of Monochloramine
2.4.3 Health effects of Monochloramines
2.5 Previous Studies on Monochloramine
LIST OF ABBREVIATIONS
IAP Industry Affiliated Program
GCUH Gold Coast University Hospital
QH Queensland Health
GCHHS Gold Coast Hospital and Health Services
EPA Environmental Protection Agency
HPC Heterotopic Plate Count
E.coli Escherichia coli
CHAPTER 1
1.1 INTRODUCTION
1.1.1 Aims and Objectives
Chlorine is one of the most commonly used disinfectant in the drinking water treatment industry (Sawyer et al., 1994). Gold Coast University Hospital (GCUH) uses chlorine as a primary disinfectant for treating potable water and cooling tower water. This report is organized to provide;
- Technical data and engineering information on monochloramine disinfection.
- Comparison between Chlorine and Monochloramine disinfection.
- Evaluate different methods and applications associated to monochloramine disinfection and comparison between them.
- Advantages and disadvantages of using Monochloramine.
- Efficiency of Monochloramine in reducing Legionella, E.coli and HPC biofilms.
- Investigate the prospective use of this disinfection at GCUH i.e. as a secondary disinfection system for better eradication of biofilms across the hospital.
- Investigate most potential technique and gather information regarding its instalment, cost and feasibility with respect to conditions at GCUH.
The report is based on the fact that a number of hospital sites are showing multiple high readings of Heterotopic Plate Count (HPC) (discussed later in the report, summary sheet attached in appendix.) The new site for GCUH was built back in 2013. With 5th year into its service, multiple high readings of HPC gives rise to the question of biofilm present in the system. This study eluates the prospective use of monochloramine to eliminate potential biofilm in the system.
1.1.2 Context
My objective is to examine, in detail, various advantages of using monochloramine through previously researched data and then applying it on conditions at GCUH.
Chlorine is used 63% as pre-treatment and 67% as post treatment processes (USPA, 1997). The main reason for the introduction of chlorine in water treatment is to eliminate or reduce the health risks. Pathogenic bacteria inundate the surface water supplies carrying waterborne diseases. The first use of chlorine as disinfectant was back in 1900s in Belgium (White, 2002).
Monochloramine is another potential disinfectant that is made up of chlorine-ammonia compounds. It was considered a useful method after observing that chlorine reducing compounds cause disappearance of free chlorine. But, when ammonia is present, the antibacterial action continues on even when there is no free chlorine residual is present. Chloramines are formed by reaction between hypo-chlorous acid and NH3. Monochloramine is used primarily for drinking water disinfection because di-chloramine and nitrogen tri-chloride produces odour and taste problems. 5:1 ratio of chlorine to ammonia is maintained so that these compounds do not form (Alternative Disinfectants and Oxidants Guidance Manual: Chapter 6: Chloramines, April 1999).
An American survey of drinking water systems indicated that twenty-nine (29%) of utilities presently use chloramines for secondary disinfection (Seidel et al., 2005). Improved distribution system residual maintenance and reduced disinfection byproduct formation was the most popular answer to why they converted from chlorine to chloramines. EPA predicts that over the next decade, 10.3% of the surface water treatment plants will be converted to chloramines serving 10,000 consumers (EPA, 2006).
The study undertakes different research papers and previous findings on monochloramine disinfection to form a basis for use at GCUH. Monochloramine has been advocated as a secondary disinfectant in United States as an effective method to reduce the production of disinfection by-products (Wang H. et al., 2012) and control biofilm growth within water distribution systems (Le Chevallier MW., 1988). While monochloramine is able to penetrate biofilms better than alternative disinfectants, this may not result in a reduction in biofilm growth (Zhang Y., 2009). Ammonia is added to water distribution systems for monochloramine disinfection technique. Excessive addition of ammonia results in formation of ammonia-oxidizing bacteria (Regan JM., 2002). Examples including members of the genera Nitrospira spp. and Nitrosomonas spp. (Hoefel D., 2005).
Nitrification of organic matter due to nitrifying bacteria is known to increase the degradation of rate of monochloramine, thus reducing longevity and effectiveness of chloramine in drinking water systems (Zhang Y., 2009).
The ratio of chlorine to ammonia has to be maintained properly for this technique to work effectively otherwise denitrifying bacteria (Nguyen C., 2012) can also be formed; however this aspect has not been fully covered in the literature review.
Monochloramines are currently being used in hospitals across the world. One notable mention is University Hospital of Pisa, Italy (Melada et al., 2015).
Legionella is the basic concern in potable water systems. It occurs in biofilms across the distribution system of water. Monochloramine is a well-known disinfectant for drinking water with several advantages over chlorine and chlorine dioxide. With these two biocides, monochloramine is included in the US-EPA list of disinfectants for drinking water. In 2005 a research program started to set up a reliable and effective method to produce monochloramine directly in domestic hot water systems, at the safest concentration and without accumulation of by-products. Results of these researches, which has been carried out with the collaboration of Italian and American Institutions showed that monochloramine can be safely and reliably prepared and that it is a safe approach to Legionella remediation in health-care facilities (Stefano et al., 2015).
1.1.3 Prospected Outcomes
This study provides all the information regarding monochloramine disinfection prospects at GCUH. If in future, there is a need for secondary disinfection to reduce the growth of biofilms within the facility, this report has all the necessary data for implementing secondary disinfection.
This is the cutting edge technology that is being used around the world today. Hospital treatment must be updated and monitored according to the best practises present so, either this report serves as a secondary treatment to chlorine treatment or used stand alone, the knowledge of better alternatives must always be present.
1.1.4 Exclusions
The scope of this study does not extend to the consideration of practically applying monochloramine disinfection to site at GCUH. Any alteration to the system must be approved by Queensland Health (QH) department. This means to successfully test the hypothesis of this study, monochloramine must be introduced into the system by consulting all the responsible delegators. Thus, the study can only be based on previous research and applying the gathered information to this particular site.
1.1.5 Outline of Report
This report follows the below mentioned outline for conducting the research.
- CHAPTER 1 INTRODUCTION
This section describes the purpose of report and background data. Need for conducting this research and its probable outcomes.
- CHAPTER 2 LITERATURE REVIEW
This section entails all the necessary information required for conducting the research at GCUH. It describes the process of disinfection, advantages, disadvantages, previous research papers and different school of thoughts on this topic. Various technologies used till date for using monochloramine as disinfectant.
- CHAPTER 3 METHODOLOGY
This section details the methodology adopted to fit findings from literature review into the GCUH system.
- CHAPTER 4 FINDINGS & DISCUSSION
This section reviews the whole report as a whole and give critical analysis of the feasibility of techniques that can be used at GCUH.
- CHAPTER 5 CONCLUSION
This section gives the final verdict on whole report.
1.1.6 Conventions Adopted
For the purpose of this report and nature of action-based research in the methodology section, the convention of author referring to himself in third-person makes convoluted expression and hard reading. Therefore, after consultation, I have decided to adopt first person narrative voice.
CHAPTER 2
2. LITERATURE REVIEW
2.1 History of Water Disinfection
Ancient civilizations have always established themselves around water sources. The importance of ample water quantity and its use was apparent to our forefathers but there was no understanding of water quality measures and it was not very well documented. Historical data shows that aesthetic problems for example unpleasant smell, taste or odour were used solely for the purpose of measuring water quality for thousands of years. It took another thousand year for people to recognise that their senses alone were not accurate judge of water quality. Water treatment originally focused on improving the aesthetic qualities of drinking water. Methods to improve the taste and odour of drinking water were recorded as early as four thousand (4000) B.C. Ancient Sanskrit and Greek writings recommended water treatment methods such as filtering through charcoal, exposing to sunlight, boiling and straining. Visible cloudiness (later termed Turbidity) was the driving force behind the earliest water treatments as many source water contained particles that had an objectionable taste and appearance. To clarify water the Egyptians reportedly used the chemical alum as early as 1500 B.C to cause effective means of removing particles from water, although the degree of clarity achieved was not measureable at that time. By the early 1800s, slow sand filtration was beginning to be used regularly in Europe. During the mid to late 1800, scientists gained a greater understanding of the sources and effects if drinking water containments especially those that were not visible to the naked eye. In 1855, epidemiologist Dr. John Snow proved that cholera was a waterborne disease by linking an outbreak if illness in London to a public well that was contaminated by sewage. In the late 1800s, Louis Pasteur demonstrated the “germ theory” if disease, which explained how microscopic organisms could transmit disease through media like water.
The first multiple filter was developed in 1685 by the Italian physician Lu Antonio Porzo. The filter consisted of a settling unit and a sand-filtration unit. In 1746 the French scientist Joseph Amy received the first patent for a filter design, which was applied in households by 1750. The filters consisted of wool, sponges and charcoal.

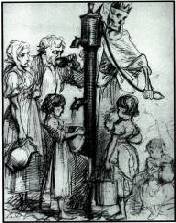
Fig 2.1 John Snow Fig 2.2 Contaminated well spreads Cholera
One of the most compelling stories is around 3000 B.C., the city of Mohenjo-Daro (Pakistan). The city used a very extensive water supply. In this city there were public bathing facilities with water boiler installations and bathrooms.
The Romans were the greatest architects and constructors of water distribution networks in history. They used river, spring or groundwater for provisioning. The Romans built dams in rivers, causing lakes to for. The lake water was aerated and them supplied, Mountain water was the most popular type if water, because of its quality.
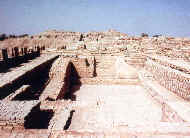
Fig 2.3: bathing residence in Mohenjo-Daro, Pakistan
The Romans were the greatest architects and constructors of water distribution networks in history. They used river, spring or groundwater for provisioning. The Romans built dams in rivers, causing lakes to for. The lake water was aerated and them supplied, Mountain water was the most popular type if water, because of its quality.
For water transport the aqua-ducts were built. Through these aqua-ducts water was transported for tens of miles. Plumbing in the city was made of concrete, rock, bronze, silver wood and lead. Water winnings were protected from foreign pollutants.

Fig 2.4: A Roman aqua-duct
After the fall of the Roman realm, the aqua-ducts were did not utilize anymore. From 500 to 1500 A.D. there was little improvement in the water treatment territory. In the middle Ages incalculable urban communities were showed. In these urban areas wooden plumbing was utilized. The water was separated from streams or wells, or from outside the city. Before long, conditions turned out to be exceptionally unhygienic, on the grounds that waste and fertilizers were released into the water. Individuals that drank this water fell sick and frequently kicked the bucket. To tackle the issue individuals began drinking water from outside the city, where streams where unpolluted. This water was conveyed to the city by alleged water-bearers.
The main drinking water supply that provided a whole city was inherent Paisley, Scotland in 1804 by John Gibb, so as to supply his bleach method and the whole city with water. Inside three years, separated water was transported to Glasgow.
In 1806 Paris worked a huge water treatment plant. The water made due with 12 hours, before it was sifted. Channels comprised of sand and charcoal and where supplanted like clockwork. In 1827, the Englishman James Simpson constructed a sand channel for drinking water cleaning. Today, regardless we call this the main tribute to general wellbeing.
During the late nineteenth and early twentieth centuries, concerns regarding drinking water quality continued to focus mostly on disease causing microbes (pathogens) in public water supplies. Scientists discovered that turbidity was not only an aesthetic problem; rather particles in source water such as faecal matter and other containments could all have pathogens. Due to this, most of the water treatment technologies built around the world in the early 1900s, all revolve around reducing turbidity. They endure to remove the microbial containments that were causing typhoid, cholera and other epidemics. To reduce turbidity some water systems cities began to use slow sand filtration. While filtration was effective treatment methodology for reducing turbidity, it was disinfectants like chlorine that played the largest role in reducing the number of waterborne disease outbreaks in the early 1900s.
In 1908, chlorine was utilized as an essential disinfectant of treating water. The utilization of different disinfectants, for example, ozone likewise started in Europe around this time, however were not utilized in the U.S. until a very long while later. Government control of drinking water quality started in 1914, when the U.S. General Health Service set models for the bacteriological nature of drinking water. The models connected just to water frameworks which gave drinking water to interstate transporters like ships and prepares, and just connected to contaminants equipped for bringing about infectious malady. Mechanical and horticultural advances and the production of new man-made chemicals additionally affected nature and general wellbeing. Large portions of these new chemicals were discovering their way into water supplies through industrial facility releases, road and ranch field overflow, and releasing underground stockpiling and transfer tanks. In spite of the fact that treatment procedures, for example, air circulation, flocculation, and granular initiated carbon adsorption (for evacuation of natural contaminants) existed at the time, they were either underutilized by water frameworks or ineffectual at expelling some new contaminants.
2.2 History of Water Chlorination
Use of water chlorination to disinfect public water supplies which began in the early 1900s, has had a major impact on the incidence of waterborne disease worldwide. There is an increase of 50% life expectancy that has occurred due to chlorination of water in the developed countries during twentieth century as credited by Chirstman of the Chlorine Chemistry Council. He also notes that Life magazine recently cited drinking water chlorination and filtration as one of the most significant public health advances of the millennium (Chirstman, 2017).
The U.S EPA in an article in the history of water treatment (US Environmental Protection Agency), noted that the use of drinking water chlorination led to a dramatic decrease in the incidence of waterborne diseases like typhoid, cholera and dysentery which all began in the early 1900s. A good example of this statement is typhoid fever in the U.S dropped from an incidence of about 100 per 100,000 in 1900 to 33.8 per 100,000 in 1920 and to 0.1 per 100,000 in 2006 (Centres for Disease Control and Prevention, 2012).
2.2.1 History of Chlorination before 1900
Although most of the significant developments in the chlorine water disinfection took place after 1900, a few noteworthy events are as follows;
- 1846 – A requirement was set forward by Dr. Ignaz Semmelweis at the institute of physicians in Vienna Hospital to wash their hands with soap and chlorine water to reduce infections and child bed fever in patient.
- 1854 – Disinfection of Board Street pump supply by Dr. John Snow in London which he had identified as the cause of cholera outbreak because sewage contamination.
- 1879 – Faeces of typhoid fever patients were treated with chlorine lime before it was disposed into the sewer system by Dr. William Soper.
- 1893 – First ever plant based chlorine drinking water disinfection system was installed in Hamburg, Germany.
- 1897 – Temporary disinfection of potable water supply at Maidstone, Kent in England using a bleach solution by Dr. Sims Woodhead.
(Source:Hall, E.L, and Dietrich, A.M., A Brief History of Drinking Water, Rhode Island Water Resources Board, Available at http://www.wrb.state.ri.us/program_eohistory.html
The American Chemistry Council’s Chlorine Chemistry Division, A Giant Step for Public Health: Chlorination in Chicago & Jersey City, Available at http://www.americanchemistry.com/100years/CityHistory.pdf
Christman, K.A., Chlorine, Chlorine Chemistry Council, Arlington, VA, USA, Available at http://www.cepis.org.pe/eswww/caliagua/simposio/enwww/ponencia/ponen8.doc).
2.2.2 History of Chlorination after 1900
Here are a few key dates that are important for water chlorination;
- 1903 – The first ever use of chlorine gas for disinfection of water supply in Middlekerke, Belgium (Previous chlorination was done with hydrated lime and bleaching powder.
- 1908 – A chemist, Dr. John Leal, and an engineer George Warren Fuller built and designed the first ever full scale water chlorination system using sodium hypochlorite in the history of U.S. It was built and put into service in Jersey City, NJ.
- 1910 – Compressed chlorine gas from steel cylinder was used for treatment of water distribution system by C. R. Darnall. This is the most common method in use for water chlorination today.
- 1914 – 2 coliform per 200 ml of maximum bacterial concentration standard was put forward by U.S department of the treasury, following dramatic requirement of chlorination to drinking water distribution systems.
- 1920 – 1930 – Drinking water filtration and chlorination had virtually eliminated water borne diseases in U.S and other developed countries.
(Source: Hall, E.L, and Dietrich, A.M., A Brief History of Drinking Water, Rhode Island Water Resources Board, Available at http://www.wrb.state.ri.us/program_eohistory.html
Curtis, M. and Johnston, E., Chlorine Disinfection, Civil Engineering Department, Virginia Tech, Available at http://www.cee.vt.edu/ewr/environmental/teach/wtprimer/chlor
The American Chemistry Council’s Chlorine Chemistry Division, A Giant Step for Public Health: Chlorination in Chicago & Jersey City, Available at http://www.americanchemistry.com/100years/CityHistory.pdf)
2.3 Chlorine as a disinfectant
Chlorine, under normal pressure and temperature, remains gas but can be compressed to a liquid form and stored in cylindered containers. Because chlorine gas is poisonous, it is dissolved in water under vacuum and this concentrated solution is applied to the water being treated. For small plants, cylinders of about 70kgs are used and for large plants tonne containers are more common. Chlorine is available in granular form or powdered as calcium hypochlorite.
Following are the three types of chlorine used in water treatment technologies
- Sodium hypochlorite, commonly called “liquid bleach”, is commercially available in strengths approximately 15% by weight. It can be added to the receiving stream by gravity, by the use of a chemical metering pump, or by physically dumping it.
- Calcium hypochlorite, generally referred to as “powder chlorine”. It contains 70% available chlorine. It can be added to the receiving stream by use of pellets or by mixing a solution of water and calcium hypochlorite, decanting the solution into a tank and using a small chemical feed pump.
- Liquid chlorine, known also as “chlorine gas”, is chlorine in its elemental form. It is available as a compressed gas of 100% strength. The most common ways of adding elemental chlorine to a receiving stream are to feed gas with a vacuum-operated solution feed system, or to feed the gas under pressure. (Hydro-instruments, Basic Chemistry of Chlorination, 2012).
When comparing elemental chlorine as an oxidizing agent to powder (calcium hypochlorite) or solution (sodium hypochlorite), the oxidizing effect is the same. That is, all three produce hypochlorous acid, the oxidizing agent present for disinfection in water and waste water application.
Most commonly chlorine is used in the form of gaseous or hypochlorite (OCL–). In both forms, it acts as a potent oxidant agent and often dissipates in side reactions so rapidly that little disinfection is accomplished unless excess amount of chlorine is added than the demand requirement. (Mel et al., 1953)
- When chlorine gas is dissolved in water it reacts with water to form hypochlorous acid and hydrochloric acid:
Cl2 + H2O = HOCl + HCl
- When hypochlorite is added to water, it also reacts to from hypochlorite ion and hydroxide:
NaOCl + H2O = OCl¯ + OH¯
- These both forms can exist together and the relative concentrations of each of them depends on the solution pH and not on whether chlorine gas or bleach was added:
HOCl OCl¯ + H+
There is a slight distribution of base formed when hypochlorite is added or slight distribution of acid when chlorine is added. But this distribution is insignificant and makes no difference in the final pH of water. Buffering power of water overcomes the small amount of chlorine added to it (WHO, chemistry of disinfectants and by-products, 2014).
Hypochlorous corrosive is a feeble acid with a pKa of approximately7.5 at 25 °C. Hypochlorous corrosive, the prime sterilizing operator, is therefore predominant at a pH beneath 7.5 and is a more powerful disinfectant than hypochlorite particle, which commands above pH 7.5. The rates of the deterioration responses of chlorine increment as the arrangement turns out to be more basic, and these responses can hypothetically deliver chlorite and chlorate (ClO3–); they happen amid the electrolysis of chloride (Cl–) arrangements when the anodic and cathodic compartments are not isolated, in which case the chlorine framed at the anode can respond with the salt shaped at the cathode. Then again, hypochlorous corrosive/hypochlorite (or hypobromous corrosive/hypobromite, HOBr/OBr–) can be shaped by the activity of chlorine (or bromine) in unbiased or soluble arrangements. The decay of hypohalites (XO–) is supported in antacid arrangements (2XO– 6 X– + XO2–) and is to such an extent that there is no longer any space of thermodynamic strength for the hypohalite particles. These oxyhalites are additionally changed over to stable oxyhalates as takes as follows;
XO– + XO2– 6 X–+ XO3–
Another reaction that occurs in waters containing bromide particle and hypochlorite is the generation of hypobromous corrosive:
HOCl + Br– 6 HOBr + Cl–
This response is irreversible, and the item hypobromous corrosive is a preferable halogenating operator over hypochlorous corrosive and meddles with basic scientific strategies with the expectation of complimentary chlorine. The nearness of bromide in hypochlorite arrangements can ultimately lead to the development of bromate (BrO3–). Hypobromous corrosive is a frail corrosive (pKa = 8.7); like hypochlorite, hypobromite is metastable. In antacid arrangement, it decomposes to give bromate and bromide:
3OBr– 6 BrO3– + 2Br–
Bromic acid (HBrO3) is a solid corrosive (pKa= 0.7).Bromic corrosive and bromate can be acquired by the electrolytic oxidation of bromide arrangements or bromine water utilizing chlorine. Bromic corrosive and bromate are intense oxidizing specialists, yet the speed of their oxidation responses is for the most part moderate (Mel et al., 1953).
Following table shows physical and chemical properties of Chlorine and monochloramine:
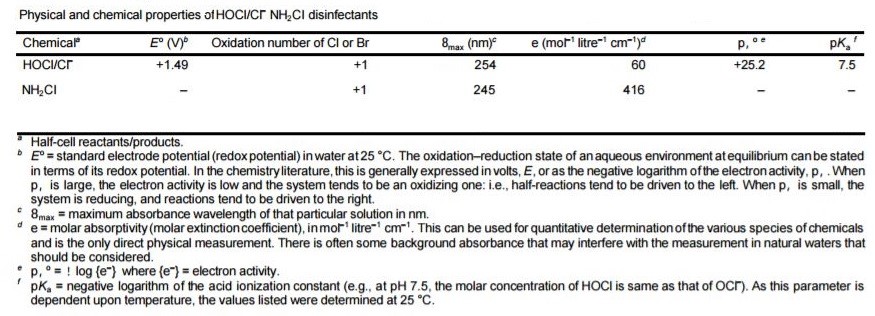
Table 2. Physical and chemical properties of Chlorine
The pH of the water is critical with respect to the fluctuating extents of the hypochlorous acid and hypochlorite particles. In an answer with pH ascending more than 6.0 the extent of hypochlorous corrosive decreases from practically 100% down to right around 0 at pH 9.0. The movement of hypochlorous corrosive as a bactericide is incredibly better than that of the hypochlorite, being very nearly 80 times all the more intense. It might be presumed that in free leftover chlorination, the higher the pH esteem the less dynamic is the remaining due to its lower extent of hypochlorous corrosive. Following graph shows relationship between equilibrium changes and pH.
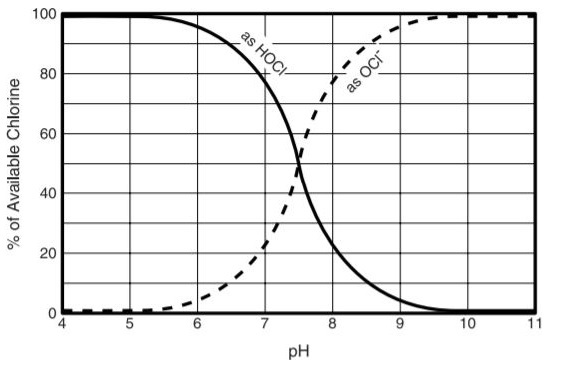
Fig 2.5 Relationship between HOCl and OCl at various pH values
The science of chlorine in water expressed before is valid for immaculate water, and a great deal more happens in characteristic waters and in squanders. All wastewater contains NH3 and some consumable waters do as well. Frequently when consumable waters are chlorinated, alkali is purposely added to keep up a remaining for a more drawn out time.
The reactions that occur amongst HOCl and ammonia are as per the following:
NH3 + HOCl → H2O + NH2Cl (Monochloramine)
NH3 + 2HOCl → 2H2O + NHCl2 (Dichloramine)
NH3 + 3HOCl → 3H2O + NCl3 (Nitrogen Trichloride)
These reactions happen basically promptly and are pH dependant. At pH levels over 8.5 just monochloramine is framed; beneath this, blends of mono and dichloramine result; and underneath pH 4.2 just nitrogen trichloride exists. For wastewater and drinking water that has been treated with both smelling salts and chlorine, the dominating species is monochloramine. The chloramines, together with some different exacerbates that can happen are totalled and considered joined accessible chlorine. These types of chlorine, albeit substantially weaker than hypochlorous corrosive, are extremely valuable in a few applications. At the point when adequately high chlorine measurements are connected to waters containing alkali distinctive responses will happen bringing about the annihilation of the smelling salts and the development of free chlorine remaining. Figure 2.6 demonstrates what normally happens with expanding chlorine measurements for water containing NH3.
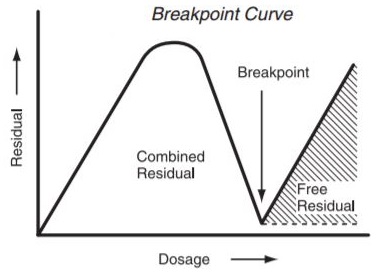
Fig 2.6 Breakpoint Curve Chlorine
Low chlorine doses result in the arrangement of mono and dichloramine and are delineated as expanding leftover on the left end of the bend (Fig 2.6). The pinnacle of the bend happens when the majority of the free smelling salts is spent shaping chloramines. This for the most part happens when the measurement achieves 8 or 10 times the smelling salts focus. This is known as the breakpoint. After breakpoint the joined chloramines are available as free chlorine which is a blend at ordinary pH estimations of hypochlorous corrosive and hypochlorite. Acknowledgment of these two types of lingering chlorine is of the best significance since the compound, bactericidal and virus properties of free chlorine are unfathomably better than those of consolidated chlorine. For most extreme conditions, it is basic to chlorinate to the point of building up free chlorine. That the treatment has been legitimately done must be set up by utilizing test methodology equipped for measuring free chlorine isolate from joined chlorine. Against this disentangled science of chlorination, we may look to a portion of the meanings of terms utilized as a part of chlorination today.
2.4 Chloramine as a disinfectant
Drinking water odour and flavour have improved by the application of chloramines from the beginning of 20th century. Chloramines are formed during the reaction between chlorine and ammonia. Chloramines are amines which contain at least on chlorine atom, which is directly bonded to the nitrogen atom. Inorganic chloramines are formed when dissolved chlorine and ammonia react. During this reaction, three different types of chloramines are formed depending upon the pH and temperature conditions of the system. These are as follows
- Monochloramine (NH2Cl)
- Di-chloramine (NHCl2)
- Tri-chloramine (NCl3)
Inorganic chloramines, free chlorine and organic chloramines are chemically related and can change readily into one another. These compounds cannot be found in isolated form. Inorganic chloramines are not persistent, however, they are more persistent than free chlorine. Half-life of inorganic chloramines vary from 1 minute to 23 days, depending upon the nature and condition of the system there are used in.
Chloramines are as often as possible created by adding NH3 to water containing free chlorine (HOCl or OCl, contingent upon the pH). The perfect pH esteem for this response is 8.4. This implies the water is somewhat basic.
Reaction Mechanism:
NH3 (aq) + HOCI – > NH2Cl + H2O
At the point when the response happens three sorts of inorganic chloramines can be framed. The pH esteem figures out which sort of chloramines is shaped. Tri-chloramines principally frame when the pH esteem is 3 or beneath. At the point when the pH esteem is 7 or above, di-chloramine focuses are most astounding.
The measures of chlorine and alkali in the water likewise impact the start of chloramines. The chlorine/NH3 rate is in a perfect world 6:1. Amid chloramine generation the rate is generally 3-5:1. At the point when smelling salts fixations are higher, more di-and tri-chloramines are framed. Organic chloramines can likewise be shaped amid these responses. Natural chloramines can’t be recognized from different chloramines, utilizing standard chloramine investigation strategies.
The following graph shows production of different chloramines with pH.
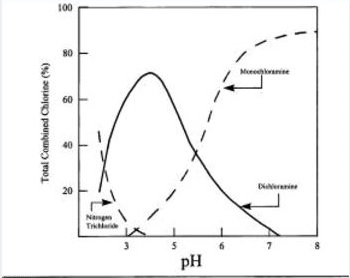
Fig. 2.7 Distribution system of chloramines with pH
| Chloramine | Formula | Molecular Weight | Prefferd pH value | Biocide effect |
| Monochloramine | NH2Cl | 52 | >7 | Good |
| Di-chloramine | NHCl2 | 85 | 4-7 | Tolerable |
| Tri-chloramine | NCl3 | 119 | 1-3 | Average |
| Organic Chloramines | RNHCl | varies | unknown | Bad |
Table 2.1 Different chloramines and their properties
At the point when chloramines are utilized as a disinfectant, ammonia is added to chlorine treated water. Ammonia is included after chlorine, since this causes CT qualities to be lower than when alkali is included fundamentally.
Chloramines are as powerful as chlorine for the deactivation of microbes and different microorganisms, however the response system is slower. Chloramines, similar to chlorine, are oxidators. Chloramines can eliminate microscopic organisms by infiltration of the cell divider and blockage of the digestion. Monochloramine is the best disinfectant. It responds straightforwardly with amino acids in the bacterial DNA. Amid deactivation of microorganisms chloramines devastate the shell which secures an infection. At the point when the pH esteem is 7 or higher, monochloramine is the most bounteous chloramine. The pH esteem does not meddle with the viability of chloramines.
For the purpose of this report, only monochloramines are discussed in detail.
2.4.1 Advantages of Monochloramine
2.4.1.1 Few disinfection by-products
Monochloramines produces few organic compounds i.e. tri-halomethanes (THMs) and other carcinogenic by-products (halogenic acetic acid; HAA). This is the primary benefit of using monochloramine over chlorine disinfection. (Stefano M., 2015)
2.4.1.2 Monochloramine remains active for a long time
Monochloramine remains in the system far longer than chlorine. They are effective when pH is higher than 7. When pH is higher than 7, it becomes alkaline. It has an advantage over acidic water that it is less corrosive.
2.4.1.3 Increase in taste and smell of water
Monochloramines do not alter the pH of water. Chloramines provide better taste and smell than chlorine. They are often applied to prevent chlorine taste and smell.
2.4.2 Drawbacks of Monochloramine
2.4.2.1 Reaction rate of chloramines
Monochloramines are less reactive than chlorine. Part of the disinfectant remains in the water, where it will be consumed by bacteria or broken down. This process can take weeks. Contrary to chlorine, monochloramines do not perish when water remains idle in pipe lines for a few days.
2.4.2.2 Organic chloramines
Organic chloramines are formed in water when large amounts of organic matter is present in water distribution system. Organic nitrogen is responsible for this reaction. This situation occurs when organic matter exceed 3ppm limit.
2.4.2.3 Nitrates formation
High amounts of ammonia serve as nutrient for nitrifying bacteria in the water, which can cause nitrate level to rise. Young children are more susceptive to nitrates. When children below 0.5 years old drink water having high nitrate water, it causes oxygen level in blood to fall which is called Blue baby Syndrome.
2.4.3 Health effects of Monochloramines
Water that is purified by chloramines does not bring about a wellbeing danger. It can be utilized for drinking, showering and washing and is appropriate for a few every day household purposes. Drinking chloramine-containing water or utilizing it for bubbling and showering is sheltered, due to a balance of chloramines in the digestion. In any case, individuals with debilitated resistant frameworks, for example, youthful kids, elderly individuals, individuals with HIV and individuals that experience chemo treatment, ought to likewise be wary with regards to the utilization of chloramine sanitized water.
Kidney dialysis patients and individuals that possess fish, reptiles or creatures of land and water ought to be cautious. With kidney dialysis patients the blood interacts with water in a semi penetrable layer. This can make chloramines straightforwardly enter the veins. Chloramines are lethal to the blood. Fishes can specifically take up chloramines in the blood through their gills. Chloramines are harmful to angles, as well. Water that is utilized as a part of aquaria ought to be free from chloramines.
2.5 Previous Studies on Monochloramine
A number of noteworthy publications and research has been done for evaluating the effectiveness of monochloramines against legionella disease. A previous study was done by Stefano Melada and his colleges in 2015 to evaluate the research done so far in this prospect. This study is taken as a basic review and other studies are taken as reference.
The studies were classified on the basis of five parameters. These are as follows
- Biofilm penetration, residual concentration and production of disinfection by-products
- Influence of pipe material on biofilm formation and disinfectant penetration
- Effect of nitrification on decomposition rate
- Monochloramine treatment and viable but non-cultural (VBNC) L. pneumophilia in biofilms
- Effect of protozoa on Monochloramine disinfection of biofilm.
A summary of varies noteworthy research papers and their findings is as follows in the table;
|
|
Report Status | Results |
| Wolfe et al., 1990 | Experimental | Maintaining a chloramine residual of at least 1-2 mg/L could be sufficient to limit nitrifier growth |
| in drinking water | ||
| Chen et al, 2000 | Experimental | Reduction of biofilm viable cells counts better than free chlorine at neutral pH |
| Pintar et al., 2003 | Experimental | Effectiveness in controlling ammonia-oxidizing bacteria activity in the biofilm |
| Thomas et al., 2004 | Experimental | Important increase in dead biomass proportion at a concentration of 0.5 mg l-1 |
| van der Kooij et al., 2005 | Experimental | A model system of copper can temporarily reduce Legionella colonization but, after 2 years, |
| biofilm colonization on copper, stainless steel and cross-linked polyethylene (PEX) pipes is very | ||
| similar | ||
| Park et al, 2008 | Experimental | High-level MC residual in a low-nutrient water system linked with a reduction in biofilm density |
| on pipe surfaces and to depressed potential functional/metabolic ability of the biofilm community | ||
| Türetgen, 2008 | Experimental | Decrease of cell cultivability significantly begins at 1 ppm. At 1.5-2 ppm environmental L. |
| pneumophila enters VBNC state | ||
| van Schalkwyk et al., 2010 | Experimental | Even at concentrations as low as 1 ppm MC is able to penetrate complex biofilm matrixes like that |
| in cooling towers | ||
| Dupuy et al, 2011 | Experimental | Similar effectiveness towards free or co-cultured L. pneumophila while chlorine and chlorine |
| dioxide were less efficient on co-cultured L. pneumophila | ||
| Ramseier et al., 2011 | Experimental | Minimal reaction with organic matter but specific reaction with bacterial membrane at high oxidant |
| exposures | ||
| Chien et al, 2012 | Experimental | More effectiveness in controlling biofouling (accumulation of micro-organisms, plants or algae) in |
| cooling systems employing secondary-treated municipal wastewater compared to free chlorine | ||
| Kandiah et al, 2012 | Observational | Better biofilm penetration than copper-silver ionization |
| Pressman et al, 2012 | Experimental | Limiting the free ammonia concentration during MC application slows the onset of nitrification |
| Episodes by maintaining the biofilm biomass at a state of lower activity. MC is able to penetrate | ||
| biofilms 170 times faster than free chlorine | ||
| Dupuy et al, 2014 | Experimental | Less effectiveness than chlorine dioxide against Acanthamoeba cysts |

 Authors
 The following table shows comparison of Monochloramine with other disinfectants;
| Authors | Study design | Results |
| Kandiah et al., 2012 | Observational | Appropriate flushing procedures and cleaning of the faucets with a bleach-based solution were |
| unsuccessful in eradication of Legionella species despite adequate copper and silver levels. After | ||
| monochloramine introduction into the hot water system faucets, all sensor faucets converted | ||
| negative after only three weeks of monochloramine installation. | ||
| Marchesi et al., 2012 | Observational | Legionella pneumophila contamination was followed in comparison with 2 other water networks in |
| the same building using chlorine dioxide. MC significantly reduced the number of contaminated | ||
| sites compared with baseline (from 97.0% to 13.3%, respectively), chlorine dioxide device I (from | ||
| 100% to 56.7%, respectively), and device II (from 100% to 60.8%, respectively). MC could | ||
| represent a good alternative to chlorine dioxide in controlling legionellae contamination in public | ||
| and private buildings. | ||
| Pressman et al., 2012 | Experimental | The initial MC mass delivery inside a nitrifying biofilm was 170 times greater compared to free |
| chlorine for equivalent chlorine concentrations. | ||
| Chen et al., 2000 | Experimental | Compared to free chlorine, MC had a longer residual effect in biofilm cells also at neutral pH. |
| While the amount of biofilm removed by chlorine and MC was not statistically significantly | ||
| different (p = 0.45), MC killed bacteria in the biofilm better than did free chlorine at neutral pH (p = | ||
| 0.001). | ||
| Ercken et al., 2003 | Experimental | The biocidal activity of MC against Naegleria lovaniensis was 8x weaker than that of hypochlorite |
| but 2x stronger than that of peracetic acid. | ||
| Dupuy et al., 2011 | Experimental | Comparison of the efficacy of chlorine, MC and chlorine dioxide against trophozoites of three |
| different Acanthamoeba strains showed that MC was more efficient than chlorine and chlorine | ||
| dioxide at the same level towards free or co-cultured L. pneumophila. |
CHAPHTER 3
3. METHODOLOGY
As discussed earlier, the methodology adopted for the purpose of this research is observational and theoretical based. Gold Coast University Hospital is a fully functional public service building and any changes to the system cannot take place without the consent of Queensland Department of health.
According to the literature review quoted above, monochloramine is a better disinfectant for water distribution system for biofilm removal and bacteria reduction. GCUH was built is 2013 and this is its fifth year of operation. Multiple readings of high HPC results came back from different parts of the hospital. Super-chlorination was done to cure this hazard as it could lead to legionella problems in the future. This means that there is problem of biofilm across pipelines in hospital network.
3.1 Overview of GCHHS Network
GCHHS receives potable water via the South East Queensland Water Grid (the bulk supplier) and then locally by Gold Coast Water (the distributor). The water infrastructure within the GCHHS site is as follows:
Single connection to GCW mains located adjacent to the Central Energy Plant (CEP)
Two potable water storage tanks (550,000 litres hospital supply, 420,000 litres cooling tower supply)
- Inline pressure booting pumps (duty/standby)
- Chlorine dosing system consisting of the following basic components:
- Chlorine sensor/s to measure the chlorine content in the water
- An instrument that receives a signal from the measuring sensor/s. The instrument compares the measured signal to the desired set point = chlorine level, compares the deviation, and then gives a signal to the dosing system to dose chlorine at a calculated rate to correct a deficiency, should a deficiency exist.
- A dosing system of suitable capacity to dose the chlorine solution as required.
- UV disinfection systems (standby only). In UV disinfection, the water to be disinfected is exposed to short wave UV light. This UV-C radiation is a quick and effective germicide. Commissioned if GCW notify if incident may impact on water supply and tanker supply supplementation is required. If used in disinfection of drinking water, disinfect downstream pipework e.g. high chlorination before commissioning UV system.
- Potable water distribution network to all buildings.
- Five Reverse Osmosis (RO) water treatment units for dialysis equipment.
- In ground harvested rain water storage tanks (approximately 750,00 litres total capacity) and distribution network for irrigation of hospital grounds.
- Separate fire water distribution network to all buildings.
- Two firefighting water storage tanks – total of 840,000 litres (two x 420,000 each).
- Eight cooling towers using potable water.
3.1.1 GCUH Water Distribution
GCUH receives potable water from a single supply point located in the North Eastern corner of the facility site.
Water is supplied directly from GCW into the potable water storage tanks. These tanks do not allow for any redundancy in the event of lost supply. They were designed to provide a 24 hour period turnover of water for the hospital at full capacity to mitigate the risk of potential contamination and chlorine degradation. In periods of high consumption, the storage capacity is reduced to a period of approximately twenty four hours. An operational business continuity plan has been developed for the emergency supply of potable water via tanker delivery from GCW supply points to camlock connection points at these tanks.
Water storage tanks are cleaned and maintained periodically in-line with the FMSC. This is performed to prevent the build-up of sediments or re-growth of opportunistic pathogens. Disinfection of water in these storage tanks is reliant on the residual chlorine levels provided by GCW. Padlocks have been provided on roof inspection hatches to prevent unauthorised access.
Water is fed via a single supply main from the water storage tanks through the pressure boosting pumps to supply sufficient water pressure to the hospital pipeline network.
Two sets of four Grundfos vertical inline booster pumps are configured in a duty/standby arrangement. Variable frequency drives are fitted to each pump to provide additional flexibility in-flow control.
The water distribution consists of two main pipelines, each of which has the capacity to provide water to all areas of the hospital, thus providing 100% redundancy in the event of a pipe failure. The pipelines are as follows:
- A HDPE above ground suspended pipe located in the service tunnel and running through the basement of the buildings.
- The second pipe HDPE pipe buried within the site grounds and distributed to the buildings via off-takes.
3.1.2 Building Pipework
Internal pipework consists of mainly copper and polypropylene pipes running through the ceiling and wall cavity space.
3.1.3 Hot Water Systems
Hot water Rotex storage tanks located throughout the buildings distribute hot water internally via copper pipework. Return lines to top of hot water tanks may have reduced water temperature but quickly heats again within this storage tank to 60ºC. Top up water to these tanks is from Bosch32 commercial hot water gas heaters, heating water to 75 ºC. All hot water out-going and return lines are lagged with silver coated insulation.
Hot water is automatically maintained by the Rotex water heating system at a standard 65°C up to the TMV’s. All water downstream of the TMV’s is regulated to prevent scalding.
3.1.4 Thermostatic Mixing Valves (TMV’s)
GCUH uses thermostatic mixing valves (TMV’s) to regulate hot water temperature through faucets by reducing the hot water temperature to 42°C (38°C in children’s wards), so as to prevent patients being scalded. A remote sensor alerts to temperature mal-function. TMV’s are located in locked stainless steel access boxes generally under hand basins. Each TMV services two showers and two hand basins (total of eight hot and cold water outlets) which minimises the downstream pipe leg length that will be subject to tepid water. One of the hand basins is positioned the longest distance away from the TMV. TMVs are monitored via an ENWARE system which reports back to the BMS.
3.1.5 Point of Use Equipment
Equipment at point-of-use varies in type, size and flow rates. Equipment includes sinks, taps (incl. sensor), baths (baby, birthing and burns) and showers, dishwashers, washing machines, medical devices, fire sprinkler systems, drinking-water fountains and ice machines. All devices should be identified, together with frequency of use and preventative maintenance and repair specifications and schedules. Installation of backflow prevention should be recorded.4 Sensor taps are located in theatre, ICU and ED at GCUH.
Throughout the Hospital buildings fine Micron water filters are fitted at ‘zip’ hot/cold water units, bubblers and selected outlets (at ward ice machines). They are fitted mainly to protect internal workings of these units. These filters serve as a preventative measure only, with many forms of bacteria being smaller than 5 micron therefore unaffected by the filters. According to the World Health Organisation, aspiration of aerosols from ice has been associated with infection of immunocompromised patients or those with significant respiratory impairments (WHO 2007).
Safety Showers, eye-wash stations and an Ambulance bay Hazchem shower located external to ED are provided in laboratories and engineering workshops for staff and workers safety. These facilities can be prone to stagnation and growth of biofilms unless flushed regularly as part of maintenance/testing schedule. The stagnant water possibly containing biofilms may recirculate into other areas of the water distribution system.
3.1.6 Infrequently Use or Closed Wards
Individual levels in GCUH’s multilevel buildings are fed via an offtake from a single rising main. In the event that a ward or building level is closed or infrequently used, this piping arrangement does not facilitate water throughput and thus water can become isolated or stagnant within the pipework. Residual chlorine will decay over time and an environment can be created which is more conducive to bacterial growth.
3.1.7 Reclaimed Rain Water
GCUH utilises a rainwater capture and storage system for water irrigation of the GCUH grounds and landscaped areas. Rainwater is captured from roof runoff and stored in various underground tanks located around the site. If there is insufficient rainwater available, makeup water will be supplied with potable water to these tanks. Currently there is no water treatment provided to the rainwater prior to use however the pipe work is clearly marked as non-potable water to prevent consumption.
3.1.8 Irrigation
Landscaped areas throughout the hospital are irrigated with rainwater from the underground tank and pipe network. All irrigation water pipes are lilac to represent non-potable water. Water is irrigated through both sprinklers and drip fed systems (courtyards only).
3.1.9 Cooling Towers
Eight cooling towers are located on the second floor of Block P, central energy plant (CEP). Access to the annex building and second floor is restricted to prevent unauthorised access. The cooling towers are located behind a series of mist eliminators to reduce the emission of aerosols.
.Feed water into the cooling towers is injected continually with a biocide to control bacteria growth. Water quality sampling is performed at all of the cooling towers. All sampling and maintenance of cooling towers is performed monthly by a service contractor in accordance with AS 3666 Air-handling and water systems of buildings – Microbial control.
3.1.10 Firefighting Supply
Fire water supply for GCUH is stored in two 420,000 litre metal panel storage tanks located within the engineering services area which are physically separate from the potable water supply tanks. The fire water tanks are maintained at full supply level to ensure adequate supply at all times.
In the event of a fire, water pressure is boosted via a set of high pressure diesel driven centrifugal pumps located on the second floor of Block P, CEP. Fire reels are located at specific points around site and all buildings are fitting with overhead sprinkler systems.
3.2 High HPC Results
The summary of HPC results for hospital tests can be seen in the sheet below. Boxes highlighted purple show that there has been reporting of HPC in different blocks of hospital. Some of the results go as high as 24000.

The following approach helps to introduce the potential use of monochloramine in GCUH water distribution system in two different parts. They are as follows,
- Chlorine dosing pumps
- Potable water tanks
CHLORINE DOSING PUMPS
Ammonia addition at the chlorine dosing pumps is not feasible as it is very close to the hospital vicinity and the total disinfection time required for monochloramine will not be feasible.
Moreover, as the contact time is high and water goes to the water softening plant and in turn to the reverse osmosis plant. Total chloramines may not be reduced for dialysis purposes.
POTABLE WATER TANKS:
Ammonia addition at the potable tanks may be feasible for disinfection by monochloramine. Following calculation are done to check feasibility.
Calculation of required CT value for monochloramine:
CT value for monochloramine can be broken down into two segments. First is the tank section and the other for pipeline segment.
DATA
Pump capacity: ???
pH of water: 7.8
Tank volume (10% taken as operating volume) :
Residual required: 1.17 mg/L
Minimum water temperature: 18oC
Calculation of CT for tank:
Tank CT = C x T x BF
Where;
C = concentration of residual required
T = total time for water to reach 1st point of contact in hospital
BF = Baffling factor (taken as 0.7)
T = Volume of tank/ capacity of pump
T =
Tank CT =
=
Calculation for CT in pipeline
Pipeline diameter =
Area of pipeline = π D2 / 4
BF = 0.7
Distance between tank and 1st point of contact =
Volume of pipeline =
Pipeline CT =
Total CT =
The following table is taken from appendix of EPA guidance manual for disinfection profiling and benchmarking.
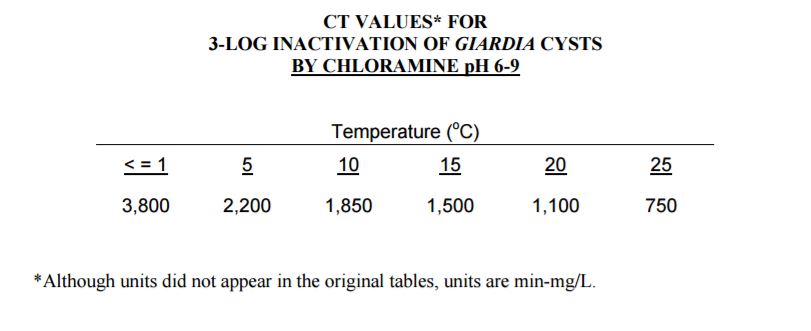
Table 3.1 CT values for chloramines
As the CT values required for disinfection through monochloramines is higher than over required calculated values. Monochloramine disinfection at the hospital potable tanks is not feasible.
FURTHER INVESTIGATIONS
As discussed above, the time taken for monochloramine to disinfect water is longer than the time it takes water to reach the hospital, it is not feasible to introduce monochloramine disinfection.
But, if we can isolate the required part of the hospital and disinfect it with monochloramine, it may be done. Hospitals use emergency situations to block and isolate parts of the building. This method can be used.
Moreover, the hospital irrigation tank system can be used to successfully implement the usage of monochloramine. At the moment, the irrigation system is isolated because of high reporting of HPC. There is no requirement of calculation of CT values as the water remains in the system for a longer time and is only used to irrigate the lawns and green belts across the hospital. It can be taken as an example to see the results and use this technique in future if needed.
The dosage calculations for monochloramine into the irrigation tanks is as follows:
IRRIGATION TANKS DOSING:
CONDITIONS:
- The system has no free ammonia present in it.
- The system contains free residual chlorine.
Flow rate =
Existing chlorine =
Existing ammonia = 0 mg/L
Desired monochloramine = 3 ppm or mg/L
Calculations:
Amount of monochloramine needed (pounds in day) = Flowrate x 0.012 x 3ppm
=
OR
Amount of monochloramine needed (g/h) =
Chlorine to Ammonia ratio needed = 5:1
(Source: http://www.tceq.texas.gov/assets/public/permitting/watersupply/pdw/Chloramines101_for_WEB.pdf)
So,
Chlorine =
Ammonia =
Existing chlorine
Free Chlorine (PPD) = Flow rate x 0.012 x ec
=
Free chlorine (g/h) =
Total Chlorine to be added
Total Ammonia to be added
Thus, according to the above calculations, monochloramine efficiency can be recorded by having a test run at the irrigation tanks system and then if needed in future, hospital parts can also be disinfected in the same way by isolation of particular parts.
RESULTS AND DISSCUSIONS
REFERENCES
Wang H, Edwards M, Falkinham JO 3rd, Pruden A (2012) Molecular survey of the occurrence of Legionella spp., Mycobacterium spp., Pseudomonas aeruginosa, and amoeba hosts in two chloraminated drinking water distribution systems. Appl Environ Microbiol 78: 6285–629
Christman, K.A., Chlorine, Chlorine Chemistry Council, Arlington, VA, USA, Available at http://www.cepis.org.pe/eswww/caliagua/simposio/enwww/ponencia/ponen8.doc
LeChevallier MW, Cawthon CD, Lee RG (1988) Inactivation of biofilm bacteria. Appl Environ Microbiol 54: 2492–2499
Zhang Y, Griffin A, Rahman M, Camper A, Baribeau H, et al. (2009) Lead contamination of potable water due to nitrification. Environ Sci Technol 43: 1890–1895.
Regan JM, Harrington GW, Noguera DR (2002) Ammonia- and nitrite-oxidizing bacterial communities in a pilot-scale chloraminated drinking water distribution system. Appl Environ Microbiol 68: 73–81
Hoefel D, Monis PT, Grooby WL, Andrews S, Saint CP (2005) Culture-independent techniques for rapid detection of bacteria associated with loss of chloramine residual in a drinking water system. Appl Environ Microbiol 71: 6479–6488.
Nguyen C, Elfland C, Edwards M (2012) Impact of advanced water conservation features and new copper pipe on rapid chloramine decay and microbial regrowth. Water Res 46: 611–621.
Chen X, Stewart PS. Biofilm removal caused by chemical treatments. Wat Res 2000;34:4229-33.
US Environmental Protection Agency. The history of drinking water treatment. Available at http://www.epa.gov/safewater/consumer/pdf/hist.pdf
EEA Commission Decision of 9 February 2012 concerning the non-inclusion of certain substances Annex I, IA or IB to Directive 98/8/EC of the European Parliament and of the Council concerning the placing of biocidal products on the market. Official Journal of the European Union; L 38/48; 11.02.2012.
Park SK, Kim YK. Effect of chloramine concentration on biofilm maintenance on pipe surfaces exposed to nutrient-limited drinking water. Water SA 2008;34:373-80.
Kandiah, A., Yassin, M.H., Hariri, R., Ferrelli, J., Fabrizio, M., Porter, L., et al. (2012) Control of Legionella Contamination with Monochloramine Disinfection in a Large Urban Hospital Hot Water System. American Journal of Infection Control, 40, e84.
Marchesi, I., Ferranti, G., Bargellini, A., Marchegiano, P., Predieri, G., Stout, J.E. and Borella, P. (2013) Monochloramine and Chlorine Dioxide for Controlling Legionella pneumophila Contamination: Biocide Levels and Disinfection By-Product Formation in Hospital Water Networks. Journal of Water and Health, 11, 738-747
 Centers for Disease Control and Prevention. Summary of notifiable diseases- United States, 2006. MMWR 2008; 55(53): 17.
Hall, E.L, and Dietrich, A.M., A Brief History of Drinking Water, Rhode Island Water Resources Board, Available at http://www.wrb.state.ri.us/program_eohistory.html
Curtis, M. and Johnston, E., Chlorine Disinfection, Civil Engineering Department, Virginia Tech, Available at http://www.cee.vt.edu/ewr/environmental/teach/wtprimer/chlor
The American Chemistry Council’s Chlorine Chemistry Division, A Giant Step for Public Health: Chlorination in Chicago & Jersey City, Available at http://www.americanchemistry.com/100years/CityHistory.pdf
US Environmental Protection Agency. Microbial and Disinfection Byproduct (MDBP) Rules. Available at http://pubweb.epa.gov/ogwdw/mdbp/mdbp.html#trihalomethanes
Cite This Work
To export a reference to this article please select a referencing stye below:
Related Services
View all


Related Content
All TagsContent relating to: "Health"
Health is the general condition of the body or mind. The World Health Organization defines health as “a state of complete physical, mental and social well-being and not merely the absence of disease or infirmity.”
Related Articles

DMCA / Removal Request
If you are the original writer of this dissertation and no longer wish to have your work published on the UKDiss.com website then please: