Low Risk Investing Strategy in China and Taiwan Markets
Info: 10201 words (41 pages) Dissertation
Published: 9th Dec 2019
Abstract
This study focuses on low risk investing strategy, namely betting against beta (BAB) strategy, to arbitrage low risk anomaly in China and Taiwan benchmark indices. This kind of market selection can not only ensure the tradability of long-short strategy, but also eliminate the impact of transaction cost from illiquid stocks. The empirical results contribute to the fact that the low beta anomaly is indeed discovered in China and Taiwan high liquid stock markets and significant abnormal returns are triggered by implementing BAB strategy, even after considering transaction cost. Finally, robustness checks is performed and provide consistent results across time and in other major East-Asia stock markets.
Table of Content
2.1 Seminal papers of the low risk investing factor:
2.2 Empirical evidence on low risk investing cross-sectional predictability:
2.3 Explanation of low-risk investing predictability
2.4 Interaction with other cross-sectional characteristics in the literature:
2.5 Conclusion and Gap in the literature
3.2 Preliminary Considerations: Ascertaining the Existence of the Beta Anomaly
Chapter 1. Introduction
How can investors earn higher return in the market? The standard advice given by the capital asset pricing model (CAPM) is that taking higher risk can provide higher return for investors. Thus, in an efficient market, investing in more volatile stocks, on average, should gain more return than less volatile stocks. However, the notion of low risk investing powerfully challenged this risk-return tradeoff by several empirical research undertaken in US and international equity markets. Over almost a century, high beta stocks have consistently underperformed low beta stocks (Baker, Bradley, and Wurgler 2011; Frazzini & Pedersen 2014; Baker, Bradley, and Taliaferro 2014; Chow, Hsu, Kuo, and Li 2014).
Based on this idea, Frazzini & Pedersen (2014) further established a new portfolio factor, namely betting against beta (BAB) factor, to extract low beta anomaly benefit on the US market, which included thousands of stocks in each long-short portfolio. However, although this is useful to document beta anomaly and the performance of BAB factor, this method has problem of practical implementation. Auer & Schuhmacher (2015), therefore, promoted an enhanced strategy in high liquid stock markets to exclude those illiquid stocks in Frazzini & Pedersen (2014) paper, which is not only more favorable for trading purpose, but to reduce the impact of high transaction cost from illiquid stocks and the constraint of short-selling. This paper, therefore, further adds on previous studies by empirically assessing the extent of low beta anomaly and the performance of BAB portfolio in two high liquid East-Asia markets. So, two research questions are proposed:
Whether low beta anomaly exist in China and Taiwan high liquid stock markets? If so, whether it can be exploited by constructing BAB portfolio?
To address these questions, the next section will discuss low risk investing from most relevant literature to form the literature review, which then become the baseline for following empirical study. After that, the empirical analysis will replicate the methodology proposed by recent researchers and then further examine the robustness by different time frames and an out of sample test. Finally, the outcomes will be summarized in the conclusion to answer research questions.
Chapter 2. Literature Review
The findings of low risk anomaly lay out a new pathway for sophisticated investors to extract benefit from the market. After the first documented papers (Black et al., 1972), this pervasive phenomenon has been widely discussed because of its stunning performance. Many scholars tried to examine its predictability empirically and found possible driven factors to decompose this anomaly as well as to identify its uniqueness. The following paragraphs firstly explore the seminal papers of low risk investing and then condense other empirical findings from different angles and limitations. Later on, the disputed causes of the anomalous return are outlined and discussed under behavior and risk perspectives, which provides foundation of empirical study. Lastly, the magnitude of low beta anomaly to market, size, value and momentum effects is discussed to broaden further insights.
2.1 Seminal papers of the low risk investing factor:
The positive abnormal return of low volatility or low beta stocks has been documented since 1970s and now, after financial crisis, attracts considerable interests from academic researchers and practitioners (Black et al., 1972; Haugen & Heins, 1975 and Buchner & Wagner, 2016).
Moreover, recent studies have reported that the existence of low risk anomaly demonstrates a relatively flat security market line (SML) compared with standard CAPM (Frazzini & Pedersen, 2014; Asness, Frazzini & Pedersen, 2012; Black, Jensen & Scholes, 1972). Asness, Frazzini & Pedersen (2012) has undertaken an empirical study to indicate the outperformance of low beta effects across asset classes and 11 countries during the period of 1926-2010. Their results show that high beta stock offers low risk-adjusted return, while low beta stock offers high alpha. These, then, are extended by Frazzini & Pedersen (2014) to construct a new return predictive signal, BAB factor, which goes long in low beta security and shorts selling in high beta security. The BAB strategy is a self-financing and beta neutral strategy. To build a BAB trading portfolio, the portfolio holds low-beta stocks, leveraged to a beta of one, and sells high beta stocks, de-leveraged to a beta of one. This will make the overall portfolio beta equal to zero and theoretically beta neutral.
The authors applied BAB strategy empirically to earn significant beta anomaly benefit between 1926 and 2012. Their research firstly included US and other 19 international stock markets together with different asset classes sorted by beta (e.g. Equity, Treasury Bond, Futures, Currency and Credit) and found consistent results that the risk-adjusted return and Sharpe ratios declined along with the increase of beta, which suggested that this inverse risk-return relationship is not unique in the US stock market but a universal phenomenon. The studies of Chow, Hsu, Kuo, and Li (2014) and Baker et al. (2011) also supported this finding. They claimed that this pervasive global effect is not only persistent across geographies and over time, but also the greatest anomaly in finance field.
This BAB strategy is robust under several additional checks conducted by Frazzini & Pedersen (2014). The window lengths and benchmarks to estimate beta were substituted and alternative risk-free rate was applied, which aimed to test whether the final outcomes will be different or not. Finally, they performed an out of sample test and concluded that with all these tests, the results showed significant risk-adjusted returns.
2.2 Empirical evidence on low risk investing cross-sectional predictability:
The seminal papers of low risk investing strategy have paved the way to the analysis of a series of study and therefore abundant literatures have been proposed to empirically examine the predictability of low risk investing strategy. This paragraph summarizes the properties of large and small scales of low-risk strategy and then indicates some possible limitations.
Macro & Micro effects: According to Baker, Bradley and Taliaferro (2014), the low-risk anomaly in US and international markets is the evidence of market inefficiency and should be explained under micro and macro level, which is under the spirit of the study proposed by Samuelson (1998). Under micro level, the stocks are selected by lower stock-level risk, holding country and industry risk constant. In contrast, the portfolio selection of stocks under macro level is based on lower country or industry risk, holding stock-level risk constant. First of all, the authors hired 60 months of data to examine the stock-level portfolio in the sample of US and up to 31 developed markets. The Low-minus-High (LMH) portfolios generate significant 6.76% and 9.24% risk-adjusted return, respectively. They further test the turnover frequency via lagged betas up to 12 months, and still find similar ability to predict future return, which shows that turnover is of limited value. In terms of liquidity, Baker et al. (2011) stated the low beta effect is even robust in the largest 1000 stocks in the Center for Security Price (CRSP) data. With these characteristics comprised by low turnover and low-risk investment in large-cap stocks, Baker, Bradley and Taliaferro (2014) suggested the low risk strategy such as constructing LMH portfolio is implementable under certain circumstance.
Moreover, their study provides the evidence of low risk anomaly to apply low risk strategy in macro level and discuss how interaction of macro and micro effects contributes to stock return. From macro level perspectives, Baker, Bradley and Taliaferro (2014) found that beta anomaly exists not only across industries in the US, but also across countries in the international markets, which both present significant LMH return, 3.65 alpha and even higher 6.86 alpha, respectively. Additionally, they further examine the interaction of macro and micro effect by combining independent quintile sorts in previous stock-level, industry-level and country-level into double-sort methodology. Independent quintile breakpoint is used to assign each stock to portfolios based on its own and industry beta each month. Portfolio stocks are weighted with respect to their market capitalization and then build stock-industry portfolios. Similarly, the stock-country portfolio is constructed under the same process. These double-sort portfolios can help researchers to control either stock, industry or country effects and demonstrate that industry selection, stock selection and even country selection have made material contributions to the outperformance of low-risk investing strategies. For example, their sample results show pure industry effect brings benefit in LMH portfolio of 1.53% alpha, while pure stock effect has 4.44% alpha in LMH portfolio. Also, the pure country effect presents significant high alpha of 6.22%, whereas the within country effect has 5.4% alpha.
Interestingly, the authors find that the micro selection of stocks leads to a remarkable reduction in risk, with only modest differences in return. Even holding constant country- or industry-level risk, it is still easy to form lower-risk portfolios through stock selection, and these portfolios all generate material return. For instance, in Japan or utility industry, high-risk stocks can be distinctly identified, but they have similar raw returns averagely in comparison of low-risk stocks in the same industry or country grouping, and thus low risk portfolio can have lower risk but maintain similar return as high risk one. This evidence complements the ideas that limits of micro arbitrage in low-risk stocks come from traditional fixed-benchmark mandates (Baker et al., 2011). Meanwhile, the macro selection of countries particularly results in the increases in return, with only slight differences in risk. Countries that are identified as high-risk ex ante are only slightly higher risk in the future, but they suffer lower returns distinctly. This evidence supports the limits to macro arbitrage across countries and industries.
These findings are enhanced by the research of Asness, Frazzini & Pedersen (2014). The “original” BAB factor is constructed without concerning the industry effect and thus, to identify whether BAB performance is driven by industry bets, stock selection or a combination of these two, they established industry-neutral and industry BAB portfolio, and compared with regular BAB portfolio. Their outcomes confirmed the exceptional performance of low risk investing in almost all industries among US and internationally. They found that both types of industry-related BAB portfolio have noteworthy benefit and that the regular BAB performance is due as much to stock selection as to industry selection (and more so in US), which is a rebuke to the idea that BAB is purely driven by industries. Historically, the industry-neutral BAB factor has generated a higher Sharp ratio than industry BAB factor both in US stock market and 24 MSCI developed markets. Even more, since the BAB factor require rebalancing over time, transaction cost should not be omitted regarding the portfolio performance (Li and Sullivan 2010; Li, Sullivan, and Garcia-Feijóo 2014). To study this aspect, the authors also take transaction cost into account and obtain consistent results among all BAB portfolios.
Trading Cost & High Liquid Market: Despite the astonishing performance of low beta effects, the low risk investing may have some limitations in practical. Garcia-Feijóo, Kochard, Sullivan, and Wang (2013) suggested that the so-called low-risk anomaly might be reclassified and renamed as “high risk” anomaly to more accurately describe the fact that the anomalous historical returns are found primarily among stocks in the high-risk quintile. Subsequently, the property of low risk anomaly is discussed to explore whether this strategy can be applied in practice, or more specifically, whether investors can successfully extract the abnormal return out of low risk portfolio. As stated by Li, Sullivan, and Garcia-Feijóo (2014), the existence and trading efficacy of low-risk stock anomaly were more limited than widely believed. Even though their findings support the evidence of low risk benefit, they pointed out that the excess returns of zero-cost, low-risk portfolios (low risk minus high risk) reverse rather quickly, only exists in t+1 month, which require traders to rebalance frequently in any attempt to successfully extract profits. On one hand, their empirical findings indicate the anomalous returns of value-weighted portfolios are largely eliminated when low-priced (less than $5) stocks are excluded. On the other hand, the abnormal return of equally-weighted portfolio even vanishes when low-priced stocks are taken away, which again shows that the low risk anomaly may concentrate in high risk, illiquid and small stocks. Any excess returns associated with the value-weighted portfolio, high transaction cost, given the frequent rebalancing, meaningfully eliminates the low volatility effect. Altogether, their evidence concludes that attempts to extract the abnormal return of low-volatility portfolios are substantially influenced by market frictions such as high transaction costs.
Nevertheless, the previous argument that low-beta stocks outperformance high-beta stocks only in small market capitalization has been seriously challenged in the study of Auer & Schuhmacher (2015). The authors considered liquidity and transaction costs in the practical implementation of BAB strategy. They analyzed whether the beta anomaly can be exploited in 30 highly liquid (large capitalization) stocks in the Dow Jones Industrial Average (DJIA ) from 1926 to 2013. They proposed this idea to enhance the viability of regular BAB factor, because a typical BAB portfolio, on average, is long in about 1,500 low-beta stocks and short in about 1,500 high-beta stocks (Frazzini and Pedersen, 2014). Although this approach is useful to document anomalies, to construct new explanatory factors in multifactor asset-pricing models, and to have a more statistically representative perspective, it is almost not implementable for actual investors. In practice, investors or fund managers would set up smaller portfolios rather than such large ones to exclude some portion of illiquid securities for trading purpose (Bradley et al., 2006). Together with the important impact of transaction cost proposed by Li, Sullivan, and Garcia-Feijóo (2014), the authors therefore constructed a BAB portfolio composed by highly liquid stocks that ensure tradability and low transaction costs. Specifically, transaction costs tend to decline as the market value of stocks increases (Frazzini, Israel & Moskowitz, 2012), and highly liquid stocks in DJIA would not be restricted on short selling, which is usually the problem of illiquid stocks and further provide a great platform for long only or long-short portfolios.
In the sample period of 1926–2013, their study provides several insights that are interesting from both a scientific and a practical perspective. First, they found strong evidence that low risk strategy is applicable in DJIA stocks. Sharpe ratios and alphas of beta-sorted portfolios almost monotonically decline with the increase of betas, indicating an inverse risk–return relationship. These results make the anomaly even more astonishing because one would expect the actively traded stocks in the DJIA to be most efficiently priced. Second, they found that the excess return of BAB strategy cannot be explained by exposure to standard asset-pricing factors. Thus, in contrast to the findings of recent studies, exploiting the beta anomaly appears to be possible even within a universe of highly liquid stocks. Third, their findings are robust under different circumstances. For example, the sample period covered before and after financial crisis. Also, the method of calculating beta estimator and its specific parameterization (window lengths, adjustments) critically affect neither the existence of the beta anomaly nor the performance of strategies that seek to extract its characteristic returns.
2.3 Explanation of low-risk investing predictability
The rationale of predictability behind the low risk investing strategy is not new and constituted by low beta effects, which has been explained sufficiently since Black (1972) and Haugen & Heins (1975).Subsequently, a series of studies has been proposed to explain this low volatility phenomenon and provide more solid foundation of the profitability of low risk strategy. This paragraph summarizes various possible explanations from both behavior and risk perspectives.
The beta anomaly has been explained from a variety of behavioral finance perspectives. In the portfolio formation, the abnormal demand of high risk or volatility stocks pushes up those stocks’ price, thereby reducing the required return of portfolio. As stated by Baker, Bradley & Wurgler (2011), the first explanation of this irrational behavior is preference of lottery. Investors have tendency to gamble on lotteries and roulette wheels, which, more specifically, is more about positive skewness than it is about volatility. In other words, investors believe that large positive payoffs are more likely than large negative ones. The previous paper also found that some individual investors do show a clear preference for stocks with lottery-like payoffs, measured as idiosyncratic volatility or skewness (Kumar, 2009). Another explanation of this irrational behavior is representativeness (Baker, Bradley & Wurgler, 2011). In short, even though event A is less likely than event B, people would choose event A if it is more “representative”. Investor would expect new technology or some other “representative” items to bring stocks up to a high level and earn speculative profit, which largely ignore the high probability to fail, and thus overpay for high volatility stocks. The other explanation is that investor is overconfident on their decision. They would stick with the false precision of their estimates. The extent of persistence is likely higher for more uncertain outcomes—such as the returns on high-volatility stocks, which is consistent with the paper of Cornell (2009). On the other hand, pessimists must act less aggressively than optimists, so investors have a general inability to short stocks rather than to buy. Empirically, it is perceivable to find the scarcity of short sales among individual investors and even institutional investors. Thus, it means that prices are generally set by optimists, as pointed out by Miller (1977). More striking stocks will attract more optimists and will sell for higher prices, leading to lower future returns.
With the previous argument, a deeper and economic question rise: Why sophisticated institutional investors do not capitalize on the low-risk/high-return anomaly? According to the simple model of Brennan (1993), the typical institutional investors are appointed to beat a fixed benchmark without using leverage, which discourages the arbitrage activity to earn excess return and increases the demand of high beta assets. Baker et al., (2011), argued that, in real world, many institutional investors are restricted to use leverage, such as pension fund and mutual fund, and the standard contract with fixed benchmark boosts portfolio managers to take higher risk for beating market return. As long as these institutional investors keep controlling large shares in the market, this beta anomaly will not vanish any time soon. This is complemented by the study of Frazzini & Pedersen (2014). They studied the equity portfolios of mutual funds and individual investors, which are likely to be constrained. Consistent with their prediction, they found that these constrained investors hold portfolios with average betas above one. Furthermore, their expression clearly demonstrated how risk premia is affected by the tightness of portfolio’s constraint and proposed that tighter constraints of portfolio lead to a flatter SML by increasing the intercept and decreasing the slope. Compared with standard CAPM implying that risk-free rate is the intercept of SML, the intercept here is increased by blinding portfolio constraint. Further, Frazzini & Pedersen (2014) stated two reasons to explain why zero beta portfolio require return in excess of the risk-free rate. On the one hand, constrained investors prefer to invest limited capital in risky assets to chase higher return. On the other hand, unconstrained agents do invest considerable amount in zero beta portfolios, so, from their viewpoint, the risk of these assets is not idiosyncratic. Accordingly, in equilibrium, zero-beta risky assets must offer higher return than risk-free rate. In addition, the funding constraints further result in a lower slope of the SML, namely a lower compensation for one marginal increase in market risk. This is because constrained agents need higher unlevered return and hence are willing to accept less compensation for higher risk. Subsequently, the authors revealed two characteristics of the profitability of BAB strategy. One is that the size of the expected return depends on the spread of betas. The large spread, the bigger return. The other is to identify that BAB factor is exposed to funding liquidity risk, in other words, funding liquidity shock causes negative return for BAB factor as its required return increases.
Schneider, Wagner & Zechner (2016) provide another insight from risk perspective for understanding beta anomaly. Inspired by the spirit of Harvey and Siddique (2000) that conditional skewness helps explain the cross-section of equity returns, the authors explained this phenomenon theoretically and empirically from risk angle and found that low-risk anomaly is driven by return skewness. A natural source of time-varying skewness in stock returns is corporate credit risk. Higher credit risk is associated with higher ex-ante variance and more negative ex-ante skewness. Left-skewed firms face the most extreme downside risk and exhibit less co-skewness with markets, compared to firms with high ex-ante skewness. For given asset volatility and leverage, CAPM betas increase as the correlation of the firm’s assets with market rises. For given credit risk, the BAB strategy therefore benefits from buying stocks with low and selling stocks with high correlation of firm assets with markets. More precisely, they claimed that betting against beta strategy creates high risk-adjusted abnormal returns among the firms exhibiting the most negatively skewed return distributions, but not among stocks with highest ex-ante skewness. The skew-related return differential of betting against beta anomaly among low skew to high skew firms is the amounts from 1.15% to 1.76% per month when using CAPM betas, estimates of ex-ante variance, and measures of idiosyncratic volatility relative to the CAPM.
2.4 Interaction with other cross-sectional characteristics in the literature:
Despite the profitability of low-risk strategy has widely documented and many possible reasons has been proposed in recent years, two issues are still questionable: whether this anomalous return can be absorbed from other asset-pricing factors or how they interact with each other. The following paragraph presents the summary of how recent papers address these questions.
The abnormal BAB return is not only economically and statistically significant in Fama and French (1993) three factors model, i.e. market, size and value effects, but also significant after accounting for Carhart (1997) momentum factor as well as Pastor and Stambaugh (2003) liquidity factor (Frazzini & Pedersen, 2014; Asness, Frazzini & Pedersen, 2014). Specifically, in the study of Frazzini & Pedersen (2014), the alphas of BAB portfolio decline monotonically with respect to one, three, four and five factors model and end with 0.55% per month. The authors further added that the BAB factor’s realized market loading is not exactly zero, reflecting the fact that the ex-ante betas are measured with noise. In fact, other paper has documented that the coefficient of the market factor is negative, which suggests that the BAB trading portfolios tend to rise when the market falls (Auer & Schuhmacher, 2015). Chow et al. (2014) further extended this statement and argued that much of the difference between the returns of the low-volatility portfolios and the cap-weighted indices is because low-volatility portfolios have market betas less than one. As such, low-risk portfolios will have outperformance in the upward-moving market and underperformance in the downward-moving market.
Moreover, Frazzini & Pedersen (2014) also report that compared to high-beta stocks, low-beta stocks are likely to be larger and have higher book-to-market ratios, which is natural and persistent with their theory that low-beta stocks are undervalued whereas high beta stocks are overvalued. Additionally, as stated by Chow et al. (2014), the relationship between low beta and value is intuitively clear. Low volatility stocks tend to be the stocks that less attract media mentions and investor attention. Generally, high-beta stocks tend to belong to growth industries; eliminating them would naturally result in a more value-oriented portfolio. The positive correlation between the value and BAB factors in their study also supports this observation. However, the low beta only defeats the value effect over any short to intermediate horizon—that is, in an upward-moving market, a low-volatility strategy would still be less beneficial even if value stocks performed well. As a result, the abnormal returns tend to show weak correlation with value stocks and strong negative correlation with the cap-weighted index in spite of low-volatility portfolios’ substantial value loading. This is similar to the result of Asness, Frazzini & Pedersen (2014). Also, although the standard BAB has a positive value exposure, the industry-neutral BAB strategies have very low—and sometimes negative—loadings on the value factor, thus strongly rejecting the notion that low-risk investing is entirely driven by industry or value exposures.
2.5 Conclusion and Gap in the literature
The purpose of this literature review is to offer better understanding about low risk anomaly and lay out a pathway for the following empirical analysis.
As previously stated, it is clear to conclude four main sessions. This prevalent anomaly has been widely and empirically documented and it is universal across different asset classes. Several robustness tests have been conducted and thus ensure the stable result of this strategy (Frazzini & Pedersen, 2014; Chow, et al., 2014; Baker et al., 2011). Next, the low risk anomaly is perceived to have outperformance under either Micro or Macro level (Baker, Bradley and Taliaferro, 2014). Remarkable risk-adjusted return is witnessed among country, industry and stock selection. Previous analysis further reported that the micro and macro risk-adjusted returns increase with different reasons. The former offers notably lower risk with modest differences in return, while the latter significantly enhance portfolio return with moderate increase in risk. What’s more, the regular BAB portfolio is contributed by both stock and industry selection, which ruled out the notion that the BAB benefit is entirely driven by industry bet. Moreover, intra-industry BAB portfolio has been discovered outstanding performance in almost all industries around the world (Asness, Frazzini & Pedersen, 2014).
Followed by the concern of its limitation, transaction cost, market capitalization and liquidity are considered to evaluate this strategy. Given the finding that benefit of LMH portfolio reverse rather quickly, transaction cost should not be omitted regarding the portfolio performance (Li, Sullivan, and Garcia-Feijóo, 2014). Baker, Bradley and Taliaferro (2014) have argued that the method to estimate ex-an beta may lead to only a few change in short term and therefore result in limited turnover rate and low transaction cost. Nevertheless, it is more forward looking for concerning portfolio performance after portfolio formation, which is the way undertaken by Li, Sullivan, and Garcia-Feijóo (2014) and highlighted for future investors. In addition, even though some authors have stated that low risk anomaly highly focus on small and illiquid stocks, a study in DJIA provide different arguments, which indicate that it is possible to capture significant low-risk anomaly in high liquidity market and even after adopting the measure of transaction cost (Auer & Schuhmacher, 2015).
Finally, either from behavior or from risk base, low risk anomaly can be explained from different angles: lottery preference, representative and overconfidence (Baker, Bradley & Wurgler, 2011; Barberis, Nicholas & Huang, 2008; Cornell, 2009), fixed benchmark mandate and constrained leverage (Baker, Bradley & Wurgler, 2011; Frazzini & Pedersen, 2014) and lastly return skewness (Pau, Christian & Josef, 2016). Furthermore, after examining for market, size, value, momentum and liquidity, the low risk investing remains statistically significant alpha and may indicate that the anomalous return is partially affected by value factor in a short run. The negative relationship between market factor and low risk factor also show that this strategy has better performance in bear market rather than bull market.
According to the overview above, there are still some questions remained. With the fact pointed by Auer & Schuhmacher (2015), high liquid stock market in US can offer good low risk benefit. However, whether beta anomaly exist in East-Asia high liquid stock markets? If so, whether it can be exploited by long-short portfolio or long only portfolio? This is where gap exists in the literatures. Hence, this study aims to investigate low risk phenomenon and BAB effects in major East-Asia high liquid markets. The following empirical sections will address these issues and provide robustness tests under different settings afterwards.
Chapter 3 Empirical Research
The section introduces the portfolio methodology and develops a quantitative strategy to arbitrage the benefit of low risk investing. To answer the research questions mentioned above, the existence of beta anomaly is initially scrutinized by calculating the alpha of beta-sorted portfolios and then beta-related portfolios are established to test the exploitability of BAB strategy. Lastly, different time frames and an out of sample test are performed to ensure robustness.
3.1 Sample Description
According to Li, Sullivan, and Garcia-Feijóo (2014), it is arguably that BAB strategy is only applicable in illiquid, small stocks. However, the research of Auer & Schuhmacher (2015) provided an opposite result and enhanced the profitability of BAB strategy.
Therefore, the universe of this study is inspired by their study and selected from highly liquid East-Asia stock markets, Shanghai Stock Exchange 180 Index (SSE180) and FTSE TWSE Taiwan 50 Index (TW50). The constituent of both indices are the most representative stocks in the Shanghai Stock Exchange and Taiwan Stock Exchange, which the former accounts for about 71% market value of Shanghai A share stocks and the latter accounts for nearly 70% of the Taiwanese market. (SSE, 2010; FTSE Russell, 2017). The time frame of portfolio is from January of 2002 to December of 2016. This 15 years (180 months) include financial crisis period and recovery period afterwards, which is to examine the robustness of the strategy and distinguish whether the BAB effect is stronger before or after financial crisis. In addition, the stocks were selected with at least 120 months of non-missing data to estimate beta and correlation and thus the universe of portfolio includes 136 Shanghai A share stocks and 47 stocks in Taiwan Stock Exchange.
Return data is used and calculated from Datastream on monthly basis including dividends. This is considered for two reasons. One is that several papers has applied monthly dataset to get significant results and documented that it has no crucial different by replacing daily return to monthly return (Baker et al., 2011, 2014; Auer & Schuhmacher, 2015). The other is because that monthly data can provide lower rebalancing frequency and thus reduce the transaction cost which has been documented the important impact of BAB strategy by Li, Sullivan, and Garcia-Feijóo (2014).
Following Frazzini & Pedersen (2014) and Auer & Schuhmacher (2015), I computed betas with respect to the value-weighted market indices in each country. Excess return is above the risk-free rate from Asia-Pacific category in Kenneth French’s data library. The estimated beta is therefore calculated from rolling regressions of excess return on market excess return. The resulting estimator is
βi=ρim*σiσm (1)
σmare the estimated standard deviation for the returns and
ρimis the estimated correlation between the returns. To capture the time variation of beta, this estimation is performed with one-year daily data, which has been documented that the accuracy of the covariance estimation improves significantly with a higher sample frequency (Merton, 1980).
3.2 Preliminary Considerations: Ascertaining the Existence of the Beta Anomaly
The first step of the empirical analysis is to explore whether the beta anomaly can be detected within the China and Taiwan markets. Therefore, beta-sorted portfolios are constructed to visualize the risk-return relation and to ascertain the existence of beta anomaly in the universe. The 183 index constituents are ranked in ascending order on the basis of their estimated beta and then they are assigned to five quintile portfolios (Q1-Q5). At the end of each month, the performance overview is evaluated by regressing with Fama & French three factor model (1993) as well as adjusting for Carhart (1997) momentum factor, fitting the following equation:
ri,t-rf,t=αi+β1,irm,t-rf,t+β2,iSMBt+β3HMLi+β4UMDt+ϵi,t (2)
where
ri,t-rf,tand
rm,t-rf,tare the excess returns of portfolio i and market portfolio, respectively, and
ϵi,tis the error term. More formally, I evaluated portfolio Q1 to Q5 by performing regression of excess return based on market, size (small-minus-big, or SMB), book-to-market ratio (high-minus-low, or HML) and momentum factors (up-minus-down, or UMD). Those variable data needed for computation are retrieved from Kennth French’s data library. With monthly rebalancing, I then documented the factor-adjusted return of these portfolio over time.
The Figure 1 plots alphas from Q1 to Q5. Alpha is the intercept in the regression of the monthly excess return, reflecting the factor-adjusted return. The significantly positive four factor-adjusted return for the low beta portfolio and small or even negative value for high beta portfolio both imply that those standard factors, such as market, size, value and momentum, cannot explain its relatively strong performance and hence strongly indicate the existence of beta anomaly in China and Taiwan equity markets. The high alpha values of Q1 in both markets show that investors can take advantage of beta anomaly by trading actively. This finding is consistent with the results of Auer & Schuhmacher (2015). They tested the properties of beta-sorted portfolio in high liquid US market, DJIA, and found declining alpha across the portfolios are certain. Thus, it is clear to point out that beta anomaly can be discovered in China and Taiwan high liquid stock markets.
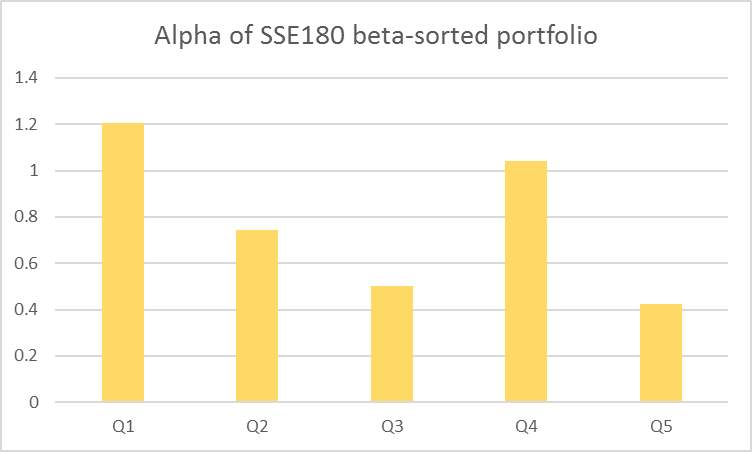
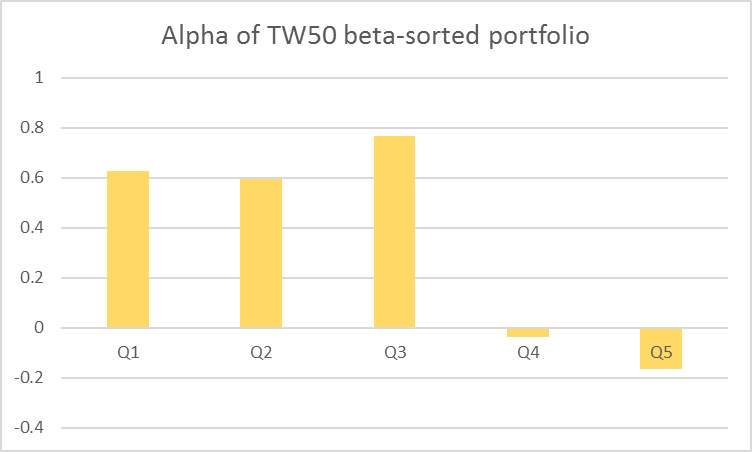
Figure 1. Alphas of beta-sorted portfolio. All quintile portfolio stocks are equally-weighted and the portfolios are rebalanced every month to maintain equal weights. Alphas are in monthly percent.
3.3 Portfolio Analysis
After ascertaining the existence of the beta anomaly in the universe, the BAB portfolio is introduced to access the exploitability of the anomaly and then regressed with equation (2) to evaluate factor exposures.
Portfolio Construction. To construct BAB factors, I go long in low beta portfolio and short in high beta portfolio. Specifically, the stocks in the universe are ranked in ascending order on the basis of their estimated beta and then they are assigned to five quintile portfolios (Q1-Q5). For each quintile portfolio, the weight of each stocks inside is given by their ranked betas; that is, lower-beta stocks had higher weights in the low-beta portfolio and higher-beta stocks had higher weights in the high-beta portfolio. Those portfolio are rebalanced at the end of every month. To construct the BAB portfolio, low beta (Q1) and high beta (Q5) portfolios are levered or de-levered to have a beta of one and therefore reach a self-financing beta neutral (zero beta) portfolio, fitting the following equation propose by Frazzini & Pedersen (2014) .
rt+1BAB=1βtLrt+1Low-rf-1βtHrt+1High-rf (3)
where
rt+1Low=ri,t+1*wi,low,
rt+1High=ri,t+1*wi,high,
βtL=βi,t*wi,lowand
βtH=βi,t*wi,high.
The larger long side investment is meant to make the BAB factor beta neutral because the stocks that were held long have lower betas. For example, Frazzini & Pedersen (2014) found that, on average, the US stock BAB factor is long $1.4 of low-beta stocks (financed by short-selling $1.4 of risk-free securities) and short $0.7 of high-beta stocks (with $0.7 deposited to earn the risk free rate).
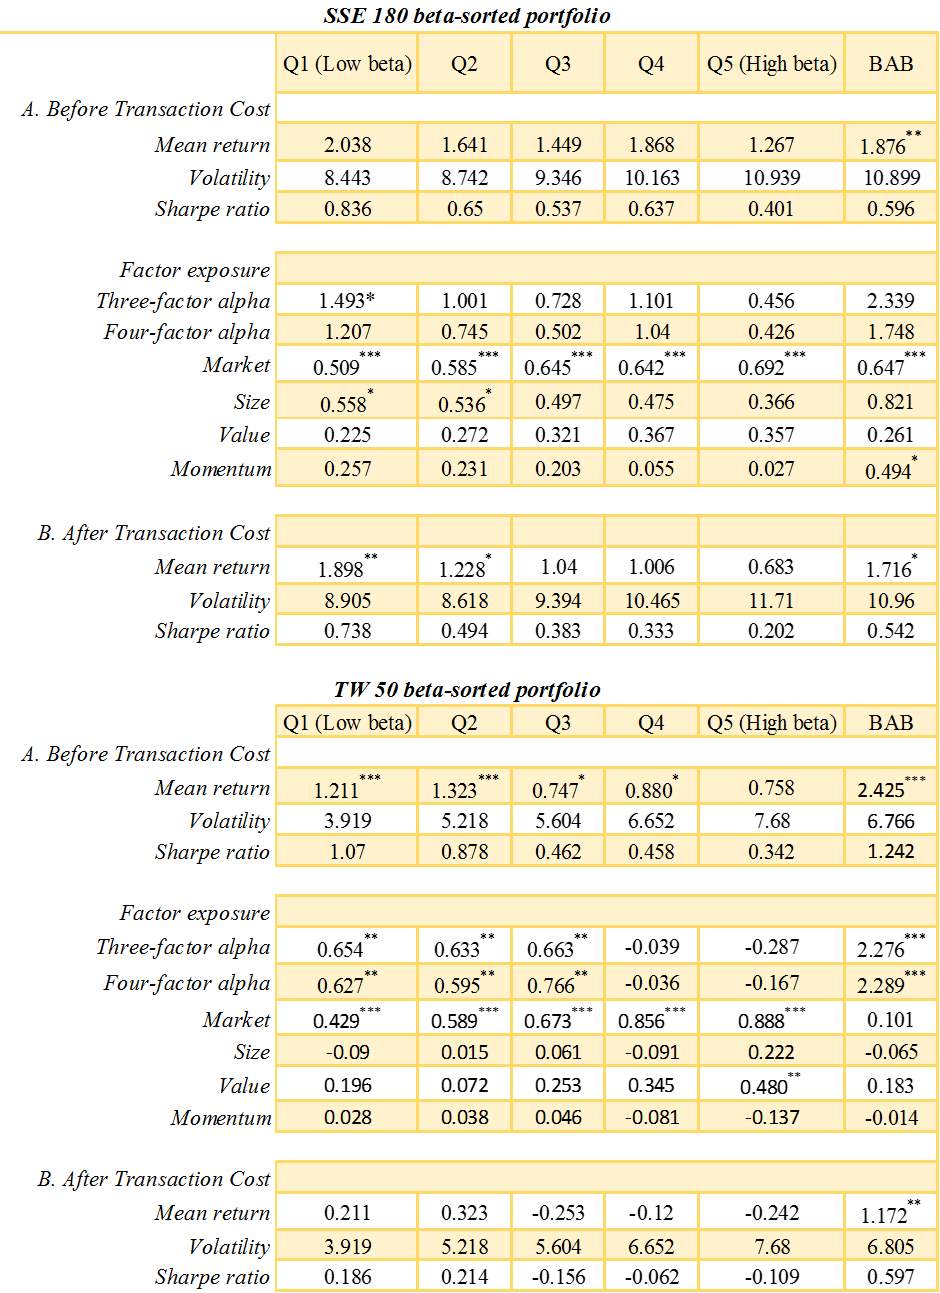
Portfolio Performance. In this empirical analysis, the stocks are separated into low and high betas as well as BAB portfolios to arbitrage the benefit of beta anomaly. Table 1 report the results of quintile and BAB portfolios before (Panel A) and after (Panel B) transaction costs. A first look at the basic excess return characteristic demonstrates that the average excess returns tend to decline when moving from the low beta to the high beta quintile. This finding is consistent with Baker et al. (2011) for the entire CRSP database and the 1000 highest market capitalization stocks. The volatility of low beta portfolio are much lower than high beta portfolio, which is partially attributable to the fact that beta sorted portfolios tend to produce outcomes similar to volatility based portfolios (Baker et al., 2011). Furthermore, the combination of declining return and rising volatility result in almost monotonically declining Sharpe ratios from the low beta to the high beta portfolios, which is in line with the result of Frazzini & Pedersen (2014). Moreover, it is interesting to note that the volatility of BAB portfolio tend to be similar with that of high beta portfolio, but with the increase of mean excess return, the amount of Sharpe ratio rise more. Despite some statistically insignificant of mean return after considering transaction costs, for example Taiwan market, the mean abnormal return and Sharpe ratio of BAB portfolios are still statistically and economically significant and up to 0.542% in China and 0.597% in Taiwan, which indicates BAB strategy still work well after taking transaction cost into account. In addition, while BAB portfolio in Taiwan tends to have lower volatility and higher Sharpe ratio, it is arguably that long-only portfolio can provide better benefit in China market. The results in Panel B also point out the important impact of transaction cost, which can hugely absorb the excess return of portfolios, for example Taiwan market.
In addition to basic portfolio properties, Panel A of Table 1 also presents the slope coefficient of the four factor regressions and thus documents the factor exposure of BAB strategy. With similar results as what Frazzini & Pedersen (2014) found, the market loading is not exactly zero, instead it is statistically significant. This reflects two findings. The key determinate of this BAB strategy, namely beta, is measured with noise and the positive coefficient of the market factor suggests that BAB portfolio tend to co-move with markets, which is in contrary of what has found in US market (Frazzini & Pedersen, 2014). In the case of a positive market shock, high beta stocks in China and Taiwan high liquid stock markets would not co-move strongly with the market but low beta stocks would. As a result, the long position of BAB strategy would increase the BAB portfolio value, which again shows the importance of low beta portfolios in China market. In terms of alpha, low beta and BAB portfolios are economically remarkable in SSE 180 index, though it does not have predictive power. This phenomenon is even better in TW 50 index to have statistically significant alpha, 2.289%. With respect to the remaining exposures, it can be seen that the value factor of BAB and low beta portfolios are positive in both markets while size factors are positive in China and negative in Taiwan. At the first glance, it is expected a roughly zero exposure to size and value ex ante because high market capitalization stocks are assigned to both long and short sides. However, it is noteworthy that the long side is levered and short side is de-levered so that the long side has larger impact to dominate the portfolio and provide sign consistent with the major characteristics of each market. Consequently, it may reflect the fact that size effects do not exist in Taiwan 50 index (Chiao, Hung &Yao, 2010; Chui & Wei, 1998) but value effect do, which is consistent in US markets (Frazzini & Pedersen, 2014). Also, SSE 180 index may have many high book-to-market ratio constituents and contains not only large capitalization but relatively small stocks as well. Finally, none of the momentum factor is statistically significant and fully explain the BAB strategy performance, which is consistent with Auer & Schuhmacher (2015).
Table 1: BAB trading strategy in SSE180 and TW50 (2002-2016)
3.4 Robustness Tests
To ensure that the key findings of empirical analysis were not driven by some specific timeline or by the bias of sample selection, I therefore performed two robustness checks. Because the results of these tests are similar to those reported in Tables 1, I concentrate here mostly on summarizing their main design.
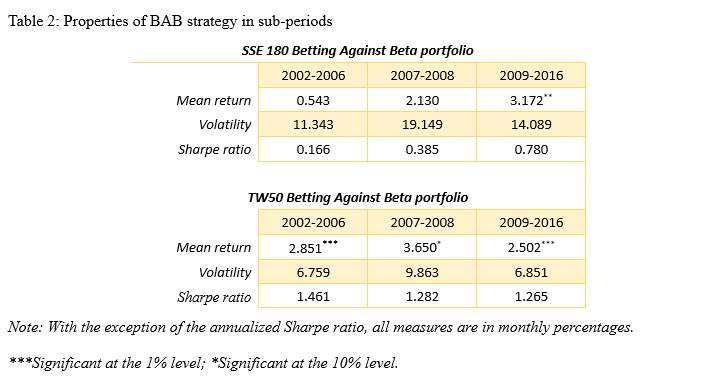
Sub-period performance: In the first robustness check, the portfolios are re-analyzed over time by subdividing the universe into different time frames. Specifically, I split the subsample into the period of last bull market before global financial crisis (2002-2006), the global financial crisis period (2007-2008) and the recovery period (2009-2016) afterwards. This is designed on purpose since the investment industry views the market environment as substantially different before and after the financial crisis. Also, it is to examine whether this strategy still work well during the period of drastic change in the financial market.
Table 2 summarizes the BAB strategy performance in China and Taiwan over three different time periods. Within each subset, the results show strong evidence in favor of the beta anomaly in both considered indices and a wider difference between low- and high-beta stocks from 2009 to 2016 in SSE 180. This is partly attributable to the fact that institutional investors have become progressively more numerous, better capitalized and more sophisticated (Auer & Schuhmacher, 2015). Thus, it is arguably that more sophisticated institutional investors could enhance the beta anomaly in China market. Also, although it is hard to make strong inference of BAB strategy performance before 2009 due to the low predictive power in SSE 180, it is clear to see the economically significant performance during financial crisis, together with the high Sharpe ratio and abnormal benefit in recent years. On the other hand, Taiwan market reflects different story. The fluctuation of return volatility is less than China, and has higher mean excess return, which lead to very high Sharpe ratio over time. This demonstrate the performance stability of BAB portfolio in Taiwan, even market having drastic change.
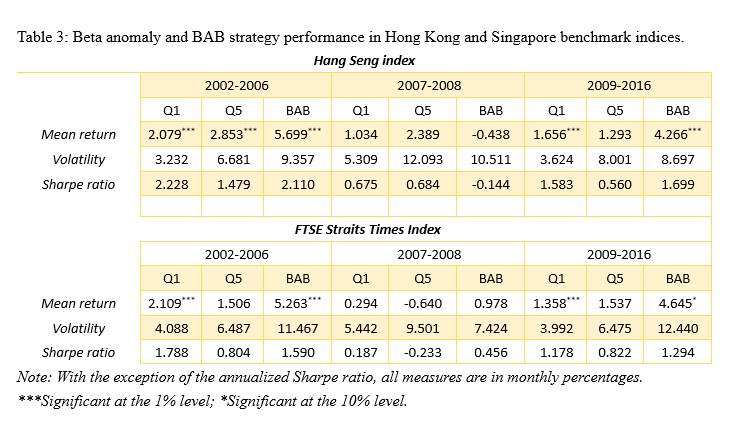
Other high liquid stock markets:In the second robust check, I make an out of sample test in order to examine the consistency of beta anomaly and the profitability of BAB strategy in other Asia benchmark indices. Thus, Hang Seng Index (HSI) in Hong Kong and Strait Time Index (STI) in Singapore are considered, because this two markets has been seen as developed markets in Asia and widely trading in the international markets (Cheung & Mak, 1992). In particular, the time frame of this universe is from January of 2002 to December of 2016. The stocks were selected with at least 120 months of non-missing data to estimate beta and correlation and thus the universe of portfolio includes 47 constituents of HSI and 28 constituents of STI. The method of estimating beta is followed by equation (1). As stated by the Table 3, this universe is examined under different time frames and presented with low beta (Q1), high beta (Q5) and BAB portfolios to test the existence of beta anomaly across time. Consistent with what has found in the previous section, low beta portfolios outperform high beta portfolio in terms of Sharpe ratio over time and the volatility is much higher in all high beta portfolios. The only exception is in the period of financial crisis in Hong Kong, which result in the negative value of excess return and Sharpe ratio. However, since the low predictive power during that period, it is impossible to make strong inference about the performance at that time. In addition, compared with China and Taiwan markets, the developed Asia markets, namely Hong Kong and Singapore equity markets, generally provide better BAB benefits in the last bull market period before financial crisis (2002-2006) and the recovery period
(2009-2016). To sum up, the beta anomaly can be exploited in developed high liquid Asia indices and thus BAB strategy can generate exceptional performance to the investors.
Chapter 4 Conclusion
The CAPM is evolved from the modern portfolio theory and its idea of risk-return tradeoff constitutes the principal of modern Finance and nowadays widely applied by investors around the world. The low risk investing strategy, however, points out that the actual relationship of risk and return is on the opposite direction, and low beta or low risk stocks can provide higher risk-adjusted return than high beta stocks. Several research has fully examined this beta anomaly and construct long-short portfolios to arbitrage this anomaly benefit in the US and international markets (Baker et al. 2011; Frazzini and Pedersen, 2014). However, Li, Sullivan, and Garcia-Feijóo (2014) concern the trading efficacy of beta-related strategies may be limited because of illiquidity barriers and high transaction costs. Therefore, the aim of this study is to address this issue and extend the market sample to the East-Asia markets. In particular, I analyzed whether the beta anomaly can be detected in the highly liquid East-Asia equity markets, SSE180 and TW 50. The investment universe is constituted by stocks whose tradability was not restricted by either liquidity issues or short selling. By also considering transaction costs, I was able to examine whether unconstrained investors can exploit the anomaly.
For the period 2002-2016, this empirical study provided several insights that are interesting from both a scientific and a practical perspective. First, this study proved the existence of beta anomaly in China and Taiwan stock markets. Sharpe ratios, mean excess return and alphas of beta-sorted portfolios almost monotonically decline with rising betas, indicating an inverted risk–return relationship. These results make the anomaly even more astonishing because one would expect the actively traded stocks has been efficiently priced. Second, while China market tend to be more suitable to long in low beta portfolio only, the simply constructed BAB portfolio can significantly generate positive abnormal return and Sharpe ratio before and after considering transaction cost in Taiwan. Additionally, both factor regression results indicate not only that the benefit of beta anomaly cannot be explained by exposure to standard factors, but also that adopting BAB portfolio can create higher risk-adjusted return than low beta portfolios. Thus, in contrast to the findings of recent studies, exploiting the beta anomaly appears to be possible even within a universe of highly liquid stocks in China and Taiwan. Third, this study results are robust under different settings. For example, the BAB portfolio is examined under different time periods in each markets. In China market, the performance of BAB strategy not only improve from the last bull market period until recent years, but also become statistically significant and shows the possibility that more sophisticated institutional investors in the markets can enhance the effect of beta anomaly. In Taiwan market, the BAB strategy not only shows stronger BAB effects, but alsp has persistent performance over time. Furthermore, an out of sample test is performed in Hong Kong and Singapore and found that the beta anomaly also exists and even stronger in the developed East-Asia markets and therefore BAB strategy can be implemented to create high abnormal return.
What is the main contribution of this study? This empirical study, on the one hand, provides scientific and practical insights into the beta anomaly and BAB effects in less discussed East-Asia markets. On the other hand, it point out the increased BAB effects in China market in recent years and the market environment in Taiwan is suitable to implement BAB strategy. Finally, since low risk investing has the unique property of challenging the fundamental risk-return relationship in the market, it is believed that this anomaly will not vanish soon and thus can offer persistent investment benefit.
Reference List
Asness, C., Frazzini, A., Pedersen, L.H., 2012. Leverage aversion and risk parity. Financial Analysts Journal. 68 (1), 47–59.
Asness, Clifford S. 2010. “‘Speculative Leverage: A False Cure for Pension Woes’: A Comment.” Financial Analysts Journal, vol. 66, no. 5 (September/October):14–15.
Auer, B. R., & Schuhmacher, F. (2015). Liquid betting against beta in Dow Jones Industrial Average stocks. Financial Analysts Journal, 71(6), 30-43.
Baker, M., B. Bradley, and J. Wurgler. 2011. “Benchmarks as Limits to Arbitrage: Understanding the Low-Volatility Anomaly.” Financial Analysts Journal, vol. 67, no. 1 (January/February): 40–54.
Baker, M., Bradley, B., & Taliaferro, R. (2014). The low-risk anomaly: A decomposition into micro and macro effects. Financial Analysts Journal, 70(2), 43-58.
Black, F. “Capital Market Equilibrium with Restricted Borrowing”. Journal of Business, Vol. 45. No. 3 (July 1972), pp 444-455.
Black, F., Jensen, M.C., Scholes, M., 1972. The capital asset pricing model: some empirical tests. In: Jensen, M.C. (Ed.), Studies in the Theory of Capital Markets, Praeger, New York, NY, pp. 79–121.
Brennan, M. 1993. “Agency and Asset Pricing.” Working paper, University of California eScholarship (May): http://escholarship.org/uc/item/53k014sd.
Buchner, A., & Wagner, N. (2016). The betting against beta anomaly: Fact or fiction?. Finance Research Letters, 16, pp 283-289.
Carhart, M. 1997. “On Persistence in Mutual Fund Performance.” Journal of Finance, vol. 52, no. 1 (March): 57–82.
Kumar, Alok. 2009. “Who Gambles in the Stock Market?” Journal of Finance, vol. 64, no. 4 (August):1889–1933.
Cornell, Bradford. 2009. “The Pricing of Volatility and Skewness: A New Interpretation.” Journal of Investing, vol. 18, no. 3 (Fall):27–30.
Miller, Edward M. 1977. “Risk, Uncertainty, and Divergence of Opinion.” Journal of Finance, vol. 32, no. 4 (September):1151–1168.
Cheung, Y. L., & Mak, S. C. (1992). The international transmission of stock market fluctuation between the developed markets and the Asian—Pacific markets. Applied Financial Economics, 2(1), 43-47.
Chiao, C., Hung, W., & Yao, C. (2010). The absence of the book‐to‐market effect in the taiwan stock market: a decomposition approach. The Japanese Economic Review, 61(2), 289-299.
Chow, T. M., Hsu, J. C., Kuo, L. L., & Li, F. (2014). A study of low-volatility portfolio construction methods. The Journal of Portfolio Management, 40(4), 89-105.
Chow, T., J. Hsu, L. Kuo, and F. Li. 2014. “A Study of Low-Volatility Portfolio Construction Methods.” Journal of Portfolio Management, vol. 40, no. 4 (Summer): 89–105.
Chui, A. C., & Wei, K. J. (1998). Book-to-market, firm size, and the turn-of-the-year effect: Evidence from Pacific-Basin emerging markets. Pacific-Basin finance journal, 6(3), 275-293.
Fama, E., and K. French. 1993. “Common Risk Factors in the Returns on Stocks and Bonds.” Journal of Financial Economics, vol. 33, no. 1 (February): 3–56.
Fang, Y., Lai, K. K., & Wang, S. Y. (2006). Portfolio rebalancing model with transaction costs based on fuzzy decision theory. European Journal of Operational Research, 175(2), 879-893.
Frazzini, A., and L. Pedersen. 2014. “Betting against Beta.” Journal of Financial Economics, vol. 111, no. 1 (January): 1–25.
Frazzini, A., R. Israel, and T. Moskowitz. 2012. “Trading Costs of Asset Pricing Anomalies.” Fama-Miller Working Paper, Chicago Booth Research Paper 14-05 (5 December).
FTSE Russell (2017). FTSE TWSE Taiwan Index Series. http://www.ftse.com/products/indices/twse-taiwan.
Garcia-Feijóo, L., L. Kochard, R.N. Sullivan, and P. Wang. 2013. “Low-Volatility Cycles: The Influence of Valuation and Momentum on Low-Volatility Portfolios.” Working paper (14 August).
Harvey, C. and Siddique, A. (2000). Conditional skewness in asset pricing tests. Journal of Finance, 55:1263–1295.
Haugen R.A., and A.J. Heins. (1975). “Risk and Rate of Return on Financial Assets: Some Old Wine in New Bottles.” Journal of Financial and Quantitative Analysis
Karceski, J. 2002. “Returns-Chasing Behavior, Mutual Funds, and Beta’s Death.” Journal of Financial and Quantitative Analysis, vol. 37, no. 4 (December): 559–594.
Li, X., and R.N. Sullivan. 2010. “Why Low-Volatility Stocks Outperform: Market Evidence on Systematic Risk versus Mispricing.” Working paper, Boston College and CFA Institute (21 December).
Li, X., R. Sullivan, and L. Garcia-Feijóo. 2014. “The Limits to Arbitrage and the Low-Volatility Anomaly.” Financial Analysts Journal, vol. 70, no. 1 (January/February): 52–63.
Lu, T. H., & Lee, J. D. (2016). Is Abnormally Large Volume a Clue?. International Journal of Economics and Finance, 8(9), 226.
Merton, R. 1980. “On Estimating the Expected Return on the Market: An Explanatory Investigation.” Journal of Financial Economics, vol. 8, no. 4 (December): 323–361.
Pástor, Ľ., & Stambaugh, R. F. (2003). Liquidity risk and expected stock returns. Journal of Political economy, 111(3), 642-685.
Samuelson, Paul. 1998. “Summing Up on Business Cycles: Opening Address.” In Beyond Shocks: What Causes Business Cycles? Edited by Jeffrey C. Fuhrer and Scott Schuh. Boston: Federal Reserve Bank of Boston.
Schneider, P., Wagner, C., & Zechner, J. (2015). Low risk anomalies? Working paper available at SSRN: http://ssrn.com/abstract=2593519 or http://dx.doi.org/10.2139/ssrn.2593519. Accessed 10 Jul 2017.
Shanghai Stock Exchange (2010). SSE 180 Index Introduction. http://english.sse.com.cn/information/indices/list/s/singleIndex/000010/intro/intro.shtml.
Sullivan, Rodney N. 2010. “Speculative Leverage: A False Cure for Pension Woes.” Financial Analysts Journal, vol. 66, no. 3 (May/June):6–8.
Cite This Work
To export a reference to this article please select a referencing stye below:
Related Services
View all


Related Content
All TagsContent relating to: "Investment"
An investment is an asset or item that is acquired in exchange for money or capital with the aim of the asset producing an income and/or appreciating in value so that it may be sold at a future date for a higher price.
Related Articles

DMCA / Removal Request
If you are the original writer of this dissertation and no longer wish to have your work published on the UKDiss.com website then please: