Effect of Lime on Soil Strength
Info: 6509 words (26 pages) Dissertation
Published: 10th Dec 2019
Lime
Lime provides an economical way of soil stabilization. Lime modification describes an increase in strength brought by cation exchange capacity rather than cementing effect brought by pozzolanic reaction (Sherwood, 1993). It is one of the traditional binders which are used in stabilization of fine-grained soils. Various forms of lime such as hydrated high-calcium lime, monohydrated dolomite lime and dolomite quicklime have been successfully used as stabilizing agent for many years. Quick lime (calcium oxide) is delivered in the form of coarse-grained powder. It reacts quickly with water producing hydrated or slaked lime, generating heat and volume change (Equation 3):
| CaO + H 2O →Ca(OH )2 + 65.3kJ / mol | (3) |
Quick lime must be handled with care; it can burn the skin in the presence of moisture it also can cause corrosion of equipment (Kezdi, 1979). The main contribution of lime to the strength of soil is from its ability to create cementation between soil particles. The higher the surface area of the soil, the more effective this process of lime cementation is.
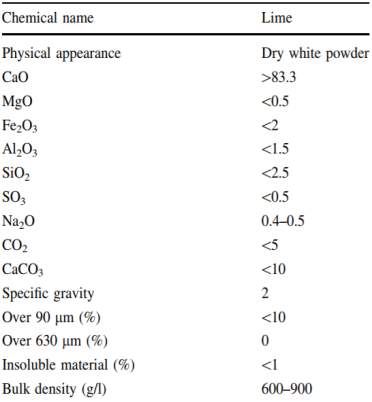
Physical & Chemical Properties of Lime
Stress Strength Behaviour
Lime treatment leads to significant increase in strength. The immediate increase in strength results from flocculation-agglomeration reaction and leads to better workability, whereas long-term strength gain is due to pozzolanic reactions (Thompson, 1966). Figure 9 shows that, as lime content increases unconfined compressive strength increases (Giffen et al., 1978).
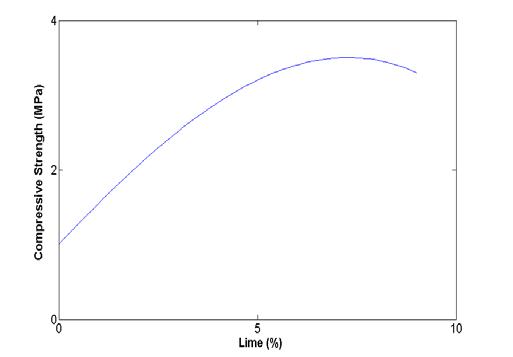
Figure 9: Relationship between unconfined compressive strength and lime content of the treated soils with lime (after Giffen et al., 1978)
- Effect on the Atterberg (Consistency) limits of the soil:
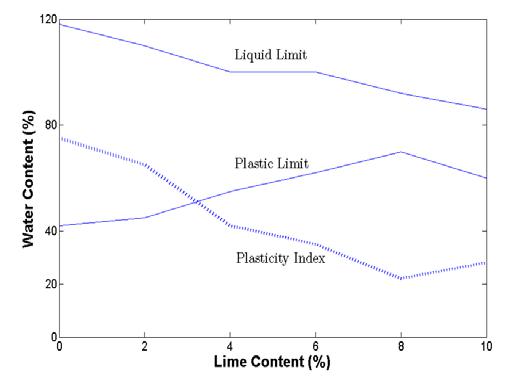 According to Giffen et al., 1978 addition of lime on the soil changes the Atterberg limits of the soils. An increase in lime content decreases the liquid limit and increases the plastic limit and that leads to a significant decrease in plasticity index
Rajbongshi (1997) found an increase in plastic limit and decrease in liquid limit and plasticity index with increasing content of lime.
The liquid limit generally reduces with increasing quantity of lime. In general, plastic limit and liquid limit decreases in the more plastic soils and increases in the less plastic soils (IRC, 1976).
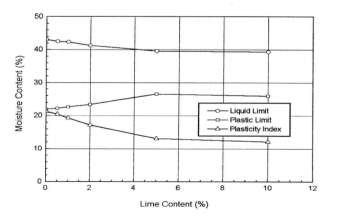
Ahmed (1984) investigated the effect of increasing lime content on the liquid limit, plastic limit and plasticity index of some soils in Bangladesh. Ahmed (1984) found an increase in plastic limit and decrease on liquid limit and the plasticity index with increasing addition of lime. A typical result for a silty clay soil from Ahmed’s (1984) work, showing the above mentioned trend, is presented in the figure below. The shrinkage limit and linear shrinkage of a clayey soil are also affected by addition of lime. The shrinkage limit increases while linear shrinkage reduces as the lime content increases (IRC, 1976).
According to Hilt and Davidson, 1960; Mateos, 1964 the plastic limit of a soil generally increases with the gradual addition of lime until critical lime content. Pietsch and Davidson (1965), describes the amount of lime at the critical point is called lime fixation point. Mateos (1964) observed that there was no further increase in plastic limit beyond the optimum lime content. Lime reduces the liquid limit of highly plastic clays and increases that of low plastic clays (Herrin and Mitchel, 1961; Brandl, 1981). Addition of lime on the soil decreases the plasticity index of soil. The amount of reduction in plasticity index depends on the quantity and type of lime and also type of soil (IRe, 1976)
- Effect on the Unconfined Compressive Strength of the soils
The unconfined compressive strength of soil-lime mix increases with increasing lime content to a certain level, usually about 8 per cent for clay soils (Ingles and Metcalf, 1972). The rate of increase then diminishes until no further strength gain occurs with increasing lime content. The effect of lime content on compressive strength of fine grained soils is shown in Fig. 2.20.
 The rate of gain of compressive strength of soil-lime mix in the initial stages (first few days) is considerably less than with cement stabilised materials. Lime stabilised materials will continue to gain strength with time provided curing is sustained. The rate of strength gain is temperature sensitive and there is some evidence that the physical form of the cementitious products is sensitive to curing temperatures (Ingles and Metcalf, 1972; Bell, 1993). The effect of curing temperature and time on unconfined
- Effect on the Compaction Characteristics of the soils
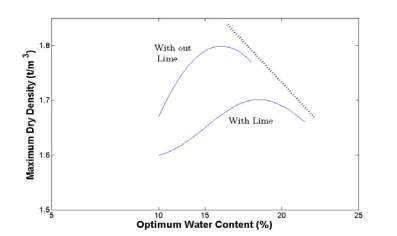
Several changes occur when lime is added to the soil. Addition of lime increases optimum water content but decreases maximum dry density (Figure 11).
Figure 11: Change in compaction curve of a lime treated soil (after Giffen et al., 1978)
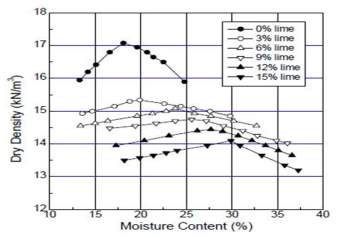
Moisture-density relations of untreated and lime treated samples of the soil are shown in Figure 1. From the relations presented in Figure1, the maximum dry density (γdmax) and optimum moisture content (wopt) of samples of the soil have been determined which are presented in Table 3. It can be seen from Table 3 that with the increase in lime content values of γdmax decreased while the values of wopt increased. It was found that compared with the untreated sample, the values of γdmax decreased by 10% to 17% for an increase in lime content from 3% to 15%. The values of wopt have been found to increase by 10% to 65% due to stabilisation with 3% to 15% lime.
Ahmed (1984) found that for sandy silt and silty clay soils of Bangladesh, the maximum dry density reduced with the increase in lime content. Serajuddin and Azmal (1991) also found that compared with untreated samples the maximum dry density of lime treated samples of two fine-grained regional soils decreased while optimum moisture content slightly increased. For a Chittagong coastal soil, Rajbongshi (1997) reported an increase in wopt and a reduction in γdmax. Molla (1997) also found an increase in wopt and a reduction in γdmax for three regional soils (liquid limit = 34 to 47, plasticity index = 9 to 26) of Bangladesh stabilised with lime
Optimum Lime Content
The required amount of lime to be added to the soil depends on the application. For modification purposes 2% to 3% lime by dry weight of soil is sufficient (Maher et al. 2005). For stabilization purposes, normally 5% to 10% lime by dry weight of the soil is suitable. To determine the optimum lime content for soil stabilization several methods have been suggested. Hilt and Davidson (1960) suggest the following equation for the optimum lime content:
| Optimum Lime Content by Weight= | % of clay by weight | + 1.25 | |
| 35 | |||
- Effect on California Bearing Ratio (CBR)
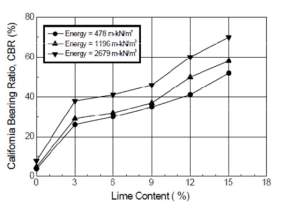
(Siddique and Hossain, 2011) performed CBR tests on a compacted soil samples using three levels of compaction energies i.e. low, medium and high compaction energy. It can be seen that CBR-values of the stabilised samples at all levels of compaction increased considerably. It can be seen that at all levels of compaction, CBR increases rapidly with increasing content of lime. It has been found that, CBR-values of treated samples increased by 4.75 to 8.75 times due to increase in lime content from 3% to 15% compared to the untreated sample.
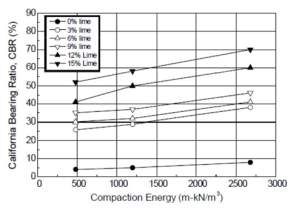
Molla (1997) and Rajbongshi (1997) also investigated the effect of lime on CBR-values of the soils from regional and coastal areas of Bangladesh. They found that CBR value of stabilised samples increased with increasing content of lime. Rajbongshi (1997) also reported that at any particular lime content, CBR will increase with the increase in compaction energy.
Fly ash
Nature of Fly ash and its production
Fly ash is a by-product produced from the combustion of coal in an electrical generation station. Fly ash is a natural pozzolan, which means that it is a “siliceous or siliceous-and-aluminous material” which chemically reacts with calcium hydroxide (CH) to form composites having cementitious properties. According to Bremseth (2010) the procedure of production of fly ash is as follow; firstly, coal is crushed into fine powder in grinding mills. The fine powder is then transferred into a boiler. In the boiler the coal combusts producing heat with a temperature up to 1500 degrees. At this temperature, non-combustible minerals melt in the furnace and fuse together. These minerals are taken away from the burning region by exhaust or flue gases. After a while these minerals are cooled and form spherical glassy particles which are known as ‘fly ash’. The fly ash particles are then collected by mechanical and electrostatic precipitators from the exhaust gases. The picture below explains the process of producing fly ash at a power station.
Physical and Chemical Properties of fly ash
The chemical compositions and the physical properties of fly ash are mainly controlled by the nature of coal and the processing conditions of the furnace.
The chemical composition of fly ash varies significantly between plants. However, Silicon dioxide (SiO2) occupies most of the volume of fly ash. According to (Bremseth, 2010) the chemical composition of the coal controls the chemical contents of fly ash, American Society for Testing and Materials (ASTM) C618-03 defines two classes of fly ash, class F and class C. These two classes differ from each other in the volume of calcium. The percentage of calcium in class F is low whereas in class C is high. According to (de Brito & Saikia, 2013) larger number of unwanted chemical components such as free lime and sulphite are present in high calcium fly ash, which minimise the use of this kind of fly ash. The table below shows the chemical properties of fly ash (Gamage et al, 2011).
Chemical Properties of Fly ash
| Name of the chemical | % by weight |
| Silica (SiO2) | 64.08 |
| Alumina (Al2O3) | 20.21 |
| Ferric Oxide (Fe2O3 + Fe3O4) | 4.17 |
| Titanium Dioxide (TiO2) | 0.42 |
| Calcium Oxide (CaO) | 6.20 |
| Magnesium Oxide (MgO) | 0.91 |
| Sulfate (SO4) | 1.24 |
| Loss on Ignition (LOI) | 1.07 |
Physical Properties of Fly ash
| Properties | Quantity | |||
| Specific gravity | 2.3 | |||
| Moisture content | 19.75% | |||
| Fineness | 0.001-0.6 mm | |||
| Maximum Dry density | 1.53 g/cm3 | |||
| Permeability | 4.87×10⁻⁷ cm/s | |||
| Angle of internal friction | 23°-41° | |||
| Cohesion | 3-34 Kpa | |||
- Effect on the Compaction characteristics of the soils:
(Mahajan and Parbat, 2015) performed the laboratory experiment on the black cotton soils(i.e. expansive soil). The conclusion of the experiment shows the addition of fly ash brought an improvement in the compaction parameters of the soils by increasing the maximum dry density and decreasing the optimum moisture content.
The Standard Proctor test was conducted by (Vukićević et al., 2015) on the fine grained soil. The experimental result shows that the maximum dry density decreases and optimum moisture content increases with the increase in the content of fly ash. The decrease in maximum dry density is associated with the fact that used fly ash has lower specific gravity than the soil (γd, max=9.85kN/m³, Wopt=37.6%).
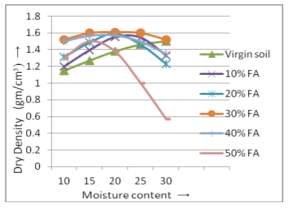
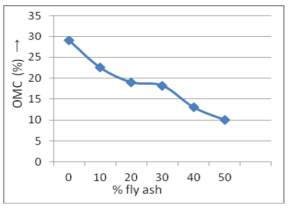
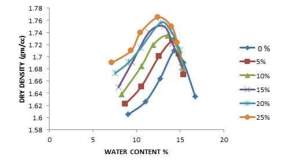
(Santos et al., 2011) performed an experimental test on the soil for the construction of the highway embankments. The soil has the maximum dry unit weight at the minimum optimum water content. The fly ash-soil mixtures exhibit the decrease in the maximum dry density with the increasing optimum water content. The graph given below shows the decrease in maximum dry density and increase in optimum water content with the variation in the amount of fly ash. The decrease in maximum dry unit weight with the increase in the content of fly ash is associated with the fact that fly ash is lightweight compared to soil only.
- Effect on the Atterberg (Consistency) limit of the soils:
(Bhuvaneshwari et al., 2005) carried out the consistency limit tests on the expansive soils which show the decrease in Liquid limit and plasticity index of the soils, however there was increase in the plastic limit of the soils. Moreover fly ash cannot be applicable on the soils when it exceeds 40% in volume. The experiment was conducted by increasing the percentage of the fly ash. The results of the experiments conducted by the researchers is given below
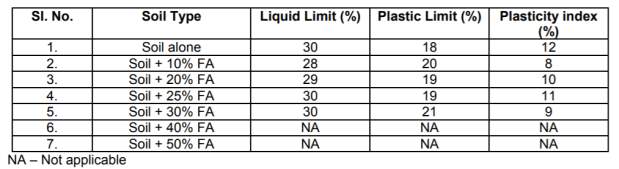
(Phani Kumar and Sharma, 2004) summarizes the effect of fly ash on the Atterberg limits of the expansive soil i.e. liquid limit, plastic limit and plasticity index. The liquid limit decreases and the plastic limit increases with an increase in fly ash content. The plasticity index is reduced by 50% when the fly ash content is 20%. The results of the experiments is given below on the table
| Fly ash content | ||||||||
| Property | 0 | 5 | 10 | 15 | 20 | |||
| Liquid limit (%) | 80 | 77 | 75 | 73 | 70 | |||
| Plastic limit (%) | 28 | 31 | 35 | 40 | 44 | |||
| Free swell index | 250 | 200 | 165 | 140 | 125 | |||
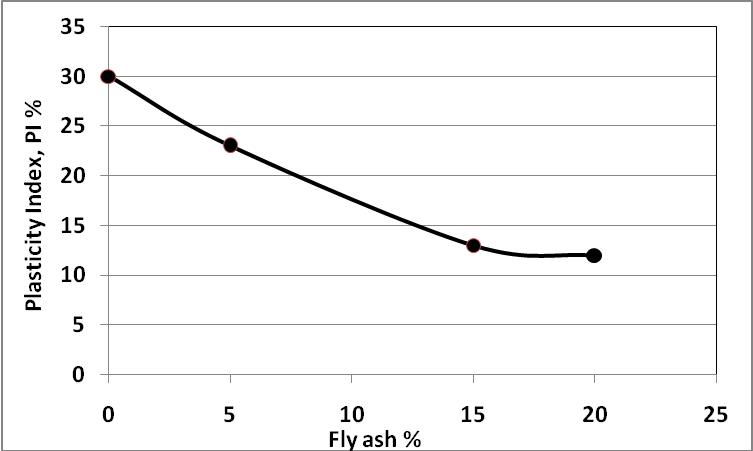
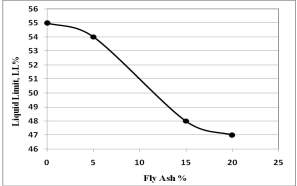 The laboratory experiment conducted by (Ahmed, 2014) shows that the addition of fly ash reduces the plasticity characteristics of the soil. Moreover the liquid limit decreases and plastic limit increases with an increase in the content of fly ash. The analysis shows that increasing ash content from zero to 20% decreases the liquid limit and plasticity index, increases the plastic limit which is illustrated in the graph below
- Effect on the Unconfined Compressive Strength of the soils:
The research conducted by (Bhuvaneshwari et al., 2005) also shows the increase in the compressive strength of the soil mixed with fly ash. The results show that the maximum strength was attained at the 10% addition of fly ash on the mixture of natural soil. The table below shows the verification of the research.
| Description | Soil | Soil | Soil | Soil | Soil | |
| +10%flyash | +20%flyash | +40%flyash | +50%flyash | |||
| Unconfined | ||||||
| compressive | 2697 | 3533 | 2850 | 2160 | 1176 | |
| strength (kN/m2) |
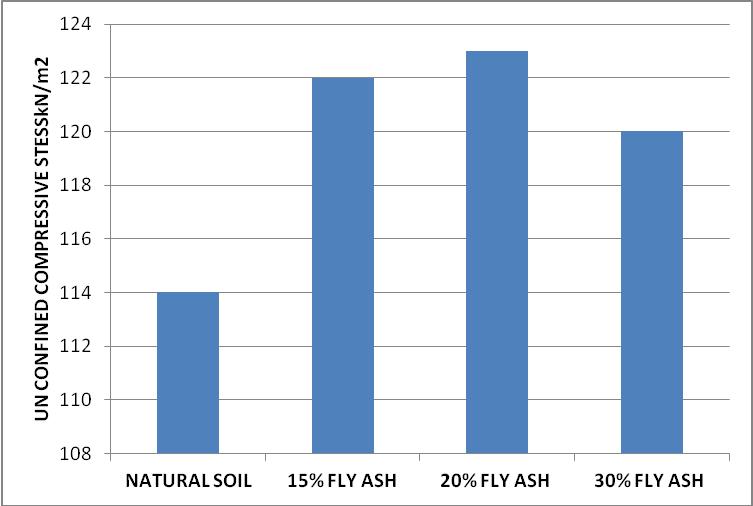
The researcher (Somaiya et al.) did an experiment on the expansive soil by adding certain amounts of fly ash. The results were compared with the soil without the addition of binders. The unconfined compressive stress of natural soil without fly ash which was 114kN/m2 increased to 123 kN/m2 when the fly ash was added to the soil. It shows maximum compressive stress at the addition of 20% fly ash in natural soil showing 7.89 % improvement. The bar graphs given below demonstrate the results obtained from the experimental setup.
- Effect on California Bearing Ratio (CBR)
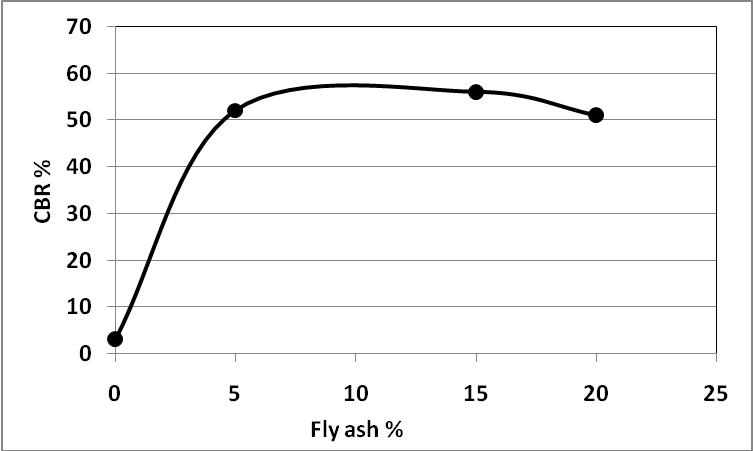 The laboratory test conducted by (Ahmed, 2014) shows that the California Bearing Ratio (CBR) value increased considerably with the increase in the content of fly ash in the mixture of soil. The value of CBR started to decrease when soil contains the fly ash of more than 15%. The experimental result is shown in the graph below which illustrates the above mentioned statement.
Similarly the experimental results obtained from the laboratory works conducted by (Okunade, 2010) shows that the unsoaked CBR of the different soils increases with increasing content of fly ash. It increases from an average of about 20.0% to an average of about 53.3% when comparing the values at 0% and 12.5% contents of fly ash.
Blast furnace slag
Blast furnace slag is a non-metallic co-product produced in the blast furnace with molten iron from iron ore in the reducing presence of heated air, coke and limestone. It consists of silicates, aluminosilicates, and calcium-alumina-silicates. The figure given below represents a general schematic of blast furnace feed stocks and the production of blast furnace co products i.e. iron and slag.(Chesner et al., 1998)
The products of blast furnace slag includes air-cooled blast furnace slag (ACBFS), expanded or foamed blast furnace slag, pelletized blast furnace slag, and granulated blast furnace slag.
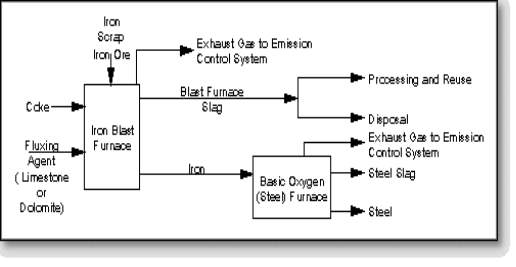
Fig: General schematic of blast furnace operation and blast furnace slag production.
Air-Cooled Blast Furnace Slag
A crystalline structure of hard and lump slag is produced when the liquid slag is poured into beds and cooled slowly under ambient conditions, which can subsequently be crushed and screened.
Expanded or Foamed Blast Furnace Slag
Expanded or Foamed Blast Furnace Slag is produced when molten slag is cooled and solidified by adding controlled quantities of water, air, or steam. It is distinguishable from air-cooled blast furnace slag by its relatively high porosity and low bulk density.
Pelletized Blast Furnace Slag
Pelletized Blast Furnace Slag is produced when molten slag is cooled and solidified with water and air quenched in a spinning drum. The process helps in the formation of pellets, rather than a solid mass. The products are beneficial for aggregate use and are more desirable in cementitious applications.
Granulated Blast Furnace Slag
If the molten slag is cooled and solidified by rapid water quenching to a glassy state, little or no crystallization occurs which results in the formation of sand size (or frit-like) fragments, usually with some friable clinker like material known as granulated blast furnace slag. The physical structure and gradation of granulated slag depends upon the chemical composition of the slag, temperature at the time of water quenching, and the method of production. It has cementitious properties when crushed to very fine cement-sized particles, which makes it a suitable partial replacement for or additive to Portland cement.
Physical Properties
Property |
Slag Type and Value |
||
Air-Cooled |
Expanded |
Pelletized |
|
Specific Gravity |
2.0 – 2.5 |
— |
— |
Compacted Unit Weight,
|
1120 – 1360
|
(800 – 1040)
|
840
|
Absorption (%) |
1 – 6 |
— |
— |
The table below shows the physical properties of air-cooled, expanded, and pelletized blast furnace slag.
Air-Cooled Blast Furnace Slag (ACBFS)
It is angular, roughly cubical, and has textures ranging from rough, vesicular i.e. porous surfaces to glassy i.e. smooth surfaces with conchoidal fractures. There is considerable variability in the physical properties of blast furnace slag, depending upon the production process. Some recently produced ACBFS was reported to have a compacted unit weight as high as 1940 kg/m³ (120 lb/ft³). Higher unit weights are generally due to increased metals and iron content in the slag and tend to occur in slag that are generated from blast furnaces with higher scrap metal additions. The water absorption of ACBFS can be as high as 6 percent. Although ACBFS can exhibit these high absorption values, ACBFS can be readily dried since little water actually enters the pores of the slag and most is held in the shallow pits on the surface.
Expanded Blast Furnace Slag
It is angular, roughly cubical in shape, and has a texture that is rougher than that of air-cooled blast furnace slag. The porosity of expanded blast furnace slag aggregates is higher than that of the ACBFS aggregates. The bulk relative density of expanded slag is difficult to determine accurately, but it is approximately 70 percent of that of air-cooled slag. The compacted unit weights of expanded blast furnace slag aggregates ranges from 800 kg/m3 (50 lb/ft3) to 1040 kg/m3 (65 lb/ft3) as per the data provided by the National Slag Association.
Pelletized Blast Furnace Slag
It has a smooth texture and rounde shape. The porosity and water absorption are much lower than those of ACBFS and expanded blast furnace slag. Pellet sizes range from 13 mm (1/2 in) to 0.1 mm (No. 140 sieve size), with the bulk of the product in the minus 9.5 mm (3/8 in) to plus 1.0 mm (No. 18 sieve size) range. Pelletized blast furnace slag has a unit weight of 840 kg/m3 (52 lb/ft3).
Granulated Blast Furnace Slag (GBFS)
It is a glassy granular material that varies depending on the chemical composition and method of production, from coarse, popcorn like friable structure greater than 4.75 mm (No. 4 sieve) in diameter to dense, sand-size grains passing a 4.75 mm (No. 4) sieve. Grinding reduces the particle size to cement fineness, allowing its use as a supplementary cementitious material in Portland cement concrete.
Chemical Composition
The chemical composition of the blast furnace slag is given in the table below. The chemical compositions shown are in general applicable to all types of slag.
| Constituent |
Composition |
|
| Mean (%) | Range (%) | |
| Calcium Oxide (CaO) | 39 | 34-43 |
| Silicon Dioxide (SiO2) | 36 | 27-38 |
| Aluminium Oxide (Al2O3) | 10 | 7-12 |
| Magnesium Oxide (MgO) | 12 | 7-15 |
| Iron (FeO or Fe2O3) |
0.5 | 0.2-1.6 |
| Manganese Oxide (MnO) |
0.44 | 0.15-0.76 |
| Sulphur (S) |
1.4 | 1.0-1.9 |
Effect on the Compaction characteristics of the soils
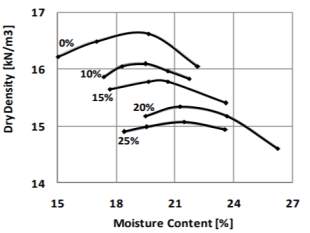
Standard Proctor tests were used to establish the dry density and moisture content relationship of soil with various amounts of GBFS. The effect of GBFS on optimum moisture content and maximum dry density the test of soil with 0 % to 25% by dry weight of soil is given in the table below.
(Pathak et al., 2014) concluded from the experiment that with the increases of GBFS percentage optimum moisture content goes on decreasing while maximum dry density goes on increasing. This phenomenon helps hence compactness of soil increases and making the soil more dense and hard.
| GGBS (%) | O M C (%) | Dry Density (gm/cc) |
| 0 | 14.33 | 1.710 |
| 5 | 14.13 | 1.726 |
| 10 | 13.54 | 1.735 |
| 15 | 13.15 | 1.750 |
| 20 | 12.75 | 1.756 |
| 25 | 12.46 | 1.765 |
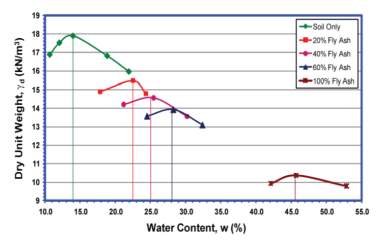
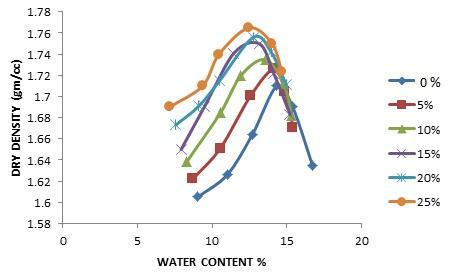
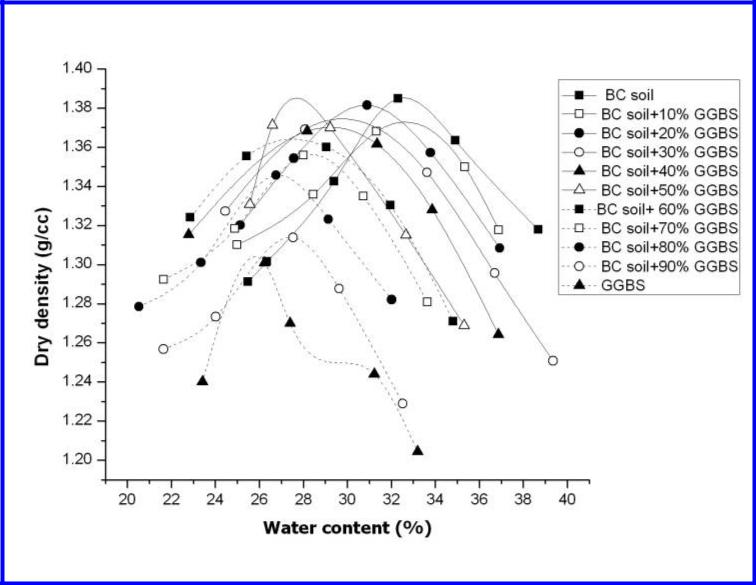 (Kumar Sharma and Sivapullaiah, 2012) computed the results of the compaction test which is shown in the figure given below for all the combinations of the soil and GBFS mixtures. Both optimum moisture content and maximum dry density decreased with the addition of GGBS to the BC soil. This is due to predominant effects of reduced clay content and increased frictional resisting respectively.
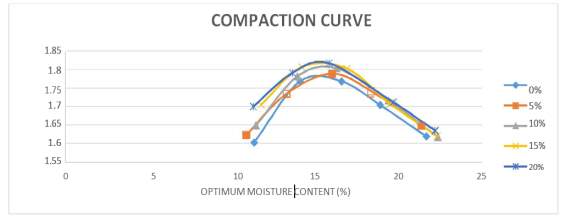
(Rajalaxmi, 2015) performed a laboratory experiment on the Red soil by using the Blast Furnace Slag. For this test, red soil was thoroughly mixed with suitable amount of water and varying amount of BFS which then was compacted in proctor mould in three layers. Percentage of BFS (0%, 5%, 10%, 15% and 20%) and the corresponding optimum moisture content (OMC) and maximum dry density (MDD) were determined from the laboratory experiment. The Maximum Dry Density (MDD) and Optimum Moisture Content (OMC) were increased by 2.3% and 33% respectively which is plotted in the graph and shown in the table below.
| Blast furnace slag (%) | Moisture | Dry density g/cc |
| Content (%) | ||
| 0 | 15 | 1.775 |
| 5 | 16 | 1.779 |
| 10 | 17 | 1.8 |
| 15 | 18 | 1.802 |
| 20 | 19 | 1.812 |
- Effect on the Atterberg (Consistency) limit of the soils:
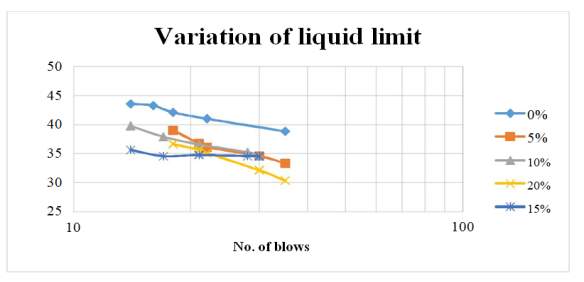
The laboratory experiment conducted by (Rajalaxmi, 2015) concluded the decrease in the liquid limit of the soil . The liquid limit decreases with the increasing content of the blast furnace slag. The plasticity index also decreases with the addition of the BFS. The table and the chart mentioned below shows the results of the experiments on the addition of the BFS on the natural Red soil.
| Red Soil+ GBFS | Plastic Limit(PL)% | Liquid limit (LL)% | Plasticity index (PI)% |
| Natural Red Soil | 20.15 | 41 | 19.85 |
| Natural Red Soil+ 5% BFS | 19.77 | 36.10 | 16.33 |
| Natural Red Soil+ 10% BFS | 16.41 | 35.30 | 18.89 |
| Natural Red Soil+ 15% BFS | 16.05 | 32.02 | 15.96 |
| Natural Red Soil+ 20% BFS | 15.67 | 30.3 | 14.37 |
According to (Pathak et al., 2014) liquid limit and plastic limit decreases with the increases in the percentage of GGBS which makes the soil less plastic and hence plasticity index reduces.
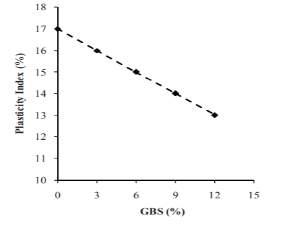
(Yadu and Tripathi, 2013) performed the laboratory experiment on the lab to determine the consistency limits of the soil blended with certain amount of GBFS. The liquid limit and plastic limit both decreases with the increasing content of the GBFS on the soil. The given graph below shows the decreasing plasticity index of the soil with increasing GBFS.
- Effect on the Unconfined Compressive Strength of the soils:
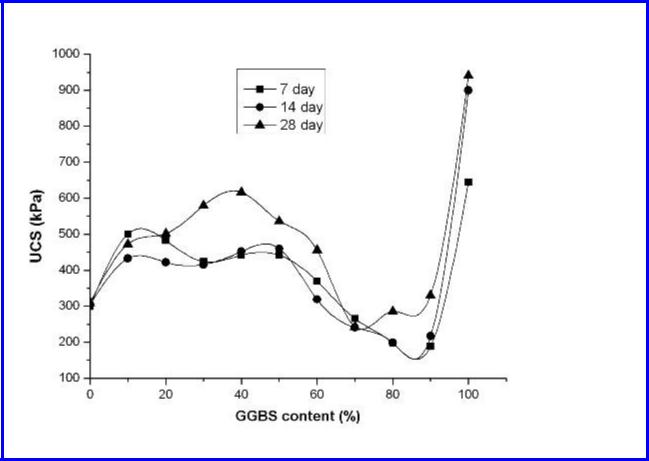
According to (Kumar Sharma and Sivapullaiah, 2012) the unconfined compressive strength of Black cotton soil increases with the addition of Granulated Blast Furnace Slag(GBFS) up to 10% and remains constant up about 40% and thereafter decreases with further increase in GBFS content.
The results show that the strength increases with addition of small amount of the GGBS content but decreases on further additions. The strength increased with the addition of GGBS up to 20% for the curing periods of 7 and 14 days, and up to 40% for the curing period of 28 days. Further addition of GGBS decreases the strength of soil-GGBS mixture.
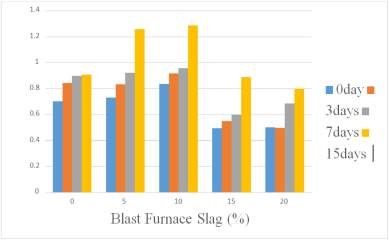
A laboratory experiment was conducted by (Rajalaxmi, 2015) for unconfined compression tests of red soil with blast furnace slag percentages of 0, 5, 10, 15, and 20% . Curing period of 0, 3, 7, and 15 days were adopted to test the samples.
The results of the laboratory experiment shows that the UCS value is maximum with addition of 10% of blast furnace slag, afterwards the UCS value decreases with further addition of blast furnace slag. The UCS value increases with curing period.
- Effect on California Bearing Ratio (CBR):
(Pathak et al., 2014) performed the CBR test on a compacted soil in a mould of 150mm in diameter and 175mm in height. CBR values were determined for soaked and unsoaked samples. The soaked sample specimen were kept submerged in water for about 4 days before testing. The load readings were recorded at penetration of 0, 0.5, 1.0, 1.5, 2.0, 2.5, 3.0, 4.0, 5.0, 7.5, 10.0, and 12.5mm. The CBR values are generally calculated for penetration of 2.5mm and 5.0mm. The CBR value at 2.5mm penetration is to be taken as the CBR value for design purpose.
CBR value for soaked and unsoaked soil samples increases with increases in the percentage of GGBS that show the densification of soil takes place and is more suitable for pavement thickness.
| GGBS (%) | CBR IN (%) AT | CBR IN (%) AT |
| 2.5 (mm) | 5 (mm) | |
| PENETRATION | PENETRATION | |
| 0 | 2.84 | 2.69 |
| 5 | 3.13 | 2.94 |
| 10 | 3.44 | 3.21 |
| 15 | 3.77 | 3.50 |
| 20 | 4.06 | 3.88 |
| 25 | 4.41 | 4.28 |

(Yadu and Tripathi, 2013) performed soaked and unsoaked CBR test on the soft soil as well as blended materials with various percentage of GBFS. The soaked CBR test were conducted on samples compacted at OMC after soaking it for 96 hours. The results of the addition of the GBFS show the increase in the CBR value up to a certain point. The CBR values for unsoaked sample rises rapidly from 3 to 6% and decreases continously up to 12%. The increment of the CBR values for soaked sample was similar but up to 9 % and start decreasing beyond 12%.
The increment in CBR is due to the gradual formation of the cementious compounds between the GBFS and CaOH contained in the soil and the decrease is due to the excess GBFS which was not used in the chemical reaction. The figure given below shows the trend of the CBR values for the soaked and aunsoaked samples on the addition of the GBFS in percentage.
Cite This Work
To export a reference to this article please select a referencing stye below:
Related Services
View all


Related Content
All TagsContent relating to: "Geology"
Geology is an “Earth science” or “geoscience” concerned with the study of the physical structure of the Earth (or other planetary body) and the rocks of which it is made, the processes that shaped it and its physical, chemical and biological changes over time.
Related Articles

DMCA / Removal Request
If you are the original writer of this dissertation and no longer wish to have your work published on the UKDiss.com website then please: