Incomplete Hippocampal Inversion (IHI) Role in Alzheimer’s Disease
Info: 7813 words (31 pages) Dissertation
Published: 9th Dec 2019
Tagged: NeurologyAlzheimers
Introduction
An estimated 850,000 people in the UK suffer with dementia, including 40,000 under the age of 65. Of these, 62% are diagnosed with Alzheimer’s disease (AD), the most common form of dementia (Alzheimer’s Society, 2017). Investigating AD is coupled with a desire to better understand the role of the hippocampus. A contentious phenomenon within neuroradiology is an observation made regarding the morphology of the hippocampus. Incomplete Hippocampal Inversion (IHI), also known as hippocampal malrotation, (HIMAL), is a developmental anomaly in brain anatomy associated with an increased risk of neuropsychiatric disorders; identified and graded using magnetic resonance (MR) imaging (MRI). It is theorised that IHI may play a role in AD as a risk or prognostic factor. This study will use MRI to examine the putative role of IHI in AD; and evaluate the potential uses of IHI as a diagnostic and prognostic marker.
Alzheimer’s Disease
AD is progressive in nature in terms of both cognitive decline and underlying pathology (Dubois et al., 2010). It is now accepted that AD is characterised by a pre-clinical stage, in which patients are asymptomatic in terms of cognition, but develop pathological hallmarks such as neuronal loss, tangles and/or plaques (Sperling et al., 2011). This is followed by the pre-dementia or prodromal stage, where symptoms of cognitive decline are detectable but do not yet meet the criteria for AD. Usually, this stage is characterised by memory complaints, along with isolated memory impairment, which can be quantified by neuropsychological testing (Dubois et al., 2014). Some AD studies have also used patients with mild cognitive impairment (MCI), which is thoughtto be a precursor to AD (Ray et al., 2015). However, MCI can also arise as a result of a range of neurological or psychiatric aetiologies: and therefore, cannot be considered to be definitive in the diagnosis of AD (Koen & Yonelinas, 2014).
There is much interest in the identification and characterisation of anatomical abnormalities in the brain, observable using diagnostic imaging, and that may play an important role in early AD diagnoses. While the hippocampus has often been implicated as a major target of AD (Lace et al., 2009), neuroimaging studies have revealed that AD may affect hippocampal subfields unevenly (see de Flores, Joie & Chételat, 2015 for review). This led to various hippocampal segmentation protocols being developed; allowing for the identification of several subfields (Wood et al., 2015). In the context of assessing hippocampal abnormalities, such anatomic landmarks could be clinically helpful to distinguish hippocampal subfield boundaries.
In the absence of a clear clinical significance, Bernasconi et al. (2005) pointed out the need to establish the functional significance—if any—of HIMA L in relation to cognition, and more specifically in relation to memory. Involvement of the hippocampal format ion in cognitive abilities, particularly in memory and learning, has been the topic of extensive research (for review in humans, see Spiers et al., 2001). More specifically, in human and nonhum an primates, neuropsychological evidence has indicated a crucial role for the hippocampus in episodic memory (Squire, 1992; Vargha-Khadem et al., 1997).
In the absence of a clear clinical significance, Bernasconi et al. (2005) pointed out the need to establish the functional significance—if any—of HIMA L in relation to cognition, and more specifically in relation to memory. Involvement of the hippocampal format ion in cognitive abilities, particularly in memory and learning, has been the topic of extensive research (for review in humans, see Spiers et al., 2001). More specifically, in human and nonhum an primates, neuropsychological evidence has indicated a crucial role for the hippocampus in episodic memory (Squire, 1992; Vargha-Khadem et al., 1997).
Incomplete Hippocampal Inversion
Since inversion of the hippocampal formation is one of the gyration process in normal brain development, it is not surprising that IHI has been implicated in several neuropsychiatric disorders. In this setting, the hippocampus is round, vertical and medially positioned with a deep and vertically-oriented collateral sulcus (CS) (Bernasconi, Kinay, Andermann, Antel & Bernasconi, 2005). While MRI is highly effective in evaluating the hippocampus to assess a range of pathologies including; inflammatory, congenital, vascular, degenerative, toxic-metabolic and cancerous (Dekeyzer et al. 2017), it has also been used to study hippocampus morphology (Duvernoy, 2005). This makes MRI a powerful tool for the detection and assessment of IHI, particularly as Cury and colleagues (2015) have developed a systematic approach for the grading of IHI based on MRI findings, as discussed in a later section.
Because inversion of the hippo-
campal formation is one of the expressions of the normal
gyration process, it is not surprising that incomplete
inversion of the hippocampus (Baker & Barkovich, 1992;
Bajic et al., 2009), often referred to as hippocampal malro-
tation, or HIMAL (Barsi et al., 2000; Fitoz et al., 2003;
Gamss et al., 2009), occurs rather frequently in association
with developmental brain disorders. However, malrotation
and incomplete folding of the hippocampus (HIMAL) with-
out widespread cortical changes has also been described in
the context of partial epilepsy. Baulac et al. (1998) observed
isolated HIMAL in 13 of 19 patients with partial epilepsy
and magnetic resonance imaging (MRI) evidence of hippo-
campal formation abnormality.
Because inversion of the hippo-
campal formation is one of the expressions of the normal
gyration process, it is not surprising that incomplete
inversion of the hippocampus (Baker & Barkovich, 1992;
Bajic et al., 2009), often referred to as hippocampal malro-
tation, or HIM
IHI has been investigated in a range of neuropsychiatric conditions such as autistic spectrum disorder (Campbell et al., 2006); febrile seizures (Chan et al., 2015); schizophrenia (Baker et al., 2011); and Major Depressive Disorder (MDD) (Colle et al., 2016). It has most prominently been described in epilepsy; particularly in those with malformations of cortical development and in temporal lobe epilepsy, with an estimated prevalence of 30-50% (Raininko & Bajic, 2010; Bernasconi et al. 2005). However, clinical studies revealed the correlation between IHI and epilepsy is, at best, ambiguous. A systematic review of MRI findings in patients with epilepsy indicated that there was no statistically significant correlation between MRI findings of IHI and clinical indications of epilepsy (Rajabi, 2015).
Similarly, the prevalence of IHI did not significantly differ between patients with MDD and healthy controls. Instead, interactions between left hippocampal volume and IHI have a significant effect on the predictive value of hippocampal volume in response to antidepressant therapy (Colle et al., 2016). However, this study relied on automatic segmentation, which Kim and colleagues (2012a) previously challenged; positing that automatic hippocampal segmentation accuracy is affected by IHI assessment.
Moreover, IHI is not specific for epilepsy or depression, and has been reported in healthy subjects, although the frequency of IHI drops compared to those with epilepsy (Bajic, et al., 2008). Bernasconi and colleagues (2005) suggest that IHI may be one end of the phenotypic spectrum of hippocampal shape. Studies in neonates have indicated that IHI is developmental in origin (Raininko & Bajic, 2010) leading to speculation that IHI may be a marker for atypical brain development.
In the absence of clinical significance, Bernasconi et al. (2005) further emphasised the need to establish the functional significance, if any, of IHI in relation to cognitive functioning. For example, Stiers and colleagues (2010) tested the cognitive consequences in a matched-control study of children with epilepsy and found that IHI had no direct repercussions on memory recall; rather, it was secondary to subtler widespread, morphological changes in the pre-frontal cortex. In the context of AD, a decline in memory; specifically, verbal memory is often considered a first indicator of AD or MCI (Brooks & Loewenstein, 2010). If IHI is more than just an anatomical variation, it would be interesting to determine whether a link between IHI and clinical phenotypes of AD exists, such as verbal memory impairment.
Nevertheless, if IHI is to be effectively studied as a marker in neuropsychiatric diseases such as AD, it is important that IHI in the healthy population is also sufficiently studied to ensure accuracy and eliminate bias in volumetric studies or morphometry (Cury et al., 2015). Prior to the work of Cury and colleagues (2015), characterisation of IHI in healthy subjects was inadequate. This was due in part to debate regarding prevalence of IHI in healthy subjects (Bajic, et al., 2008; Raininko & Bajic, 2010). In addition, studies of IHI have included only small numbers of healthy subjects, leading to a lack of precision (Bernasconi et al., 2005).
Characterisation of IHI
Cury, et al. (2015) studied and characterised IHI in a large, healthy population of 2008 subjects. Taken from the IMAGEN database (Schumann et al., 2010), they were assessed for the presence of IHI on 3D T1-weighted MR images. Cury and colleagues (2015) developed a visual scale comprising five criteria. Criterion 1 assesses the roundness and verticality of the hippocampal body. C2 assesses the verticality and depth of the CS, while C3 assesses the medial positioning of the hippocampus. C4 assesses the thickness of the subiculum, and C5 assesses the sulci of the fusiform gyrus. These individual scores are combined into an overall score, C0, giving a global assessment of the presence of IHI. The scoring system developed by Cury, et al. (2015) was found to have good inter-observer reproducibility for all criteria except C4 in which all selected subjects had a C4 score of 0. Due to its ease of implementation and high inter-observer reliability, the method of Cury, et al. (2015) will be employed in this study.
Rationale for study
Among numerous studies regarding IHI and pathologies, to our knowledge, our study will be the first to document whether IHI is present in patients with AD and MCI and compare this with neurologically healthy age-matched controls. Such evaluation would be useful in both early diagnoses and potential prognoses of AD. Our protocol for assessing the prevalence and characteristics of IHI partially adopts Curry et al.’s (2015) visual scale and is further detailed in the method section.
The aims of this study are threefold: 1) to assess IHI prevalence and characteristics in AD and MCI against healthy controls; 2) to determine whether IHI is related with hippocampal body volumes; and 3) to explore whether a relationship exists between IHI and individual cognitive behavioral profile. In relation to these objectives, we assumed the following two-tailed hypotheses: H1) there will be significant differences between rates of IHI presence in AD and MCI when compared to healthy-aged matched controls; H2a) individuals with AD and/or MCI will have significantly different hippocampal volumes (total, right and left) than healthy age-matched controls; H2b) hippocampal volumes (total, right and left) will be predictive of IHI presence; H3a) the clinical groups of AD/MCI will have significantly different cognitive scores (for each of the four separate tests) compared to healthy age-matched controls; and finally, H3b) within each clinical group, there will be a significant relationship between IHI presence and cognitive performance.
Word count: 1921
Participants
Pre-study validations for sufficient quality of the MR images for IHI assessment were carried out for 84 subjects. Eight participants failed quality control, seven were excluded due to incomplete neuropsychological assessment data and one patient had epilepsy comorbid with AD. The final participant cohort comprised 68 participants aged 49-88 years: 9 patients with mild AD; 10 patients with a recent diagnosis of MCI; and 49 healthy age-matched controls. See table 1 for participant demographic data. The standard clinical criteria was used for the diagnosis of AD, and MCI was diagnosed using the Revised Peterson criteria (Peterson, Smith & Warin, 1997), with patients showing abnormal memory functioning for their age and level of education. Patients were accrued <6 months after diagnosis, with no known psychiatric or neurological morbidities except for head injury. Handedness data was not collected, although Cury et al. (2015) concluded that frequency of IHI did not depend on handedness.
Ethical approval for clinical and healthy groups was granted from the Research Ethics Committee of the North Bristol NHS Trust, and University of Bristol, Faculty of Science Research Ethics Committee, respectively. All participants retained the capacity to provide written informed consent for anonymised data sharing and acquisition.
Table 1. Breakdown of demographic information for each participant group.
| AD | MCI | Healthy | |
| Age / years, mean (±SD) | 67.00 (±10.10) | 73.50 (±6.95) | 67.92 (±8.76) |
| Gender, n (%)
Male Female |
3 (33)
6 (67) |
5 (50)
5 (50) |
19 (39)
30 (61) |
| Head injury, n (%)
Yes No |
2 (22)
7 (78) |
3 (30)
7 (70) |
4 (8)
45 (92) |
| Total, n | 9 | 10 | 49 |
Note: No significant between-group differences were found for age (F(2, 65) = 1.883, p = .160), gender (F(2, 65) = 0.296, p = 0.745) or head injury (F(2, 65) = 1.128, p = .127). SD denotes standard deviation of the mean.
MRI data and Image Acquisition
Image acquisitions were performed on a Siemens Magnetom Skyra 3-Tesla Scanner equipped with a 32-channel head coil. Volumetric T2-weighted MR images were obtained using a 2D multi-echo spin echo sequence in the oblique plane in which the long axis of the hippocampus was perpendicular to the coronal plane. Thirty-four contiguous slices were acquired from each subject with the following parameters: TR=5500ms, TE=12ms, echo spacing=12ms, number of echoes=10, Field-of-view (FOV)=184x218x58mm³, resolution= 0.34×0.34×1.72mm³, after 2-fold interpolation in-plane by zero-filling in k-space, and inclusive of 15% slice gap, GRAPPA factor 2, voxel size=1×1×1mm³. Acquisition time was 11.07ms. The magnitude images corresponding to each echo train were subsequently summed to improve signal-to-noise ratio. Linear registrations were deemed unnecessary since the T2-weighted images were processed in the same space as part of a processing pipeline.
Criteria of IHI
The protocol for assessing IHI closely followed that defined by Cury and colleagues (2015), albeit with several modifications. For example, a manual hippocampal segmentation protocol (Wood et al. 2015), was applied to identify six hippocampal subfields: the cornu Ammonis (CA) subsections (CA1, CA2 and CA3); Dendate Gyrus; subiculum; and the lumped Stratum Lacunosum (SL) + Stratum Radiatum (SR) + Stratum Moleculare (SM) (SL/SR/SM). Subfields were labelled through the entirety of the hippocampal structure, and improved specific visibility of subfield boundaries for assessing IHI. Secondly, we quantified visual evaluation for criterion 1 and 3 using voxel-counting; yielding greater accuracy and reliability of measurements (Novak & Einstein, 2013). In a similar vein, subiculum thickness (criterion 4) was quantified by protrusion into the choroidal fissure. Table 1 shows the variables used for methodology development alongside radiographic MRI features of IHI. The final criteria are presented graphically in Figure 1.
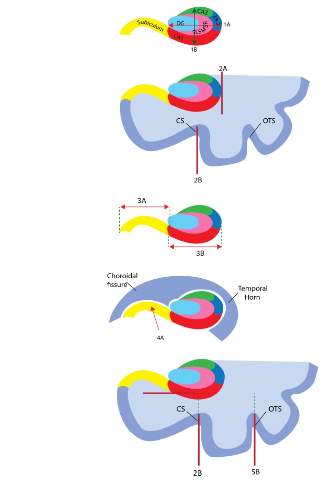

Figure 1: Illustration of the five criteria used for assessing IHI. Criterion 1: Roundness and verticality. The horizontal arrow (1A) stretches from the medial part of the DG to the lateral part of the hippocampal body, while the vertical arrow (1B) extends from the top part of the CA3 to the bottom part of CA1. Criterion 2: Verticality and depth of the CS. The vertical line (2A) represents the lateral limit of the hippocampal body which is used to determine the depth of the CS, whereas the vertical line (2B) indicates if the CS is vertical, oblique or horizontally aligned. Criterion 3: Medial positioning. Segment 3A is used to determine the width of the subiculum; and segment 3B specifies the width of CA1. Criterion 4: Thickness of the subiculum. The arrow marked 4A allows for judging whether the subiculum protrudes into the choroidal fissure. Criterion 5: Depth and orientation of the occipito-temporal sulcus (OTS). Segments 2B and 5B are used to determine the verticality of both the CS and the OTS, while the dotted lines indicate the superior parts of both sulci until the lateral limit of the subiculum.
Table 2.Radiographic features of the variables used for IHI assessment. Adapted from Cury et al. 2015; Bajic et al. 2007.
| Variables for criteria use | Normal | IHI |
| Hippocampal body shape | Oblate | Round/prolate; vertical |
| Verticality and depth of the CS | Not deep; horizontally
positioned |
Deep; vertically positioned |
| Localisation of the
hippocampal body |
Laterally positioned | Medially positioned |
| Thickness of the subiculum | Subiculum does not protrude into the choroidal fissure | Subiculum is thickened
(i.e. inflated or puffed); protrudes into the choroidal fissure |
| Depth and orientation of the OTS | None of the sulci (CS and OTS) exceed the level of the subiculum and are horizontally
positioned |
CS or OTS is deep when either exceeds the subiculum in a vertical orientation |
Criterion 1: roundness and verticality of the hippocampal body. The morphological analysis for IHI includes an abnormally rounded hippocampal body, evaluated in coronal planes using two distances: the width (1A) and height (1B) of the hippocampal body. Segment 1A extends from the outermost medial part of the DG to the lateral point of CA1. Perpendicular to segment 1A, segment 1B extends from the ventral part of CA3 to the dorsal part of CA1. Figure 1 (criterion 1) illustrates the guidelines used for evaluating this criterion.
The roundness of the hippocampal body shape can be categorised into three groups: flat (1A > 1B), round (1A ~ 1B ±1 voxel) and ovoid (1A < 1B ±1 voxel). The orientation of segment 1A can provide a basis for determining hippocampal body verticality: horizontal (tolerance ±10°), oblique (1A ~ 45°) and vertical (tolerance ±10°). Further details regarding the scoring methodology for assessing hippocampal morphology are outlined in Table 3. Examples are shown in Figure 2.
Table 3. IHI scores for evaluating roundness and verticality of the hippocampal body (criterion 1)
| Horizontal | Oblique | Vertical | |
| Flat | 0 | 0.5 | N/A |
| Round | 0.5 | 1 | 2 |
| Oval | 1 | 1.5 | 2 |
Criterion 2: depth and verticality of the CS. The CS refers to the groove that runs anteroposteriorly on the ventral surface of the occipital and the temporal lobe; separating the fourth and fifth convolution. As seen in Figure 1A (Criterion 2), the depth of the CS is assessed at the level of the hippocampus; specifically, the lateral limit of the hippocampal body, while the orientation of segment 2A can further be used to determine verticality (i.e. horizontal, oblique or vertical) of the sulcus. Table 4 outlines the scoring methodology used for determining whether a CS is deep and vertical. For instance, if the CS crosses the lateral limit of the hippocampus, the IHI score for this criterion will vary between 1 and 2, depending on the extent of overlap. This score is further dependent on the verticality of the CS: a more vertical sulcus will also result in a higher score.
Table 4. IHI scores for assessing the depth and verticality of the CS (criterion 2)
| CS < H | CS = H | CS > H | |||||
| Verticality | horizontal | oblique/vertical | horizontal/oblique | vertical | horizontal | oblique | vertical |
| Grade | 0 | 0.5 | 1 | 1.5 | 1 | 1.5 | 2 |
Criterion 3: medial positioning of the hippocampus.As illustrated in Figure 1 (criterion 3), the length of CA1 (segment 3A) was measured relative to the length of the subiculum (segment 3B) to evaluate the medial positioning of the hippocampus. Note that both lengths are defined orthogonally to the brain midline even if the hippocampus is vertically or obliquely inclined. To assess the extent of medial positioning, a five-level scale was used; ranging from a very lateral positioning (IHI score = 0) to a very medial positioning (IHI score = 2). However, this scoring is dependent on the number of voxels counted that represents the length for each segment. For example, if the voxel count for CA1 is 2-5 voxels more than the voxel count for the subiculum, then the hippocampus is laterally positioned. Similarly, if the voxel count for CA1 is 2-5 voxels less than the voxel count for the subiculum, then the hippocampus is medially positioned. See Table 5 for scoring this criterion.
Table 5. IHI scores for estimating the medial positioning of the hippocampus (criterion 3)
| Positioning | IHI score | Voxel-count tolerance | |
| Subiculum << CA1 | Very lateral | 0 | 5+ voxel difference |
| Subiculum < CA1 | Lateral | 0.5 | 2-5 voxel difference |
| Subiculum = CA1 | Neutral | 1 | ±1 voxel difference |
| Subiculum > CA1 | Medial | 1.5 | 2-5 voxel difference |
| Subiculum >> CA1 | Very medial | 2 | 5+ voxel difference |
Criterion 4: thickness of the subiculum. Cury et al. (2015) adopted this criterion from Bernasconi and colleagues’ (2005) visual evaluation of IHI, which involved making observations of the subiculum in relation to its’ thickness. Herein, a subiculum is considered thickened if it has an abnormal bulge upwards. To quantify this criterion, the thickness of the subiculum was modified by its’ protrusion into the (usually empty) choroidal fissure; corresponding to an IHI score of 2. If the subiculum is not protruding into the choroidal fissure, then the hippocampus is given an IHI score of 0.
Criterion 5: depth and verticality of the OTS.This criterion supplements the assessment in criterion 2, where the depth and verticality of the OTS is considered in addition to the CS. The OTS refers to the groove that runs anteroposteriorly on the ventral surface of the temporal lobe, and separates the third and the fourth convolution. As seen in Figure 1 (criterion 5), the depth of the CS and OTS is assessed at the level of the subiculum, while segments 2A and 5B are used to determine the orientation of both sulci. Criterion 5 is evaluated on three levels, as shown in Table 6. If neither superior parts of the sulci cross the lateral limit of the subiculum, then an IHI score of 0 is given regardless of its’ orientation. However, if either or both sulci exceed the lateral limit of the subiculum in an oblique angle, then an IHI score of 1 was given. An IHI score of 2 is given if a sulcus exceeds the subiculum in a vertical orientation.
Table 6: IHI scores for assessing the depth and verticality of the OTS (criterion 5)
| CS and/or OTS < Sb | CS and/or OTS > Sb | |||||
| Verticality | Horizontal | Oblique | Vertical | Horizontal | Oblique | Vertical |
| Grade | 0 | 0 | 0 | 0.5 | 1 | 2 |
Assessment of IHI
IHI was assessed by a trained observer using visual inspection for criterion 2, 4 and 5, and the voxel-count method for criterion 1 and 3. This assessment was performed on each slice in a coronal plane throughout the hippocampal body, and separately for the right and left hippocampi. The five criteria were graded from 0 to 2. The resulting IHI scores, obtained for each criterion from each coronal slice in a hemisphere were averaged to get more reliable measures of IHI. Finally, the sums of the individual IHI grades were calculated to give a cumulative IHI score out of 10. The optimal threshold, IHI ≥ 3.75 (Cury et al., 2015) was further computed as a secondary outcome. To explore the degree of intra-rater reliability for the IHI assessment, ten participants were randomly selected from the sample to be re-evaluated. [Add table here]
Volumetric analysis
Volumetric analyses were performed to assess whether volume differences corresponded to morphological differences in IHI hippocampi. Following the segmentation of hippocampi, an experienced researcher used the FSLmaths tool within the FSL software to manually draw the masks of the various regions selected. The FSLstats function was subsequently utilised to extract volumes of each subfield in mm³, where the sum of voxels unique to each mask is multiplied by the volume of a voxel. Hippocampal volume can then be calculated by summing the calculated volume of all subfields. However, there is a possibility that those with larger total brain volume (TBV) also have larger subfield volumes. Hippocampal subfield volumes were therefore normalised to total brain volume (TBV), again using the FSLstats function. Although volumetric values of various brain regions were calculated, note that only volumes of the right and left hippocampus were extracted for the purposes of this study.
Neuropsychological assessment
The Montreal Cognitive Assessment (MoCA) (Nasreddine et al., 2005) and the Hopkins Verbal Learning Test – Revised (HVLT-R) (Brandt 1991; Benedict, Schretlen, Groninger, & Brandt, 1998) was used to establish the functional significance of IHI. The MoCA is a 30-point cognitive screening test for mild cognitive dysfunction and a score of above 26 is considered normal. The HVLT-R is the more specific verbal learning and memory test in which one is tested on the ability to recall as many words as they possibly can. To limit the number of tests, only the totaled immediate recall scores (HVLTTR) and delayed recall after 25 minutes (HVLTDR).
Data Analysis
Without prior literature establishing expected group mean differences and effect sizes, it is difficult to calculate the minimum sample size needed for multivariate statistics (Brooks, Gordon, & Johanson, 2011). However, recent literature has generally demonstrated high power in studies examining neuropathy and cognitive status in patients with AD as compared with healthy controls (Nelson et al., 2013). Power analysis for chi square, one-way ANOVA with three groups, and logistic regression with one predictor were conducted in G*Power to determine that sample size was sufficient using an alpha of 0.05, a power of 0.80, and a large effect size (f = 0.40) (Faul, Erdfelder, Buchner, & Lang, 2009, 2013).
The research followed a between-groups (Healthy, MCI, and AD) study design where the dependent measures were IHI presence (total, left, right), hippocampal volume (total, left right), and cognitive scores (four cognitive tests). Statistical analysis was performed in SPSS statistical software (version 24, IBM Corp), in which data was assessed for assumptions, which were mostly met (see Appendix A).
Word count: 1794
Results
Assessment of Group Prevalence of IHI Characteristics
Figure 3 illustrates the prevalence of IHI in each group (AD, MCI and healthy) according to the dichotomous IHI presence variable. One can note that while IHI presence was rarely detected, unilateral left IHI are slightly more common for all groups compared to unilateral right IHI. However, there was no significant difference between IHI presence and the three groups χ2(2) = 0.460, p > .05. Furthermore, there were no significant differences between groups with or within subjects for hemisphere (χ2(1) = 3.043, p > .05).
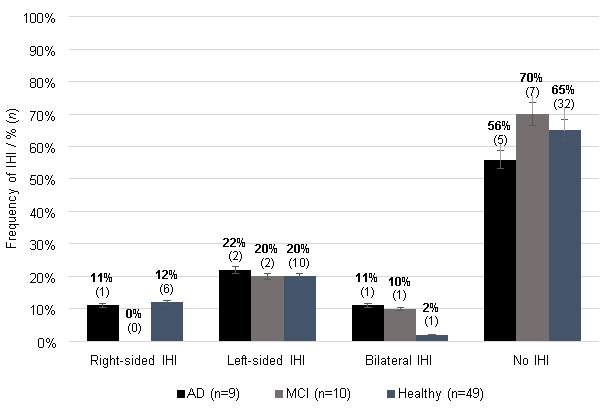
Figure 3: Presence of IHI among groups. Error bars are displayed with percentage values of 5%.
Assessment of Hippocampal Volumes and Relation to IHI Presence
Hippocampal volume. There were no significant between-groups differences for total hippocampal volume (F(2, 65) = 0.127, p > .05. However, the ANOVA shows statistically significant differences between groups for hippocampal volume in both the left (F(2, 65) = 6.709, p < .01) and right hemispheres (F(2, 65) = 6.442, p < .01). Tukey post-hoc tests further revealed that left hippocampal volume was significantly lower in MCI (2172.0 ± 556.5, p = .017) and in AD (2160.7 ± 682.4, p = .020) compared to healthy controls (2634.6 ± 408.5); and right hippocampal volume was not statistically significantly lower in MCI (2373.4 ± 501.8, p = .084) but was statistically significantly lower in AD (2188.0 ± 671.7, p = .006) compared to healthy controls (2725.1 ± 415.5). In relation to hypothesis 2a, the null hypothesis can be rejected for two specific predictions: in comparison with healthy-aged matched controls, (1) individuals with either AD or MCI had significantly lower left-hemisphere hippocampal volumes, and (2) individuals with AD, but not MCI, had significantly lower right-hemisphere hippocampal volumes.
Predictive Value of Hippocampal Volume on IHI Presence. A series of logistic regressions were performed to test the ability of hippocampal volume to predict the presence of IHI. The first logistic regression model ascertaining the effects of total hippocampal volume to predict the presence of IHI was not statistically significant, χ2(8) = 11.482, p > .05; this explained 2% (Nagelkerke R2) of variance and correctly classified 64.7% of cases. A second logistic regression model ascertaining the effects of right side brain volume on the likelihood that participants have right side IHI presence was not statistically significant, χ2(1) = 1.665, p > .05; this explained 4.5 percent (Nagelkerke R2) of variance and correctly classified 86.8 percent of cases. A third logistic regression model ascertaining the effects of left side brain volume on the likelihood that participants have left side IHI presence was not statistically significant, χ2 (1) = 0.443, p > .05; this explained 1.0% (Nagelkerke R2) of variance and correctly classified 75.0 percent of cases. In relation to Hypothesis 2b, the null hypothesis cannot be rejected: hippocampal brain volume was not predictive of IHI presence.
Assessment of Cognitive Abilities in Relation to Clinical Group and IHI
MoCA. An ANOVA showed that there was an overall between-groups difference in MoCA, F(2, 65) = 46.603, p = .005. The Tukey HSD shows significant (p < .01) differences between all groups: the AD group had a significantly lower mean score than the MCI group, which in turn had a significantly lower mean score than the control group.
HVLTTR. The between-groups ANOVA shows a significant difference in HVLTTR scores across groups (F(2) = 18.720, p = .005). The Tukey HSD shows no significant difference between mean scores for the AD and MCI groups. However, it does show that both the MCI and AD groups (p < .01) have significantly lower mean scores than the control group.
HVLTDR.The mean score for the HVLTDR was 8.0 (SD = 3.562). The Kruskal-Wallis Test shows that the control group had the highest mean rank, followed by the MCI group, followed by the AD group. This was significant, KW (2) = 23.416, p = .017 after a Bonferroni correction. The post-hoc Mann Whitney U tests show that the control group had a higher delayed recall average score than the MCI group, MWU = 83.50, p = .001; the control group had a higher average score than the AD group, MWU = 40.5, p = .005; and the MCI group had a higher average score than the AD group, MWU = 17.500, p. = .022.
In relation to hypothesis 3a, the null hypothesis can be rejected for the primary prediction: both clinical groups of AD and MCI had significantly different (lower) HVLTTR total recall scores compared to healthy age matched controls. For the MoCA and HVLTDR, mean scores were also significantly higher for the MCI group than for the AD group.
Predictive Value of Cognitive Scores on IHI Presence. A series of regression models shows that our selected cognitive scores are not significantly predictive of IHI presence (MoCa: χ2 (1) = 1.132, p > .05, explained 2.3% (Nagelkerke R2) of variance and correctly classified 66.2% of cases; HVLTTR: χ2 (1) = 1.132, p > .05, explained 2.3% (Nagelkerke R2) of variance and correctly classified 66.2% of cases; HVLTDR: χ2 (1) = 0.184, p > .05, explained 0.4% (Nagelkerke R2) of variance and correctly classified 64.7 percent of cases. In relation to Hypothesis 3b, the null hypothesis cannot be rejected: cognitive scores were not predictive of IHI presence. (Word count = 863)
Discussion
The central aim of this exploratory study was to examine the putative role of IHI in AD and MCI; and evaluate the potential uses of IHI as a diagnostic and prognostic marker. We found no significant differences between IHI in either clinical groups when compared to healthy controls, thus perpetuating the existing controversy of IHI being associated with onset of neuropsychiatric disorders.
Assessment of Group Prevalence of IHI Characteristics
This first test was performed as a validation of the sensitivity of our procedures for detecting IHI associated with AD/MCI.Contrary to our prediction, IHI does not appear to be a rare finding in both clinical groups. This point does not argue for IHI as a developmental risk factor for AD. However, this finding is somewhat in line with the neuropathological literature, wherein some studies reported different estimations on the relationship between IHI and epilepsy that conveyed IHI as a rare finding in the epileptic population (Bajic et al. 2005; Beker, Köken, Ünlü, Kaçar & Balçık, 2017). Although their sample sizes were limited; meaning that this need to be confirmed using larger clinical and healthy cohorts. Given that IHI was observed in both our clinical and control groups, the question remains as to whether IHI is 1) a normal morphological variant of no clinical significance or 2) a part of the normal phenotypic spectrum of the hippocampal shape (Bernasconi et al., 2005). As such, carrying out volumetric analyses to test whether morphological differences of the hippocampus correspond to volume differences could offer possible insights.
Assessment of Hippocampal Volumes and Relation to IHI Presence
Here, it was predicted that hippocampal volume would be lower in the AD and MCI groups than for controls. While the null hypothesis could not be rejected for total hippocampal volume, it was found that individuals with either AD or MCI had significantly lower left-hemisphere hippocampal volumes, and individuals with AD, but not MCI, had significantly lower right-hemisphere hippocampal volumes relative to controls. Logistic modelling showed that hippocampal brain volume was not predictive of IHI presence; this is not surprising as there were no significant between-group differences for IHI presence.
These findings are consistent with those of recent studies. Hippocampal volume has been identified as a useful biomarker for the detection and monitoring of MCI and early AD (Weiner et al., 2013, 2015). Although not pathologically specific, hippocampal volume decreases as the individual transitions from MCI to AD, and has recently qualified as a biomarker for use in enriching clinical trials in subjects with MCI (Hill et al., 2014). For example, Vijayakumar and Vijayakumar (2013) have demonstrated that the reduction of hippocampal volume and volume-ratios are both directly correlated to severity of cognitive impairment as observed in patients with AD, with an asymmetrical decrease in volume of left hippocampus. The importance of analysing each side of the hippocampus separately for each clinical group is highlighted in a meta-analysis of cross-sectional studies which demonstrated that a left-right asymmetry is normally demonstrated among healthy controls and patients with MCI; this asymmetry decreases with the progression to AD (Shi, Liu, Zhou, Yu, & Jiang, 2009). Loss of hippocampal volume was seen at equal rates for left and right sides, with twice the loss of volume for AD than MCI patients.
The lack of significance for the prediction relating to total hippocampal volume could be due to sample size. The sample size had been based on an optimistic prediction of high effect size, which was not obtained. However, for ethical reasons, researchers should not use a larger sample size than they are expecting to need, especially when working with vulnerable populations (Clark, Berger, & Mansmann, 2013). It generally is difficult for AD patients to submit to an MRI scan as they must lie very still for approximately 30 minutes; this is in addition to the cognitive testing. Furthermore, the researcher has an ethical obligation to ensure that vulnerable populations will benefit from their participation. As this was in part a feasibility study, improvements should be made to the procedure before replicating with a larger sample.
Assessment of Cognitive Ability and Relation to IHI Presence
In relation to clinical manifestations, both AD and MCI groups had significantly lower cognitive scores compared to controls. For the MoCA and HVLTDR, mean scores were also significantly higher for the MCI group than for the AD group. For the HVLTTR, there were no significant differences between the MCI and AD groups. These findings are consistent with previous studies. A validation study of the MoCA showed high diagnostic accuracy in discriminating between AD and MCI (Freitas, Simões, Alves, & Santana, 2013). Kerchner et al. (201) have reported that delayed recall (measured by the HVLTDR), but not immediate recall (measured by the HVLTTR), is related to AD-related atrophy of the hippocampus, specifically the areas of CA1-SP and CA1-SRLM. Cognitive scores were not predictive of IHI presence, possibly, as there were no significant between-group differences for IHI presence.
Value and Implications
The aims of this research fit with those of the AD Neuroimaging Initiative, which was established to identify and characterise diagnostic biomarkers of AD that could be used for the early identification of AD as well prognostic biomarkers monitoring disease progression from normal cognition to MCI to dementia (Mueller et al., 2005; Weiner et al., 2010, 2013, 2015). There is still an urgent need for diagnostic biomarkers that can correctly distinguish patients with AD pathology so that samples can be accurately identified for clinical trials (Fleisher, Donohue, Chen, Brewer, & Aisen, 2009; Shaw, Korecka, Clark, Lee, & Trojanowski, 2007). Characteristics of an ideal biomarker include sensitivity, specificity, positive predictive value, and negative predictive value (Clark et al., 2009; Hampel et al., 2010; Petersen & Jack, 2009). As there is no single biomarker for AD meeting these requirements, researchers must rely on a combination of methods (Weiner et al., 2013, 2015). To date the most promising MRI-based classification method identified in this initiative involves hippocampal shape-modelling, still in development by Shen et al. (2012), with discriminating landmarks showing correlations with memory-related measures (Weiner et al., 2013, 2015). Curry et al.’s (2015) procedure has not been extensively studied but is worth further investigation in the AD/MCI populations.
It is worth noting that while it may be that there is no difference between our AD/MCI and control groups in prevalence of IHI, limitations to our procedures may have led to an artificial decrease in identified prevalence. First, we may have missed some of the pathologies associated with AD/MCI for several reasons. Although the author was trained in the protocol, this was the first experience applying the procedure in a clinical study. Potential bias may also have existed because IHI was assessed by only one researcher who was not blind to patient/control status. Intra-rater reliability was high, but inter-rater reliability would have been useful. Second, hippocampus masks were not available for surrounding sulci and choroidal fissure which would have aided with the assessment for criteria two and five (Pluta, Yushkevich, Das, & Wolk, 2012).
Third, the 3T scanner resulted in some blurry images which may have prevented proper classification, especially for the clinical groups, where hippocampal atrophy was clearly visible. A higher resolution with more detailed images may have resulted in more accurate classification. According to the AD Neuroimaging Initiative, 3T scanning is standard, but higher resolution fields are now available (Weiner et al., 2015). Additionally, Mortamet et al. (2009) have developed a protocol, whereby patient artefacts can be accounted for and image quality automatically assessed at the time of screening, thereby maximising the likelihood of obtaining clear scans in one session. Nevertheless, Weiner et al. (2015) concluded that the manual segmentation protocol, used in our study, is generally superior in accuracy to the automatic hippocampal segmentation used by Cury et al. (2015).
Due to non-significance in the first aim and in all logistic regressions, we conclude that IHI is unlikely to be a prognostic and diagnostic marker for AD. Nevertheless, our exploratory study yields valuable information necessary for the creation of a manual hippocampal segmentation protocol suitable for use as a preliminary screen for checking hippocampal morphological abnormalities in research and clinical work. If IHI can pertube normal shape of the hippocampus and other anatomic structures in its surrounding environment, then shape modelling may provide valuable information beyond gross morphology, which could eventually contribute to better automated IHI identification.
Cite This Work
To export a reference to this article please select a referencing stye below:
Related Services
View all


Related Content
All TagsContent relating to: "Alzheimers"
Alzheimer’s disease is a neurodegenerative disease that causes a progressive decline in brain function, affecting memory, language, orientation, and reasoning. Symptoms usually begin mild and get progressively worse.
Related Articles

DMCA / Removal Request
If you are the original writer of this dissertation and no longer wish to have your work published on the UKDiss.com website then please: