General Motors Chevrolet Silverado 2500 Growth Strategy
Info: 24443 words (98 pages) Dissertation
Published: 25th Aug 2021
Table of Contents:
Executive Summary 5
Company
Who is General Motors? 6-7
SWOT Analysis 8-9
Organizational Structure 10
Leadership 11
Corporate Goals 12
Capabilities and Processes 13-14
Industry Environment 15
Customers
Customer Value Proposition 16
Who Are They? 16-17
What Are They Purchasing? 18
Why Are They Purchasing Our Products? 18-19
Brand Loyalty 20
Context
Industry 21
Economic 21-22
Technological 22-23
Societal 24
Legal 24-25
Competitors
Ford 26-27
Financial Ratio Analysis (GM v. Ford) 28-30
Operating Margin 30
Interest Coverage 30-31
Relation to Partnering with Isuzu 32-33
Toyota 34-36
FCA 37-39
Growth Strategy
Goals 40-41
Market Selection 42
Target Market 42-43
Positioning 43-44
Strategy Execution
Product goals 45
Process 46
Outsourced Components 47
Life Cycle Stage 48
Complementary Services/Warranties 49
Place 50
Supply Chain System 50-51
Promotion 52-53
Price 54
Value Proposition 55
Price Sensitivity 56
Short/Long Term Price Strategy 57-58
Break-Even Analysis 59
Capital Budget Analysis 60
Implementation and Control
Time Implementation Activities 61
Forecast Estimates Supply Chain and Logistics 62-63
Forecasting Sales 64
Base Case 65-66
Best Case 67-68
Worst Case 69-70
Sensitivity Analysis
Price Increase 71
Price Decrease 72
Unit Increase 73
Unit Decrease 74-75
Financial Analysis 76
Conclusion 77
Sources 78-80
Executive Summary
General Motors is one of the biggest-selling vehicle manufacturers in the world. With a wide variety of vehicles, GM has always been at the top of their industry. Even though they are a top company in the industry, they are always looking for new and innovative ways to keep their markets wanting more.
With our teams new model of the Chevrolet Silverado 2500 that we have named the Workman, we are certain that it will bring a huge amount of success for General Motors. Because Chevrolet is already a brand of General Motors it will be easy to enforce the changes into the packaging and manufacturing of our new product. The Chevy Silverado Workman will bring efficiency and ease to every man and women who uses their pick up truck for business, leisure, and adventure. Our goal is to be able to attract the hard-working people who come to Chevy expecting a pick up that can keep up with their hard working lifestyles and flood the market. To ensure that our trucks are a success in the industry, we have established a variety of information that will help us to do so. We are going to be offering the Workman in dealerships located in California and Texas initially because those are the states that have the highest numbers of pick up sales in the nation. Making sure our product is still competitive, but also at a reasonable price is important for to us and for the consumers. With this being said we decided to price the Workman at 49,999 dollars. Though this is an increase in price compared to your usual pickup consumer are paying for a technological advantage that can not be found in any other pickup truck on the market.
Our team is very confident that our growth strategy for the Chevrolet Silverado 2500 Workman will be successful in the industry and will be a well-known product in the future.
Company
Who is General Motors?
General Motors began in 1908 when Buick Motor Company head William Crapo Durant spends $2,000 to incorporate General Motors in New Jersey. Durant initially thought cars were noisy, smelly, and dangerous. Nevertheless, the giant company he built would dominate the American auto industry for decades (1). Today General Motors is the third largest automobile manufactures (2). General Motors has one of the most diverse portfolios of vehicles that feature 10 different brands. Their billion-dollar company includes Chevrolet, Buick, GMC, Cadillac, Opel, Vauxhall, Holden, Baojun, Wuling, and Jiefang (3). Organization diversity offers, there is a wide variety of vehicles for the customer to choose from. Today General Motors works across different nations with suppliers, design centers, laboratories, and manufacturing plants in more than 100 countries (4).
General Motors is one of the most recognizable automobile companies in the works and continues to dominate the car industry. To accredit their success, General Motors mission has been to make the world’s best vehicles by creating a strong commitment to their customers, employees, partners, and other important stakeholders (5). They are a company that has successful in understanding a changing market and delivering long-term investment value.
General Motors is known as one of the traditional ‘big three’ automobile producers in the United States. Among the three General Motors has the highest percentage of market share in a very competitive industry. Their strength in the market is accredited to their commitment to safety, quality, and global involvement. They focus on a single global vision: to design, build, and sell the world’s best vehicles. This leads to world-class products that transform the industry. Also, General Motors different brands allow them to define their individual companies to specific customers, in return this shows a higher overall customer satisfaction. The differentiation strategy gives General Motors the ability to provide unique and superior value through its 10 brands.
SWOT Analysis
Strengths: One of General Motors biggest strengths is their strong position in the U.S. automotive market. GM is one of the three automotive brands that are considered the “big three” in the Untied States. Despite the company’s bankruptcy in 2009, GM is still the largest automotive manufacturer in the U.S. and hold over 17.3 of the market share (7). The U.S. is the second largest market for cars in the world and GM has earned over 60% of its revenue from this market. Furthermore, GM core strength is its strong position in the U.S. market. This gives them a competitive advantage against its competition and is the reason they continue to lead the automotive industry.
Weaknesses: One of General Motors strengths is also one of its largest weaknesses: dependence on the U.S. to generate most of its revenue. Similar to other automotive manufactures, General Motors relies on its home market for most of its revenue. General Motors has the highest market share compared to competitors in the industry. By relying on the U.S. for a majority of its revenue stream, GM is vulnerable to changes in the economy or demand within the U.S. market.
Opportunities: General Motors most relevant opportunity is the increasing demand for pickup trucks and SUVs because of the decrease in fuel prices. Fuel prices are the lowest in a decade. This influences car buyers to buy bigger vehicles like SUVs and pickup trucks that are fuel-inefficient. The fuel trend is relatively stable and is likely to be in the future. General Motors should strengthen its SUV and pickup truck offerings in order to increase the company’s profits.
Threats: General Motors is faced with increased competition from new companies that offer new technology and traditional manufacturers that control the rest of the industry. China is one of General Motors largest markets outside of the U.S. and Chinese manufacturers are gaining a foothold by offering lower prices with the similar quality build. There are also new companies, such as Tesla, that offer electric cars competing against General Motors Chevrolet Volt. Google has created a self-driving vehicle that threatens the traditional automotive industry. These are current threats General Motors faces now and will in the future.
Organizational Structure
General Motors leadership was unwilling to change prior to 2010. The company underwent an organizational change and a new corporation was being built. In 2010, the federal government intervened when General Motors became bankrupt. The government hired an outside source to restructure the company’s organizational structure. The organizational structure involved structural change, a cost change, process change and cultural change. General Motors removed its automotive product board and replaced it with an eight-person board decision-making team, which reports directly to the CEO. This speeds up daily decision-making (8). General Motors is comprised of various divisions of the brand, location, and services. The blue boxes indicate positions that report directly to the upper management and board of directors. The gold boxes are indirect reports that travel through the chain of command. 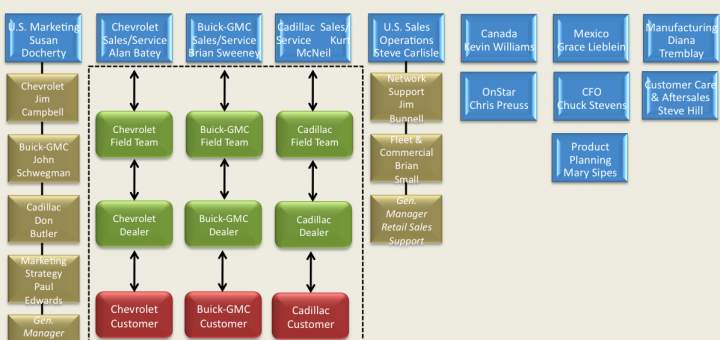
Leadership:
Mary T. Barra: Chairman & Chief Executive Officer
Barra was elected Chainman of GM Board of Directors January 2016 and has served as CEO since January 2014. Her focus is on strengthening the core business of great vehicles, while also working to lead the transformation of automobile technology such as connectivity, electrification, and autonomous driving (9).
Dan Ammann: President
Ammann was named the president in January of 2014. He is responsible for managing the company’s business operations around the world, the global Chevrolet and Cadillac brand organizations, global product planning, new business development and GM Financial.
Alan Batey: Executive Vice President and President, North America
Batey was appointed his position in January 2014. Batey also serves on the board of GM China’s joint venture, Shanghai General Motors Co., Ltd. (SGM), and the GM Foundation.
Corporate Goals
Mission Statement:
“G.M. is a multinational corporation engaged in socially responsible operations, worldwide. It is dedicated to providing products and services of such quality that our customers will receive superior value while our employees and business partners will share in our success and our stock-holders will receive a sustained superior return on their investment.”
Mission:
General Motors mission is to shape their brands around the world to inspire passion and loyalty. This drives breakthrough technology into automobiles and experiences car owners love. The entire General Motors team is motivated to serve and improve communities in which we live and work. Over time, it is how GM has shaped into the world’s most valued automotive company (10).
Capabilities and Processes
General Motors is a global business that operates on a complex supply chain. Meaning the logistics and distribution network is a continuous and ever-changing process for automobiles. General Motors has a long list of over 3,000 suppliers. A majority of suppliers are focused on specific component parts for production. General Motors is a single entity, so it does not own or control its suppliers.
While many car buyers view General Motors as simply an automobile manufacturer, their system operates on continuous improvement. This concept stems from the belief that mistakes can be avoided and defects can be prevented. This extends from all aspects of the company, from the plant floor to the accounting department. The common approach used to ensure continuous improvement for General Motors is Plan-Do-Check-Act. This process starts over once a new plan is implemented.
In 2001, General Motors signed an agreement to outsource almost all of its global logistics management and contracting entirely to a joint-venture fourth party logistics provider, Vector SCM. However, General Motors brought most of the management control back in an effort to regain control of its supply chain. Now, the company still uses a third party provider (LLPs) to manage most of its inbound logistics network routing.
General Motors has a very complex internal processes. Their entire process requires over 200,000 unique parts from 3,000 different suppliers. They also use 900 inbound and outbound suppliers. It is a large-scale logistics operation from order parts to the final production. General Motors has control over network design and sourcing, yet it has moved toward a hybrid model of outsourcing. This allows them to outsource functions like operations with Ryder and Penske but still, have retained a large share of what they do in the operations area.
Industry Environment
General Motors is considered to compete in an oligopoly market. There are only a few producers in the automotive industry, which makes the ones competing part of an oligopoly (12). Although there may seem to be numerous car competitors, a small majority controls most of the market. The U.S. automotive market is comprised of three major firms: General Motors, Ford, and Chrysler. The oligopoly is seen through prices, the development and introduction of new car models, and marketing in the car market. The automotive industry in the U.S. is collusive, as stated earlier, three firms control price. They rely on joint pricing to limit competition against the three. They act as a single monopolistic when it comes to pricing decisions and want to maximize the joint profit instead of a single firm. Between the three firms, they control 56% of the automotive market in the U.S. (13).
One of the major issues with the U.S. automotive industry is its unusual oligopoly. The three major companies control price, yet this leads to an increase in surpluses. There is an increase in producer surplus because the price is collusive and acts like a mark-up when considering price-quantity. This collusion generates a product surplus of $4 billion in each year. The joint oligopoly allows General Motors and the other two firms to have a competitive advantage in the automotive industry and the reason they have had control for nearly a decade.
Customers
General Motors Value Proposition
General Motors is a Global automotive company with a single purpose: To earn customers for life. Earning customer loyalty is one of the foundational promises of General Motors. “It is a commitment to treat every customer with respect. To care about a customer, not just when they purchase a new vehicle, but for as long as they own the vehicle. Appreciating customers and fighting every day to earn their loyalty inspires us to make better, safer, higher value cars, trucks and crossovers” (10).
General Motors has a strong belief in the quality of their product. They believe once a person buys one General Motors vehicle they will not buy a different brand. General Motors value proposition of sustainability has been successful for them for over 100 years. They believe the best way to maintain a customer base is to design and build top-notch quality cars, at an affordable cost.
Who Are They?
First, who is General Motors real customer? It is a dealership itself or the car buyer who is driving the car. It is true GM has to convince car dealerships to stay with their company, yet dealers are in the business to sell cars and they will stay with the manufacturer that will give them the be opportunity. So, the real customer for General Motors is the car buyer.
Now we are asking the question of whether customer value is more important that minimum waste. Car buyers do not value large inventories. Consumers want to buy the car they want when they want it, and at a low price. So, having large inventories is irrelevant to the consumer.
Demographics of a company’s customers play a huge role in deciding which type of market they selling in. A company looks at age, gender, and ethnicity when determining the demographics of their markets. General Motors has a wide range of demographics due to its multiple brands. But, they have focused on technology to weigh in on a customers buying-decision process. It varies across different segments and demographics. But technology enables customers to do more and General Motors has shifted from the older baby boomer are to the graying boomers from age 35-to-44 years old (17).
Focusing specifically onChevy, one of General Motors brands has used the “hard working” or the “work man” approach to selling their trucks. They had a commercial called “Like father, Like son”. It is a commercial that uses images of the hard-working father alongside his son suggesting that the hard-working tradition is passed down from one generation to another along with the Chevy truck brand.
Customer Geographic location is General Motors largest focus. In 2015, GM accredited over 70% of its revenue to North America alone. They focus on North America primarily because of its lasting customer loyalty. General Motors also targets this area because of the recent serge in demand for pickup trucks, low gasoline prices, and lower interest rates for vehicles (18). For our product, we have decided to focus on the southwest region of the United States. This is an area that is warm nearly the entire year and can have landscaping services year round.
What Are They Purchasing?
From electric cars to heavy-duty full-size trucks, General Motors provides a complete range of vehicles that meets the needs and expectations of drivers on a truly global scale. There are ten brands under the General Motors corporate umbrella: Chevrolet, Buick, GMC, Cadillac, Opel, Vauxhall, Holden, Baojun, Wuling, and Jiefang (3). In the United States, GM held a market share in the automotive industry with 16.7 percent in 2016 (1). The company’s leading four brands in the United States are Chevrolet, Cadillac, GMC and Buick according to 2016 sales numbers (2). GM’s loyal customers put their trust in the companies brands and products that they develop in the industry, which makes GM such a profitable company.
Not only does General Motors offer vehicles for your everyday customer they also help business owners and fleet managers find the perfect vehicles to fit their company needs. The website gmfleet.com allows businessmen and women the ability to look up body styles with options such as platform beds, stake beds, van bodies, dump beds and other specialty options that fit the customer’s business needs. General Motors has a range of products that their company offers that make it the company that customers are able to trust and rely on from generation to generation
Why Are They Purchasing?
General Motor vehicles are not only purchased as a means of transportation, but they also purchased for the customer service that GM provides. GM has a commitment to treat every customer with respect. The company aims to care about a customer, not just when they purchase a new vehicle, but for as long as they own the vehicle. Appreciating customers and fighting everyday to earn their loyalty inspires GM to make better, safer, higher value cars, trucks and crossovers.
Another great thing about General motors is that their products are very accessible to customers. GM vehicles are sold in over 19,000 dealers in over 124 countries (10). Customers also turn to GM for their product’s safety and quality. General Motors assigns the highest priority to matters that impact their customers’ well-being and quality of life. GM proves this by having more 2016 models with a 5-Star overall vehicle score than any other manufacturer selling in the U.S. as well as designing crash test dummies that remain the global standard for frontal crash testing and being the first North American auto manufacturer to build a Rollover Test Facility. With being environmentally friendly becoming more important when consumers are making purchasing decisions GM has adapted to seek creative and innovative solutions for the environment.
General Motors is consistently adopting policies and developing technologies that promote a cleaner planet from supply chain to manufacturing to the vehicles we put on the road. GM has been granted more clean-energy patents than anyone else for more than a decade and has 73 facilities that have received an EPA Energy Star Challenge for Industry which is more than any other company. GM is also the only automaker to sign a Climate Declaration making tackling climate change a priority (10). General Motors is an innovator in the automobile industry and give consumers many reasons to choose their brands and stay loyal customers for many years.
Brand Loyalty
The main reason customers continuously purchase General Motors vehicles is customer loyalty. In the past two years, GM has taken home the top prize in the HIS Markit’s Loyalty Awards. This is what separates General Motors from its foreign competitors in the market. General Motors has stayed on top of automotive technology within the market. The increasing innovation in the market is necessary for brand loyalty.
Another reason customers are loyal to General Motors is the brand itself. The recognizable GM logos or brands are associated with reliability and affordability. They have been able to uphold the integrity of the brand even through the 2008 recession. The name of the brand has much more value than just an automotive company. Its brand represents the American dream and opportunity. This separates General Motors from its competitors within the automotive market.
External Environment:
Industry
General Motors is considered to be in an oligopoly market. There are only a few producers in the US automobile industry which make these companies an oligopoly market. General Motors (GM) is included in this market because there are only three major firms that manufacture American trucks: GM, Ford, and Chrysler. For decades the American truck automobile industry has been dominated by these three major firms. In recent decades and even now GM faces many new competitors seeking market share in the US truck automobile industry. Smaller Firms such as Toyota, Honda, and even Tesla have grown exponentially and are currently competing with GM in different markets. General Motors main competition in the truck industry is the Ford F-series.
Economic
U.S. markets are peaking at historic levels, setting a sales record of just under 17.5 million vehicles in 2016, up 5.7 percent from the year before and topping the high-water mark of 17,402,486 in 2000. U.S. sales are likely to be relatively flat in the next two years and may face a moderate downturn in 2018, the victim of economic cycles, higher auto loan interest rates as the Federal Reserve raises overnight rates and an expected flood of vehicles into the used car market. Mexican auto sales outpaced forecasts in 2016, jumping 19 percent to more than 1.3 million units, and are expected to surpass 1.5 million by 2021. (23)
This is can be contributed to a numerous number of different factors but is largely beneficial to Chevrolet’s revenues. Lower gas prices due to OPEC and unemployment hitting a near record low has strengthened the economy and increased truck sentiment, causing previously historically large obstacles when purchasing a truck to be pushed to the side. This is important because every new full-size truck sold generates anywhere between $8-12,000 in gross profit according to Morgan Stanley.
The aftermarket repair and accessories market on these new trucks have also become very profitable for these truck companies. The Autocare Association predicts that the US automotive aftermarket will be worth $273.4 billion in 2017 – an increase of almost $35 billion in just four years. This puts the aftermarket between 1.5 and 2% of the US Gross Domestic Product. It is predicted that over 4.2 million people work in the industry and growth is expected. The value of the repair/replacement truck market for vehicles 0-4 years old is $20.7 billion, but the value of the aftermarket for those 8 or more years old is a whopping $77.3 billion.
Automakers have also made large investments in new markets in emerging countries and need to be extremely flexible if they are to successfully navigate the next few years. A safe approach to this, closely managing expenses and factory capacity, is critical for success in Brazil and Russia. China, the world’s largest auto market, is expected to report annual vehicle sales of nearly 30 million by 2020.
Technological
Current technological trends in the truck industry revolve around making “smart” and “connected” cars. Some of the pieces of what the connected car will look like: a fully digitized vehicle with Wi-Fi; advanced infotainment systems and apps; vehicle-to-vehicle autonomous communications that let cars on the road “talk” to each other to exchange safety data such as speed and position in real time, GPS location that will locate the best route based on current traffic conditions, and networked links that will perform vehicle diagnostics and repairs and relay the information to you in immediately. Chevrolet has already implemented Wi-Fi and advanced infotainment systems with GPS navigation that tracks your location to help the driver map out his current route.
Fully autonomous cars are a tough sell to the average consumer and are not always wanted. The idea of fully autonomous vehicles is too futuristic for most of the public to embrace currently. Traditional powertrains are most likely to be a dominating feature for decades to come. In this landscape, newer vehicles will be distinguished primarily by their innovative technology involving both assisted driving and global connectivity. In a recent study, 56 percent of new car buyers said they would switch to a different brand if the one they were considering didn’t offer the technology and features they wanted. Similarly, 48 percent of car buyers said they would walk away from a vehicle they liked if the technology was difficult to use. (23) This is important, the obvious forerunner to the fully autonomous vehicle, the “smart” car provides drivers a precursor of the experience of relinquishing control of a vehicle, with functions like self-parking, self-braking, automatic cruise control, accident-avoidance features, computer-operated power steering, as well as electronic throttle control and engine control with rear camera’s mounted. Rear cameras will be a priority. By 2017, 80% of all manufactured cars will have one partially due to legality reasons.
Societal
In the past 5 years, the US truck automobile industry has been booming. One in every 8 new vehicles sold in the U.S. in 2016 was a full-size pickup truck. This is a major change in the societal environment because consumer preference for full-size pickup trucks has largely increased over previous levels. Of those 1 in every 8 new vehicles being sold being a full-size pickup truck, 90% of them were produced by General Motors, Ford, or Chrysler.
Consumers in the United States have a clear preference for American made trucks. These trucks are used for their adaptability, versatility, and utility. Consumers use these trucks for difficult terrain, personal driving in bad weather conditions, worksite jobs such as hauling gravel or other materials, or for fun trips to the lake with kayaks and other accessories loaded into the bed. This is a highly profitable market and General Motors is cashing in with their Sierra and Chevrolet full-size trucks. Full-size pickup sales shot up nearly 10 percent last month and are up nearly 7 percent for the year. Average transaction prices continued marching higher up 5 percent for the year through mid-April, to $41,543, J.D. Power data show.
Legal
Stricter fuel economy regulations are closing in for General Motors. By 2025, for example, automaker fleets in Europe and the U.S. will have to average upward of 60 miles per gallon. This is to reduce the carbon footprint that trucks leave compared to other greener vehicles and to lessen gas consumption. These regulations encourage truck automakers to develop fuel-efficient pickups, but could be harmful to the societal environment that these companies thrive in. All new cars must also include a backup camera by May 2018. According to the National Highway Traffic Safety Administration (NHTSA), roughly 200 people are killed each year and another 14,000 are injured in so-called back over accidents. (23) It is predicted that these new backup cameras will go a long way in preventing injuries from backing out especially in young children. This new law applies to all vehicle weighing less than 10,000 pounds, and the cameras must produce an image of a 10 foot by 20-foot zone behind the vehicle which most backup cameras will have no difficulty achieving.
Competitors
Ford
Ford Motor Company is an American multinational automaker and a well-known company throughout the United States (14). Ford is considered to be one of General Motors biggest competitors in the automotive industry. In terms of U.S. market share, General Motors holds 17.4% of the industry’s sales and Ford is in third with 14.4% control (15). Similar to General Motors, Ford had significant revenue growth since the economic crisis in 2008. Although the decrease in demand for cars during the recession harmed Ford, it was able to avoid bankruptcy and still stay in close competition in the U.S. automotive market.
SWOT Analysis:
Strengths: One of Ford’s strengths is that it has a strong brand image. Ford is known as a reliable car company within the automotive industry. The strong brand image contributes to its products attractiveness and customer loyalty. Ford also developed an effective innovation process. Ford is now more effective after the launch of the One Ford plan in 2008 (16). Focusing on only two brands rather than diversifying their brands has proven to support their brand image and focus their internal goals.
Weaknesses: One major weakness that Ford has is its limited global scope of production. This is a limitation of its network of production facilities. Ford has closed down some of its production facilities in Europe in recent years, worsening its global presence. The struggle to gain share in the global market has proven to be one of Ford’s biggest weaknesses.
Opportunities: One opportunity Ford has is new automotive technologies in the future, such as self-driving cars. These autonomous cars could increase demand for new models and sales. This would also increase the interest in car purchases throughout the whole market. Other technologies like alternative fuel cars or plug-in hybrids may increase Ford’s demand. These are growing in the automotive market, due to the concerns about air pollution.
Threats: Ford’s biggest threat is the presence of German and Japanese automakers in the American automotive industry, particularly Toyota and Volkswagen. Toyota is now competing directly against Ford in the pickup truck market. This is a huge threat to Ford’s profitable F-150 pickup truck. The increase in competition may directly effect Ford’s control within the U.S. market.
Competitive Advantage:
Ford’s primary advantage is its strategy that allowed low product cost by cutting all the excessive costs involved in the operations. They were able to cut down raw material costs and they introduced the online manufacturing process that focuses on the actual development of the cars on one process, rather than having different segments of production. Ford also has designed the first ‘world car’. The Ford fiesta is an automobile model that is sold around the world with some modifications. This is an ongoing development to provide standardized products worldwide.
Financial Ratio Analysis (General Motors v. Ford Motor Company)
General Motors Company:
PE Ratio: 5.66
| Liquidity Ratios: | 2014 | 2015 | 2016 |
| Current Ratio | 1.43 | 0.54 | 0.64 |
| Quick Ratio | 0.23 | 0.73 | 0.85 |
| Cash Ratio | 1.68 | 1.42 | 1.40 |
| Asset Efficiency Ratios: | 2014 | 2015 | 2016 |
| Asset Turnover | 0.85 | 0.75 | 0.71 |
| Fixed Asset Turnover | 5.45 | 4.67 | 4.38 |
| Working Capital Ratios: | 2014 | 2015 | 2016 |
| Accounts Receivable | 6.09 | 5.77 | 5.25 |
| Accounts Payable | 6.13 | 5.33 | 5.06 |
| Inventory | 10.12 | 9.32 | 9.89 |
| Interest Coverage Ratios: | 2014 | 2015 | 2016 |
| EBIT | 11.54 | 18.42 | 21.43 |
| Leverage Ratios: | 2014 | 2015 | 2016 |
| Debt Equity Ratio | 1.32 | 1.58 | 1.93 |
| Debt Capital Ratio | 0.57 | 0.61 | 0.66 |
| Operating Return Ratio: | 2014 | 2015 | 2016 |
| Return on Equity | 21.03 | 23.84 | 21.03 |
Ford Motor Company
PE Ratio: 9.85
| Liquidity Ratios: | 2014 | 2015 | 2016 |
| Current Ratio | 0.68 | 1.25 | 1.20 |
| Quick Ratio | 0.56 | 1.11 | 1.07 |
| Cash Ratio | 0.40 | 0.98 | 0.94 |
| Asset Efficiency Ratios: | 2014 | 2015 | 2016 |
| Asset Turnover | 0.65 | 0.62 | 0.59 |
| Fixed Asset Turnover | 1.16 | 0.98 | 0.64 |
| Working Capital Ratios: | 2014 | 2015 | 2016 |
| Accounts Receivable | 1.46 | 1.61 | 1.73 |
| Accounts Payable | 6.64 | 6.94 | 6.64 |
| Inventory | 16.05 | 15.32 | 14.70 |
| Interest Coverage Ratios: | 2014 | 2015 | 2016 |
| EBIT | 6.45 | 14.26 | 8.60 |
| Leverage Ratios: | 2014 | 2015 | 2016 |
| Debt Equity Ratio | 4.80 | 4.64 | 4.90 |
| Debt Capital Ratio | 0.83 | 0.82 | 0.83 |
| Operating Return Ratio: | 2014 | 2015 | 2016 |
| Return on Equity | 12.85 | 25.74 | 15.76 |
Operating Margin:
Operating margin is the proportion of a company’s revenue that is left over after paying for variable costs of production. This includes things such as wages and raw materials. General Motors has a higher operating margin than Ford, which indicates a few different points. The first is that General Motors makes more money per sale than Ford. General Motors operating margin for the 2016 fiscal year was 5.74% compared to Ford at 2.71% (19). This also shows that General Motors is able to pay off its fixed costs like interest and debt, better than Ford. Overall, General Motors has less financial risk than Ford.
Interest Coverage:
Interest coverage is used to determine how easily a company can pay interest expenses on outstanding debt. It is calculated by dividing EBIT by interest expense. General Motors has a higher ratio in the previous three years compared to Ford. Meaning, General Motors is less burdened by debt expense. This interest expense affects General Motors profitability, so when we developed a cost-benefit analysis of our new product we considered borrowing money to have a positive effect.
Relation to Partnering with Isuzu
When looking at the ratios of General Motors, you can see that the net profit margin has been at a stand still since 2015. This indicates that General Motors needs to make a change in order to stay competitive. The company could use an introduction into a new product line or a change with an old one. Truck sales are at an all-time high and the profit margins are a strong incentive to continue focusing on this market. It would make sense for General Motors to partner with Isuzu.
The two companies have linked a deal in 2014 that will allow GM to sell a medium-duty Chevrolet tuck in the U.S. built by Isuzu. The strategic partnership allows for collaborative business opportunities within the truck market. Even though the partnership is constructing medium-duty trucks, General Motors believes this will eventually increase pickup truck sales. General Motors return to the medium-duty truck market is a strategic move that not only broadens its lines of trucks, but will have an impact on other vehicle lines. Typically a medium-duty customer is in need of other trucks as well for their fleet, from midsize and light-duty, to pickup trucks.
General Motors partnership with Isuzu has a low financial risk that will increase market share in the truck market. General Motors as a relatively high net profit margin compared to competitors like Ford. A high net profit margin is one of the most important factors when determining a company’s financial health. The financial risk is shown in the fact that General Motors has a higher operating margin than Ford. Not only does this show General Motors is less of a financial risk, it also indicates GM is better able to pay off its fixed costs and debts compared to Ford. Overall, General Motors market penetration into the medium-duty truck market is a strategic partnership that has a low financial risk and will benefit its other lines of trucks as well.
Toyota
Toyota Motor Corporation is a Japanese automotive manufacturer headquartered in Toyota, Aichi, Japan. as of October 2016, was the ninth-largest company in the world by revenue. As of 2016, Toyota is the world’s second-largest automotive manufacturer behind German Volkswagen Group. Toyota was the world’s first automobile manufacturer to produce more than 10 million vehicles per year which it has done since 2012. Toyota is the world’s market leader in sales of hybrid electric vehicles, and one of the largest companies to encourage the mass-market adoption of hybrid vehicles across the globe. Its Prius family is the world’s top-selling hybrid nameplate with over 6 million units sold worldwide as of January 2017.
SWOT Analysis:
Strengths: One of Toyotas strengths is their brand image. Toyota has one of the strongest brands in the global automotive industry. This makes it easily recognizable from the other brands. Another strength for Toyota is their global supply chain. Their strong supply chain enables resilience and market-based risk minimization. One final strength for Toyota is their organizational culture; they have an organizational structure that facilitates rapid innovation, which is crucial for long-term competitive advantage.
Weaknesses: Toyota’s global hierarchical organizational structure prevents maximum flexibility of regional operations. Also, the company’s culture of secrecy is a weakness that reduces response times in addressing emerging problems. In addition, Toyota implemented massive product recalls starting in 2009. These recalls weaken the firm because the recall processes consume business capacity that could be used for product distribution instead.
Opportunity: Toyota’s opportunities are mainly based on technological and economic trends. There is a growing market in developing countries, which presents the opportunity to increase revenues by further penetrating these markets. Also, the current trends of increasing demand and interest for higher fuel efficiency and advanced electronics present the opportunity for Toyota to focus its innovation on these directions. In addition, the weaker Japanese Yen versus the U.S. Dollar means higher competitiveness of products and components exported from Japan to the U.S.
Threats: They’re biggest threat, like many other companies, is mainly from the competitive landscape. Toyota faces the threat of competition with low-cost automobiles from Korean, Chinese and Indian manufacturers, which have been increasing their presence in foreign markets. Toyota also experiences the threat of rapid innovation of competitors like GM and Ford.
Competitive Advantage:
Toyota’s uses both differentiation and low cost as generic strategies to try and gain a competitive advantage over their competitors in the automotive industry. Toyota is able to target such a large market because they have something for everyone. Toyota has four-wheel drive trucks and SUVs for the outdoor types or those who live in areas that face severe weather conditions, hybrid models like the Prius for the eco-friendly customers that are interested in saving the environment, along with the standard cars for general, everyday use. Additionally, Toyota provides vehicles for all price ranges. From the low-price Toyota Corolla line of cars to the high-priced luxury line of cars and SUVs with Lexus, Toyota has something for everyone.
Chrysler
Also, known as Fiat Chrysler (FCA). FCA US is one of the “Big Three” American automobile manufacturers. FCA US has its headquarters in Auburn Hills, Michigan and sells vehicles worldwide under its flagship Chrysler brand, as well as the Dodge, Jeep, and Ram Trucks. Other major divisions include Mopar, its automotive parts, and accessories division, and SRT, its performance automobile division. The Chrysler corporation was founded by Walter Chrysler in 1925. Chrysler greatly expanded in 1928, when Mr. Chrysler, who at one time worked for Buick, acquired the Fargo truck company and the Dodge Brothers Company and began selling vehicles under those brands (20).
SWOT Analysis:
Strengths: Some of Chrysler’s strengths include a strong brand in North American markets, strong customer focus and a strong employee base of over 50,000 workers. Another strength of Chrysler is their partnership with Fiat. It helped the brand grow in areas of technology, sales, and manufacturing processes. With the Fiat partnership, Chrysler was able to grow and has even been called “the comeback kid” worldwide.
Weaknesses: Chrysler has some pretty large weaknesses. First Chrysler is not progressing towards sustainable solutions, which could be a problem in the future with almost all car companies looking for ways to create more sustainable vehicles. Chrysler has been often said to have management problems. This is a big weakness because management needs to be the leaders for the future and make sure the company is progressing the way it wants to for the future. Chrysler also has a relatively limited line-up of products compared to its rivals like GM and Ford.
Opportunity: Going off the weaknesses, one opportunity Chrysler has is to change the management for the better. This would allow them to be better directed for the future. Another opportunity for Chrysler is to move into the “green vehicle” market. As previously stated most car companies are working toward some solutions to make the cars, 1. Better gas mileage 2. Give off fewer emissions from the car 3. Hybrid cars. With Chrysler’s partnership with Fiat, they could try expanding their markets to international borders such as Asia.
Threats: One of Chrysler’s biggest threats is that they have a very strong reliance on the North American market. Chrysler needs to think about expanding its borders. Having a heavy reliance on the North American market can hurt them if the market goes through another recession such as in 2008. Another threat is how behind they are in the hybrid market. Hybrid cars are becoming more and more popular, with Chrysler not putting to much effort into hybrid cars they could fall greatly behind some of their competitors.
Competitive Advantage:
One of Chrysler’s biggest competitive advantages is their World Headquarters and Technology Center. It is the only one of its kind in the automotive industry, the headquarters of FCA US, the Chrysler World Headquarters and Technology Center has everything necessary to conceive, build, evaluate and market a vehicle housed in one massive building in Auburn Hills, Mich. The 5.4-million-square-foot facility even has a pilot production plant where new Chrysler, Dodge, Jeep®, Ram and SRT models are assembled for the first time. Before this facility was built, FCA US employees routinely traveled to nearly 20 locations in the Detroit area to complete projects, making productivity dependent upon a lack of traffic jams on local highways. Today, employees go from vehicle design to development to production under one roof – in less time than ever.
Growth Strategy:
General Motors has two divisions that manufacture trucks: Chevrolet and GMC. Between these two brands, General Motors has become the number one seller of midsize and full-size pickup trucks in America. We looked at the most profitable vehicles in the industry. We narrowed down our search to pickup trucks after realizing they are the most profitable amongst the other vehicles. Due to General Motors control over the pickup truck market, we decided that our feature would increase the control over competitors. Our plan is to deliver a hydraulic truck bed for Chevrolet’s Silverado 2500. This model will allow truck buyers to have an automated truck bed paired with a heavy duty winch. This is a unique as no other competitors offer this feature. We are going to offer customers the autonomous hydraulic bed in select markets as a special model of the truck called the Silverado 2500 Workman. We would also be able to use GM’s existing factories to manufacture this innovative idea into fruition. Prior to settling on developing a new model of the 2500, we tossed around a few other options for a growth strategy.
Initially, we wanted to introduce this feature as an option that consumers could choose from when purchasing their truck. We believed that consumers that would be using their trucks for work purposes would see this option and jump at the opportunity. After realizing that showing our customers instead of telling them what the Workman can do by doing demos in store, we decided that having this model just be standard. Also, we would be able to allocate factory space for constant production of Workman instead of waiting for special orders. Also, our original product idea did not include a winch at the front of the bed which would allow owners to have ATVs, hay, or lumber autonomously pulled up into the bed saving the owner time as well as easing the strain on their bodies. We believe that by adding the winch customers will be more incentivized to purchase the Workman. Because of the obstacles we face by making it a special order we settled on making the Chevrolet Silverado 2500 Workman a standard model for consumers to purchase right from the dealership.
Market Selection
Market Selection is the process of deciding which markets to invest in and pursue. One major thing to keep in mind is the growth potential of the market. Another thing to keep in mind is to set marketing objectives and try to reach them. First, we determined the objectives of our market selection; which would be to increase revenue by at least 6 percent. Next, we will do a screening of the potential markets. After looking and evaluating the markets we will select a market that would be most profitable. We looked at what percentage of people buy trucks compared to cars, which are 18 percent. Then of the 18 percent, we looked at what percentage of those people purchased the truck for work purposes. We found 39 percent of truck buyers are purchasing the truck for work purpose. This will narrow down the market we would look to penetrate.
Target Market
In order to select our target market, we looked at the company’s core customer’s Demographics, Psychographics, and Geographic’s. We found 39 percent of truck owners purchase their truck for work purposes. We decided to attack this market and try to appeal to the everyday “work man”. We are targeting people who do physical labor and use their truck bed for work purposes. We believe our product will help manual labor workers such as construction workers, farmers and landscapers complete their job easier and with less work. We decided to focus on the southwest and southern region of the United States. We are looking to focus in on two main states, Texas and California. These two states have the highest sales in trucks. Texas specifically has two cities; Houston and Dallas, that are way above average in truck sales.
We chose this area to do our test market because it is warm all year and construction workers and landscapers are working year round in this area. We believe this product would help farmers transport and deliver their products to there customers easier than in the past. We are going to aim for big cities to try and reach a large market.
Positioning
Positioning is important to make sure that our product has the most successful launch and is generating revenue for the company and market. Last year Chevrolet started a marketing campaign known as “Real People, Not Actors” that has increased Chevy’s retail sales and making it the largest share increase of any full-line brand. This Marketing campaign has also proven to be effective at changing consumer perceptions of the brand through engaging in authentic conversations about their products.
Chevy also launched a national ad campaign for its Silverado pick-up which touts the result of a lab test that it says show how the Silverado’s roll-formed, high-strength steel bed suffers far less damage than the Ford F-150’s aluminum truck bed when a load of concrete blocks is dumped into the back of the trucks. This ad campaign also used Real Customers, Not Actors who were able to evaluate the damage done by the cinderblocks. Potential consumers watching the ad are able to see the people in the ad say things like “Ford needs to change their motto from Ford tough.” and “I would never buy a new Ford truck if they are coming with that bed in it.” Chevrolet truck marketing director told the Detroit Free Press. “Our engineering team found that we had a competitive advantage in the strength of our bed. Really, we are compelled to get the word out.” This marketing campaign is great because it shows customers how The Silverado is a superior truck compared to its competitors.
With the release of our new product, we are going to aim to continue the current positioning strategy that GM’s Chevrolet Brand has to offer. One way we plan to do this is to show Real Customers, Not Actors the abilities of the Silverado 2500 Workman. We would allow customers to push the button that triggers the autonomous hydraulic bed as well as allow them to use the winch and pull items into the bed. Chevy has already seen an increase in sales with their ad campaign and we believe the Workman will see great sales numbers when real customers are able to see it in action.
Strategy Execution:
Product
Goals:
Our main goal for the Chevrolet’s Silverado 2500 Workman is to be one of the most purchased specialty trucks in the market. We plan to first accomplish this goal by creating awareness of the product in order to gain market share within a year. Our next goal would be to ensure that our product is available in the regions where the product is selling the most. We eventually want this line to be in every Chevrolet dealership across the United States.
Our truck line is unlike anything else in the market, so establishing the credibility of the product is going to be our biggest challenge. Creating customer awareness through advertising is our primary focus. Going to car shows around the country and promoting our new product line are critical to the success of the line. Chevy has been targeting the same truck buyer for years. We are now offering a new design and structure that will continue control of the market. We will also ensure that the quality of our trucks hydraulic system and winch are up to Chevrolet’s standards.
Processes:
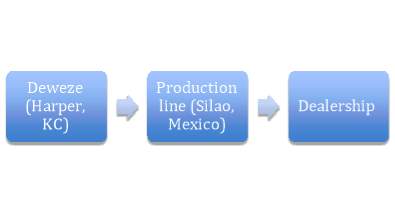
Our product is going to go through two steps throughout its process. In the first year, we are going to outsource our hydraulic beds and winch from Deweze to save money on factory expenses. Deweze is a company that specializes in the production of hydraulic beds. After we are going to ship the bed to the plant and apply it to the line. If the line continues to sell after the first year we are going to allocate space in our plant to manufacture the bed in the house. Manufacturing in-house will save cost on outsources, yet restructure the plant for the new bed is going to be an expense. That is why we are using the first year as a trial period.
Outsourced Components:
In order to manufacturer the Chevrolet Silverado 2500 Workman we are going to outsource components. During the first year of production we are outsourcing the entire truck bed from Deweze in Harper, KS. Deweze is experts in the hydraulic truck bed industry. Following the first year of product, we are going to need to outsource a number of components from different suppliers. The main outsourced components include: a hydraulic cylinder pump, steel/ piping, electrical parts, and hardware. We are going to acquire these from General Motors list of suppliers and use the one that offers the best quality for the lowest price. It is important that the outsourced material is high quality.
Life Cycle Stage:
Our product is currently in the introduction stage of the production life cycle. The truck industry is a competitive market, yet it is growing. Our new product is going to require a number of promotional activities such as advertising and car shows. Creating awareness our of the new line is going to be critical. We have seen similar success in Ram’s Outdoorsman Model. This is a specialty truck that entered the market in the same position as our Workman and has proven success.
Complementary Services/Warranties
Our new product line will have the same warranty as the Silverado 2500. This includes but is not limited to: powertrain limited warranty for the first 5 years or 60,000 miles (whichever comes first), sheet metal coverage, 3 years/36,000 miles limited warranty coverage, component warrant, and engine. This is a standard warranty of Chevy vehicles. This will help insure that our customers are protected and we are delivering the highest quality trucks possible.
Place
Goals:
In order for our new model of the Silverado to be successful and sell in great quantity, we need to expand the company’s existing channels to be able to handle an additional product being added to General Motors vast portfolio. Our primary goals we want to achieve with our distribution are recognizing the needs of our operation, which are that of an intensive retail channel of distribution. The market characteristics of General Motors are widespread. We believe that by having more direct channels and initially focusing on delivering our product to specific locations that have a high number of Silverado sales. Our second goal is to make sure we have good communication from top to bottom, from GM to Chevrolet to the individual dealerships selling the workman. Making sure that correct information is being conveyed between the different levels is paramount to maintaining high efficiency and delivering a great product. Our third goal is to ensure that our customers are getting the same quality of products every time. Making sure our process stays consistent will allow us to ensure our customers get a perfect vehicle every time they purchase a Chevy Silverado 2500 Workman.
Supply Chain System
Our supply chain is built on strong, transparent and trusted partnerships are critical to ensuring product quality, availability, and affordability for our customers. These partnerships help us to improve our business competitiveness and lower business risks as well as eliminate waste from value streams and deliver defect-free vehicles. We use a Strategic Supplier Engagement (SSE) program, which is robust and transparent communication process that improves information sharing with suppliers. We also use a Strategic Sourcing Process (SSP), which is a sourcing model tool that helps us frontload suppliers early in the vehicles development process to enable input into design and cost elements of production. We are also focusing on using our existing supplier available to buy the components necessary for production.
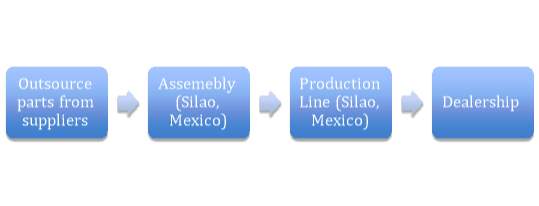
Localization is important to GM and we prefer to build where we sell and buy where we build. This enables our vehicles to be more competitive because they’re built to suit unique local requirements and conditions that drive customer enthusiasm and brand loyalty. In North America, it is estimated that 70 to 80 percent of procurement is sourced locally. Because our target market is mainly going to be in Texas and California for the first year due to them being the leader in truck sales we will be manufacturing the Workman in the Silao Assembly Plant in Mexico for the first year then also have production take place in the Flint Assembly Plant when we go nationwide in 3 – 5 years. The Silao and Flint plants both already manufacture the Silverado, so it would be efficient just to have an extension to the assembly line that would be able to add on the hydraulic bed onto the standard Silverado 2500 body.
Promotion
General Motors, as well as all their brands, have a rich history when it comes to promotion and advertising and our team plans to keep it that way with the launch of our new product. Our goals in terms of promotion for this new product is to generate high demand for the product before it is released; then transition to keeping the excitement high and customers interested with our competitive marketing strategy. We hope that this will lead to a strong first month in terms of sales and revenue. Last year, Chevrolet introduced the “Real People, Not Actors” campaign where they show actual customers what their vehicles have to offer and use the positive customer reaction as the driving force behind the advertisement. Our main focus is going to be showing the customer just what the Silverado Workman can do and we believe we can implement this focus in the “Real People, Not Actors” commercials by performing live demos of the autonomous truck bed in action. After first introducing the product, it will then join the family of all GM vehicles. This will hopefully generate additional excitement about the introduction of the new product and help them with their revenue for when it is time for launch.
Because we are targeting truck owners who engage in manual labor or recreational activities that require things to be loaded into the bed it is important to market through various channels. Our first Ad will air during the start of the summer seasons in Texas and California because that time is prime for all kinds of work and leisure such as construction, landscaping, and vacations. This commercial will have customers who are real people and not actors who engage in work or leisure in their daily life that requires them to put things into their truck bed. We will have these people put things into a Regular Silverado and will be able to show how much effort it takes. Next, we will roll out the Workman and hand the consumers a key fob, which will be able to activate the autonomous hydraulic bed This will let their viewers feel a sense shock and awe. We will then allow the customers to once again put the thing into the truck bed but this time our audience will see the ease and efficiency that the Workman provides. We want to air these ads during timeslots that will be airing sports programming at the same time. We believe that people who watch sports also fit into our target market, which will drive the demand for our product upward. Our main concern is whether or not the customers will enjoy and buy our product but our team is certain that with all the promotions and advertisements that the product will be a great hit.
Price
Goals:
Setting a price for this new product line in an existing market is very important if we want our Chevrolet Silverado 2500 Workman to be successful. The goal for setting our price will be able to ensure that our product is affordable for the blue collar/ manual labor working man while showing the benefits of having a truck with these perks. With this being said it is going to be difficult to set a price near the range of the standard Silverado 2500 because of the extensions increasing costs. However, Ram was able to accomplish show the benefits of having a truck with new features with the Outdoor man truck.
We want to set a price where our customers feel like they paid for a premium vehicle at a fair price. One of our main goals will be to set a price that is above the break-even point, is affordable to our target market, and use materials that are durable. The price will not be too far above the standard Silverado 2500 because this will decrease the interest for the truck. We are focusing the price around the trucks features, while not getting too far away from the standard price. In the future, we will be able to make the process in the plant more efficient and decrease on logistical costs. This will increase our profit margin, while the truck remains at the same price.
Value Proposition:
Chevrolet trucks rank third in the U.S. in sales amongst all pickup trucks. This shows that customers all over the country value trucks made by Chevy. What makes Chevy trucks standout from the competitors is the affordability and quality. We are going to add to the quality of Chevy’s trucks with our new line. Until our product, there was no way to easily dump dirt, hay, mulch, etc. With the simple push of a button, the truck bed will lift and dump whatever contents are in the truck. With the release of our new product line, customers are now able to do this or safely pull snow blowers or lawn mowers easily using the winch. This is a unique feature that no other competitor offers. Chevrolet’s affordability, quality, and now unique features are its strongest selling points. Not only does this separate us from the competition it also provides convince to the consumer and strengthens Chevrolets brand.
Price Sensitivity:
Our current price of $49,999 for the Chevrolet Silverado 2500 Workman is well within the range consumer will pay for the truck. The truck market is growing and the decrease in fuel costs justifies the purchase. Typically consumers are willing to spend the extra money on truck add-ons. The automotive industry has already created this idea of pre-loaded vehicles, which are installed on the car before customers set foot on the lot. Our product is a pre-loaded vehicle. Pre-loaded vehicles are a strategic way to sell features that the consumer may never even need. Customers buying a car will most likely add some type of feature to the vehicle or buy a pre-loaded.
The pre-loaded vehicle idea is the right way for us to market our product, yet the level of sensitivity is very high. High-priced products, like trucks, are usually more price sensitive. This is because they take up a large percentage of the buyer’s budget. We have focused our products pricing on adhering to the sensitivity of the market by promoting the core benefits. Focusing on the benefits of having a truck with a hydraulic lift and a winch will make the customer less price-conscious.
Short Term Pricing Strategy:
Our short term pricing strategy will be a variation price skimming. Our price of $49,999 for the Silverado 2500 Workman is slightly more than Ram’s Outdoorsman 1500 starting price at $42,895. The reason we have priced it higher than the Outdoorsman is that having a hydraulic bed and a winch offers much more than the Outdoorsman’s features and the Silverado is 2500, not 1500. It is not exactly price skimming because our product is still very close in relation to the Outdoorsman. Starting the price at an attractive $49,000 offers customers an incentive to spend a small percentage more in order to gain the benefits. This will also give us an idea about the trucks demand and obtain our pricing goal.
Long Term Pricing Strategy:
With our product being in the introduction stage, our long-term goal is to be able to slightly increase the price. We hope to be able to decrease our costs in production when we begin to manufacture the truck bed in house. This will, in turn, give us better profit margins. The lower per unit cost will make up for any losses suffered through outsourcing the truck bed. Also since we are in the introduction stage of production we may face competition in the future. That is why lowering the cost of production, yet price remaining the same is critical. We will be able to offer the same concept at the same or lower price while maintaining a low per unit cost. This long-term pricing strategy will establish our product in the market and beat the competition.
Break Even Analysis:
We are going to look at the break-even point for manufacturing the truck bed through Chevrolet’s plants. To find the breakeven point for our product we must first consider the fixed capital expenditures. For example, we will need to pay for the trucks to move the supplies to Chevrolet’s plant in Mexico and we may need to acquire new machinery to help the current plant account for the extra capacity. To estimate the fixed cost we look at General Motors fixed capital expenditures in 2016. In the past year, General Motors spent around 29.2 billon dollars in fixed asset capital expenditures in 2016 (21). When looking at General Motors we can see that they generated 166.38 billion dollars in sales revenue for 2016. The Chevrolet Silverado 2500 generated approximately 4.28 billion of that revenue. That is approximately 2.56 percent of the revenue generated for General Motors in Chevrolet Silverado trucks.
In order to find our fixed capital expenditure for our new truck line, we will take 2.56 percent of the 29.2 billon dollar investment to find the capital expenditures on Chevy Silverado 2500’s, which is around 747.5 million dollars. To find the break-even point we divided it by the contribution margin of General Motors products, which is about 93 percent (21). This gets you approximately 803.8 million dollars divided by the $49,999 selling price of our unit and we get about 16,076 units we must sell to make a profit. According to our sales forecast, we are projected to sell around 29,405 units, which is a surplus of 13,328 units.
Capital Budget Analysis
| Capital Budgeting Analysis | |||||||
| Base | Best | Worst | Price Increase | Price Decreases | Units Increase | Units Decrease | |
| NPV | 135,174,409 | 618,185,238 | (263,585,369) | 150,878,762 | 119,470,056 | 109,419,780 | (38,986,705) |
| Profitability Index | 1.20 | 1.91 | 0.61 | 1.12 | 1.18 | 1.15 | 0.94 |
| IRR | 11% | 32% | -10% | 11% | 11% | 10% | 3% |
| Payback Period | 3.85 | 2.49 | 7.40 | 3.38 | 3.88 | 3.91 | 4.47 |
| Accept/ Reject Project | ACCEPT | ACCEPT | DECLINE | ACCEPT | ACCEPT | ACCEPT | DECLINE |
We were able to find General Motors weighted average cost of capital to be 7.2 percent (14). This is the rate that a company is expected to pay on average to all its security holders to finance its assets.
Implementations and Control
Time Implementation Activities
In order to maximize profit, it is important that General Motors releases our new product at the right time. Full size pick-up trucks are not considered cyclical, and sell the most when gas prices are the lowest. Consumers tend to view full size pick-up trucks as gas guzzling which is an added expense in their eyes. For the target market we want to penetrate, it will be best that we release our new edition of truck during the month of April. When researching sales numbers between General Motors and Ford we found that April was the second highest month for truck sales, followed by May being the fourth highest, and June being the third highest month for truck sales. This is important because for our product to have the most impact on our target market it needs to be warm. Our target market consists of blue-collar people who engage in physical work. These industries are the busiest when it’s warm out, whether it’s moving gravel, transporting heavy equipment, or landscaping work. By releasing our new edition in April, it also allows time for our marketing to spread and for consumers to hear about our new edition of truck at a time when they would get the most value out of it for their job. This is coincidentally also during the highest truck revenue months of the year. If we release our product during late summer months, by the time our marketing has reached our target market effectively it will be out of season for the work that they do and we won’t gain the maximum profit from our endeavor.
Forecast Estimates Supply Chain and Logistics
To ensure that we keep our expenses under control when producing our new product, it’s important that we find the most efficient and cost effective way to buy our materials and ship them. Doing this allows our company to forecast estimates in our supply chain for material expenses and plan the logistical expenses to get our product where it will be most valued. This is significant to our company to forecast because in our first year the supply chain and logistics will be different from the strategy we enact in our following years.
In the first year of developing our Workman Edition truck we planned to outsource the entire hydraulic bed from a company called Deweze, located in Harper, Kansas. Deweze are experts in the hydraulic truck bed industry. We planned to outsource our winches from a reputable company in the aftermarket accessories industry called Smittybilt. Smittybilt sells quality aftermarket winches that will provide us with the performance that our customers are expecting from our Silverado brand. This will allow for us to keep our factory space on our production line while we test the market and allow our advertising and promotion strategies to gain traction.
After our first year of product development we plan on only outsourcing individual components. This will save us a substantial amount of expenses related to production. The main components that we will be purchasing from our suppliers consist of a hydraulic cylinder pump, steel/piping, electrical parts, and specific hardware. After researching market value prices for the materials needed we forecast that a hydraulic cylinder and pump will cost $380.00, steel/piping needed will cost $150.00, electrical switches and components will cost $70.00, and other hardware and miscellaneous parts needed will cost $150.00 per unit from our suppliers (34). To ship our purchased materials from our suppliers to our factory in Mexico we plan on it costing an additional $50.00 per unit. We plan to continue our relationship with Smittybilt, purchasing winches from their warehouses and shipping them directly to our factory in Silao, Mexico. To purchase their XRC 3.0 winch and have it shipped directly to our factory we forecast will cost $150.00 per unit. Once production of the hydraulic bed is complete and the winch is mounted, our Workman Edition truck is ready to be shipped back north to the United States. We plan to use our existing transportation including railways in Mexico to efficiently transport our vehicles and decrease logistic expenses. To ship our vehicle north it is estimated that it will cost us $900 per unit(1) bringing our total expenses to an additional $1700 per unit for this edition.
Forecasting Sales
To get our projected sales numbers we first took a look at the percentage of people who buy trucks compared to cars. We found that 18 percent of people purchase pickup trucks compared to other vehicles (24). Then we found that 39 percent of truck buyers use pickup trucks for working purpose rather than style. In 2016, there were 17.6 million new car purchases. We multiple this buy 18 percent to find the amount of pickup trucks sold. We then multiply this by 39 percent to find the amount of truck owners using it for working purpose. Next, we multiply this by 17.5 percent market share that the Chevrolet Silverado has in the pickup truck market. Then we multiply this by 13.6 percent, which is the percentage of Silverado 2500’s that were sold in 2016. This gets our sales projected units to 29,405. We multiply this by the selling price of 49,999 dollars and get our projected sales volume.
In order to find the percentage of growth we looked at the current Silverado sales. Sales of the Silverado have been up a steady 6 percent since 2008, so we believe this is the best indication of growth (29). To get our EBIT we look at General Motors financial statements and see that the average EBIT is around 10 percent of GM’s total revenue. They accredit this to new product launches, material, and other cost savings activities. Therefore, we can assume that this trend will continue for this product throughout the next 5 years. The rest of the accounts are found the same way, using General Motors financial statements. These are the numbers used to calculate the NPV, IRR, and the profitability index of our project and are the amounts we expect to sell.
Base Case
We found our projected sales from using the method described earlier in the sales forecasting. From Bloomberg, we found that General Motors total cost of goods sold was 82 percent of its revenue (32). We applied the 82 percent as our cost of goods sold. We also determined that operating expenses are around 7 percent of our sales (30). Our PPE represents our capital costs, which we divided into plant and equipment. This is used for the new product. We depreciated the equipment over 5 years with no salvage value to accommodate for the expected life of the machinery. We depreciated the plant over 39 years as the IRS suggests, leaving us with an after tax salvage value of 39,893,333 dollars. We got the interest expense by using General Motors interest expense and scaling it to our product, we helped us find net income. We determined to accept the project based on the results.
| General Motors Base Pro Forma | ||||||
| Year | 0 | 1 | 2 | 3 | 4 | 5 |
| Units of Sales (6% Growth) | 29,405 | 31,169 | 33,632 | 36,289 | 39,155 | |
| Total Sales | 1,470,220,595 | 1,558,433,831 | 1,681,550,103 | 1,814,392,561 | 1,957,729,574 | |
| Cost of Goods Sold | 1,205,580,888 | 1,277,915,741 | 1,378,871,085 | 1,487,801,900 | 1,605,338,251 | |
| Gross Profit | 264,639,707 | 280,518,090 | 302,679,019 | 326,590,661 | 352,391,323 | |
| Operating Expenses (7%) | 18,524,779 | 19,636,266 | 21,187,531 | 22,861,346 | 24,667,393 | |
| PPE (Total) | 70,400,000 | 70,400,000 | 70,400,000 | 70,400,000 | 70,400,000 | |
| Depreciation (Equipment 35%) | 4,928,000 | 4,928,000 | 4,928,000 | 4,928,000 | 4,928,000 | |
| Depreciation (Plant at 65%) | 1,173,333 | 1,173,333 | 1,173,333 | 1,173,333 | 1,173,333 | |
| Operating Income | 240,013,594 | 254,780,490 | 275,390,154 | 297,627,981 | 321,622,597 | |
| Interest Expense | 4,410,662 | 4,410,662 | 4,410,662 | 4,410,662 | 4,410,662 | |
| Pre-Tax Inc | 235,602,932 | 250,369,828 | 270,979,492 | 293,217,320 | 317,211,936 | |
| Taxes (35%) | 82,461,026 | 87,629,440 | 94,842,822 | 102,626,062 | 111,024,177 | |
| Net Income | 153,141,906 | 162,740,388 | 176,136,670 | 190,591,258 | 206,187,758 | |
| Working Capital | 612,052,834 | |||||
| Capital Costs | 70,400,000 | |||||
| Initial Costs | 682,452,834 | |||||
| Cash Flows | (682,452,834) | 163,653,901 | 173,252,383 | 186,648,665 | 201,103,253 | 216,699,753 |
| WACC | 7.3% | |||||
| Year | 1 | 2 | 3 | 4 | 5 | |
| PV of Cashflows | 142,143,472 | 150,480,344 | 162,115,837 | 174,670,535 | 188,217,055 | |
| PV of Cashflows Total | 817,627,243 | |||||
| Initial Costs | 682,452,834 | |||||
| NPV | 135,174,409 | |||||
| Profitability Index | 1.20 | |||||
| IRR | 11% | |||||
| Payback Period | 3.85 | |||||
Best Case
| General Motors Best Case | ||||||
| Year | 0 | 1 | 2 | 3 | 4 | 5 |
| Units of Sales (6% Growth) | 29,405 | 31,169 | 33,632 | 36,289 | 39,155 | |
| Total Sales | 1,617,242,655 | 1,714,277,214 | 1,849,705,114 | 1,995,831,818 | 2,153,502,531 | |
| Cost of Goods Sold | 1,193,525,079 | 1,265,136,584 | 1,365,082,374 | 1,472,923,881 | 1,589,284,868 | |
| Gross Profit | 423,717,575 | 449,140,630 | 484,622,740 | 522,907,936 | 564,217,663 | |
| Operating Expenses (7%) | 29,660,230 | 31,439,844 | 33,923,592 | 36,603,556 | 39,495,236 | |
| PPE (Total) | 70,400,000 | 70,400,000 | 70,400,000 | 70,400,000 | 70,400,000 | |
| Depreciation (Equipment 35%) | 4,928,000 | 4,928,000 | 4,928,000 | 4,928,000 | 4,928,000 | |
| Depreciation (Plant at 65%) | 1,173,333 | 1,173,333 | 1,173,333 | 1,173,333 | 1,173,333 | |
| Operating Income | 387,956,012 | 411,599,453 | 444,597,815 | 480,203,047 | 518,621,093 | |
| Interest Expense | 4,851,728 | 4,851,728 | 4,851,728 | 4,851,728 | 4,851,728 | |
| Pre-Tax Inc | 383,104,284 | 406,747,725 | 439,746,087 | 475,351,319 | 513,769,365 | |
| Taxes (35%) | 134,086,499 | 142,361,704 | 153,911,130 | 166,372,962 | 179,819,278 | |
| Net Income | 249,017,785 | 264,386,021 | 285,834,956 | 308,978,358 | 333,950,088 | |
| Working Capital | 611,592,655 | |||||
| Capital Costs | 70,400,000 | |||||
| Initial Costs | 681,992,655 | |||||
| 25,399,897 | ||||||
| Cash Flows | (681,992,655) | 259,970,846 | 275,339,082 | 296,788,018 | 319,931,419 | 344,903,149 |
| WACC | 7.3% | |||||
| Year | 1 | 2 | 3 | 4 | 5 | |
| PV of Cashflows | 225,800,658 | 239,148,916 | 257,778,635 | 277,880,101 | 299,569,583 | |
| PV of Cashflows Total | 1,300,177,893 | |||||
| Initial Costs | 681,992,655 | |||||
| NPV | 618,185,238 | |||||
| Profitability Index | 1.91 | |||||
| IRR | 32% | |||||
| Payback Period | 2.49 |
We used the same methods as discussed in the base case for creating the essence of the base case pro forma. We applied We applied an increase of 10% to our total sales, and a decrease of 10% to our cost of goods sold. We found that our total present value of cash flows increased by 482,550,650 dollars. Based off the results of the pro forma as a whole, we would choose to accept the project.
Worst Case
| General Motors Worst Case | ||||||
| Year | 0 | 1 | 2 | 3 | 4 | 5 |
| Units of Sales (6% Growth) | 29,405 | 31,169 | 33,632 | 36,289 | 39,155 | |
| Total Sales | 1,323,198,536 | 1,402,590,448 | 1,513,395,093 | 1,632,953,305 | 1,761,956,616 | |
| Cost of Goods Sold | 1,193,525,079 | 1,265,136,584 | 1,365,082,374 | 1,472,923,881 | 1,589,284,868 | |
| Gross Profit | 129,673,456 | 137,453,864 | 148,312,719 | 160,029,424 | 172,671,748 | |
| Operating Expenses (7%) | 9,077,142 | 9,621,770 | 10,381,890 | 11,202,060 | 12,087,022 | |
| PPE (Total) | 70,400,000 | 70,400,000 | 70,400,000 | 70,400,000 | 70,400,000 | |
| Depreciation (Equipment 35%) | 4,928,000 | 4,928,000 | 4,928,000 | 4,928,000 | 4,928,000 | |
| Depreciation (Plant at 65%) | 1,173,333 | 1,173,333 | 1,173,333 | 1,173,333 | 1,173,333 | |
| Operating Income | 114,494,981 | 121,730,760 | 131,829,495 | 142,726,031 | 154,483,393 | |
| Interest Expense | 3,969,596 | 3,969,596 | 3,969,596 | 3,969,596 | 3,969,596 | |
| Pre-Tax Inc | 110,525,386 | 117,761,164 | 127,859,900 | 138,756,435 | 150,513,797 | |
| Taxes (35%) | 38,683,885 | 41,216,408 | 44,750,965 | 48,564,752 | 52,679,829 | |
| Net Income | 71,841,501 | 76,544,757 | 83,108,935 | 90,191,683 | 97,833,968 | |
| Working Capital | 601,301,110 | |||||
| Capital Costs | 70,400,000 | |||||
| Initial Costs | 671,701,110 | |||||
| 25,399,897 | ||||||
| Cash Flows | (671,701,110) | 81,912,430 | 86,615,686 | 93,179,864 | 100,262,612 | 107,904,897 |
| WACC | 7.3% | |||||
| Year | 1 | 2 | 3 | 4 | 5 | |
| PV of Cashflows | 71,145,980 | 75,231,047 | 80,932,439 | 87,084,241 | 93,722,035 | |
| PV of Cashflows Total | 408,115,741 | |||||
| Initial Costs | 671,701,110 | |||||
| NPV | (263,585,369) | |||||
| Profitability Index | 0.61 | |||||
| IRR | -10% | |||||
| Payback Period | 7.40 | |||||
We used the same methods as discussed in base case for creating the essence of the best case pro forma. . We applied a decrease of 10% to our total sales, and an increase of 10% to our cost of goods sold. We found that our total present value of cash flows decrease by 409,511,502 dollars. However based off the results of the pro-forma as a whole, we would choose to not accept the project
Sensitivity Analysis
Price Increase
| General Motors Price Increase | ||||||
| Year | 0 | 1 | 2 | 3 | 4 | 5 |
| Units of Sales (6% Growth) | 29,405 | 31,169 | 33,632 | 36,289 | 39,155 | |
| Total Sales | 1,587,840,595 | 1,683,111,031 | 1,816,076,802 | 1,959,546,869 | 2,114,351,072 | |
| Cost of Goods Sold | 1,302,029,288 | 1,380,151,045 | 1,489,182,978 | 1,606,828,433 | 1,733,767,879 | |
| Gross Profit | 285,811,307 | 302,959,986 | 326,893,824 | 352,718,437 | 380,583,193 | |
| Operating Expenses (7%) | 20,006,791 | 21,207,199 | 22,882,568 | 24,690,291 | 26,640,824 | |
| PPE (Total) | 70,400,000 | 70,400,000 | 70,400,000 | 70,400,000 | 70,400,000 | |
| Depreciation (Equipment 35%) | 4,928,000 | 4,928,000 | 4,928,000 | 4,928,000 | 4,928,000 | |
| Depreciation (Plant at 65%) | 1,173,333 | 1,173,333 | 1,173,333 | 1,173,333 | 1,173,333 | |
| Operating Income | 259,703,182 | 275,651,453 | 297,909,923 | 321,926,813 | 347,841,036 | |
| Interest Expense | 4,763,522 | 4,763,522 | 4,763,522 | 4,763,522 | 4,763,522 | |
| Pre-Tax Inc | 254,939,660 | 270,887,931 | 293,146,402 | 317,163,291 | 343,077,514 | |
| Taxes (35%) | 89,228,881 | 94,810,776 | 102,601,241 | 111,007,152 | 120,077,130 | |
| Net Income | 165,710,779 | 176,077,155 | 190,545,161 | 206,156,139 | 223,000,384 | |
| Working Capital | 661,018,040 | |||||
| Capital Costs | 70,400,000 | |||||
| Initial Costs | 731,418,040 | |||||
| 25,399,897 | ||||||
| Cash Flows | (731,418,040) | 176,575,634 | 186,942,011 | 201,410,016 | 217,020,994 | 233,865,239 |
| WACC | 7.3% | |||||
| Year | 1 | 2 | 3 | 4 | 5 | |
| PV of Cashflows | 153,366,791 | 162,370,626 | 174,936,978 | 188,496,072 | 203,126,334 | |
| PV of Cashflows Total | 882,296,802 | |||||
| Initial Costs | 731,418,040 | |||||
| NPV | 150,878,762 | |||||
| Profitability Index | 1.21 | |||||
| IRR | 11% | |||||
| Payback Period | 3.83 | |||||
We used the same methods as discussed in base case for creating the essence of the best case pro forma. We chose to increase the price of our product by 4,000 dollars, as we have found that competitors were within a 4,000 dollar price range of us for similar quality. We found that our total present value of cash flows increased by 64,669,559 dollars. Based off the results of the pro forma as a whole, we would choose to accept the project.
Price Decrease
| General Motors Price Decrease | ||||||
| Year | 0 | 1 | 2 | 3 | 4 | 5 |
| Units of Sales (6% Growth) | 29,405 | 31,169 | 33,632 | 36,289 | 39,155 | |
| Total Sales | 1,352,600,595 | 1,433,756,631 | 1,547,023,405 | 1,669,238,253 | 1,801,108,076 | |
| Cost of Goods Sold | 1,109,132,488 | 1,175,680,437 | 1,268,559,192 | 1,368,775,368 | 1,476,908,622 | |
| Gross Profit | 243,468,107 | 258,076,194 | 278,464,213 | 300,462,886 | 324,199,454 | |
| Operating Expenses (7%) | 17,042,767 | 18,065,334 | 19,492,495 | 21,032,402 | 22,693,962 | |
| PPE (Total) | 70,400,000 | 70,400,000 | 70,400,000 | 70,400,000 | 70,400,000 | |
| Depreciation (Equipment 35%) | 4,928,000 | 4,928,000 | 4,928,000 | 4,928,000 | 4,928,000 | |
| Depreciation (Plant at 65%) | 1,173,333 | 1,173,333 | 1,173,333 | 1,173,333 | 1,173,333 | |
| Operating Income | 220,324,006 | 233,909,527 | 252,870,385 | 273,329,150 | 295,404,159 | |
| Interest Expense | 4,057,802 | 4,057,802 | 4,057,802 | 4,057,802 | 4,057,802 | |
| Pre-Tax Inc | 216,266,204 | 229,851,725 | 248,812,583 | 269,271,349 | 291,346,357 | |
| Taxes (35%) | 75,693,172 | 80,448,104 | 87,084,404 | 94,244,972 | 101,971,225 | |
| Net Income | 140,573,033 | 149,403,621 | 161,728,179 | 175,026,377 | 189,375,132 | |
| Working Capital | 563,087,628 | |||||
| Capital Costs | 70,400,000 | |||||
| Initial Costs | 633,487,628 | |||||
| 25,399,897 | ||||||
| Cash Flows | (633,487,628) | 150,732,168 | 159,562,756 | 171,887,314 | 185,185,512 | 199,534,267 |
| WACC | 7.3% | |||||
| Year | 1 | 2 | 3 | 4 | 5 | |
| PV of Cashflows | 130,920,152 | 138,590,061 | 149,294,697 | 160,844,999 | 173,307,775 | |
| PV of Cashflows Total | 752,957,684 | |||||
| Initial Costs | 633,487,628 | |||||
| NPV | 119,470,056 | |||||
| Profitability Index | 1.18 | |||||
| IRR | 11% | |||||
| Payback Period | 3.88 | |||||
We used the same methods as discussed in base case for creating the essence of the best case pro forma. We chose to decrease the price of our product by 4,000 dollars. We found that our total present value of cash flows decreased by 64,669,559 dollars. Based off the results of the pro forma as a whole, we would choose to accept the project.
Units Increase
| General Motors Unit Increase | ||||||
| Year | 0 | 1 | 2 | 3 | 4 | 5 |
| Units of Sales (6% Growth) | 30,875 | 32,419 | 34,040 | 35,742 | 37,529 | |
| Total Sales | 1,543,719,125 | 1,620,905,081 | 1,701,950,335 | 1,787,047,852 | 1,876,400,245 | |
| Cost of Goods Sold | 1,265,849,683 | 1,329,142,167 | 1,395,599,275 | 1,465,379,239 | 1,538,648,201 | |
| Gross Profit | 277,869,443 | 291,762,915 | 306,351,060 | 321,668,613 | 337,752,044 | |
| Operating Expenses (7%) | 19,450,861 | 20,423,404 | 21,444,574 | 22,516,803 | 23,642,643 | |
| PPE (Total) | 70,400,000 | 70,400,000 | 70,400,000 | 70,400,000 | 70,400,000 | |
| Depreciation (Equipment 35%) | 4,928,000 | 4,928,000 | 4,928,000 | 4,928,000 | 4, ,928,000 | |
| Depreciation (Plant at 65%) | 1,173,333 | 1,173,333 | 1,173,333 | 1,173,333 | 1,173,333 | |
| Operating Income | 252,317,248 | 265,238,177 | 278,805,153 | 293,050,477 | 308,008,068 | |
| Interest Expense | 4,631,157 | 4,631,157 | 4,631,157 | 4,631,157 | 4,631,157 | |
| Pre-Tax Inc | 247,686,091 | 260,607,020 | 274,173,995 | 288,419,320 | 303,376,910 | |
| Taxes (35%) | 86,690,132 | 91,212,457 | 95,960,898 | 100,946,762 | 106,181,919 | |
| Net Income | 160,995,959 | 169,394,563 | 178,213,097 | 187,472,558 | 197,194,992 | |
| Working Captial | 642,650,272 | |||||
| Capital Costs | 70,400,000 | |||||
| Initial Costs | 713,050,272 | |||||
| 25,399,897 | ||||||
| Cash Flows | (713,050,272) | 171,728,450 | 180,127,054 | 188,945,588 | 198,205,049 | 207,927,482 |
| WACC | 7.3% | |||||
| – | ||||||
| Year | 1 | 2 | 3 | 4 | 5 | |
| PV of Cashflows | 149,156,713 | 156,451,417 | 164,110,856 | 172,153,267 | 180,597,798 | |
| PV of Cashflows Total | 822,470,052 | |||||
| Initial Costs | 713,050,272 | |||||
| NPV | 109,419,780 | |||||
| Profitability Index | 1.15 | |||||
| IRR | 10% | |||||
| Payback Period | 3.91 | |||||
We used the same methods as discussed in base case for creating the essence of the best case pro forma. We decided to increase our units of sales by 5% to see what the results would be had we underestimate the market for our product. We found that our total present value of cash flows increased by 4,842,809 dollars. Based off the results of the pro forma as a whole, we would choose to accept the project.
Unit Decreases
| General Motors Unit Increase | ||||||
| Year | 0 | 1 | 2 | 3 | 4 | 5 |
| Units of Sales (6% Growth) | 27,935 | 26,538 | 25,211 | 23,951 | 22,753 | |
| Total Sales | 1,396,722,065 | 1,326,885,962 | 1,260,541,664 | 1,197,514,580 | 1,137,638,851 | |
| Cost of Goods Sold | 1,145,312,093 | 1,088,046,489 | 1,033,644,164 | 981,961,956 | 932,863,858 | |
| Gross Profit | 251,409,972 | 238,839,473 | 226,897,499 | 215,552,624 | 204,774,993 | |
| Operating Expenses (7%) | 17,598,698 | 16,718,763 | 15,882,825 | 15,088,684 | 14,334,250 | |
| PPE (Total) | 70,400,000 | 70,400,000 | 70,400,000 | 70,400,000 | 70,400,000 | |
| Depreciation (Equipment 35%) | 4,928,000 | 4,928,000 | 4,928,000 | 4,928,000 | 4, ,928,000 | |
| Depreciation (Plant at 65%) | 1,173,333 | 1,173,333 | 1,173,333 | 1,173,333 | 1,173,333 | |
| Operating Income | 227,709,940 | 216,019,377 | 204,913,341 | 194,362,607 | 184,339,410 | |
| Interest Expense | 4,190,166 | 4,190,166 | 4,190,166 | 4,190,166 | 4,190,166 | |
| Pre-Tax Inc | 223,519,774 | 211,829,210 | 200,723,175 | 190,172,441 | 180,149,244 | |
| Taxes (35%) | 78,231,921 | 74,140,224 | 70,253,111 | 66,560,354 | 63,052,235 | |
| Net Income | 145,287,853 | 137,688,987 | 130,470,064 | 123,612,087 | 117,097,009 | |
| Working Capital | 581,455,396 | |||||
| Capital Costs | 70,400,000 | |||||
| Initial Costs | 651,855,396 | |||||
| 25,399,897 | ||||||
| Cash Flows | (651,855,396) | 155,579,353 | 147,980,486 | 140,761,563 | 133,903,586 | 127,388,508 |
| WACC | 7.3% | |||||
| Salvage Value (Plant) | – | |||||
| Year | 1 | 2 | 3 | 4 | 5 | |
| PV of Cashflows | 135,130,230 | 128,530,148 | 122,260,069 | 116,303,495 | 110,644,749 | |
| PV of Cashflows Total | 612,868,691 | |||||
| Initial Costs | 651,855,396 | |||||
| NPV | (38,986,705) | |||||
| Profitability Index | 0.94 | |||||
| IRR | 3% | |||||
| Payback Period | 4.47 | |||||
We used the same methods as discussed in base case for creating the essence of the best case pro forma. We decided to decrease our units of sales by 5% to see what the results would be had we underestimate the market for our product. We found that our total present value of cash flows decreased by 204,758,552 dollars. Based off the results of the pro forma as a whole, we would choose to decline the project.
Financial Analysis
Overall this project may be a good idea for General Motors. From the base case we had a positive NPV, IRR, and profitability index. Yet, we declined two scenarios during our analysis so this has the potential to lose money for General Motors. The payback period was within a decently reasonable period of time, with a maximum pay back of 7.40 years. These results show that the project is considered profitable, but involves a level of risk. Therefore, General Motors should justify this project.
Conclusion
After careful consideration of the products financial structure, supply chain, and marketing we have decided that accepting the project is in the best interest of General Motors. The product has a strong marketing structure, useful supply chain and logistics, and a decent financial analysis. Overall, the positive NPV, IRR, profitability index show that the company’s should accept. That is why we have decided to continue with the project for General Motors.
Sources
William Durant creates General Motors. (n.d.). Retrieved February 1, 2017, from http://www.history.com/this-day-in-history/william-durant-creates-general-motors (1)
Pai, P. (2016, October 23). Top 10 Largest Car Companies in the World. Retrieved February 1, 2017, from https://www.tharawat-magazine.com/facts/10-largest-car-companies/ (2)
General Motors Careers. (n.d.). Retrieved February 1, 2017, from http://careers.gm.com/gm-brands.html (3)
General Motors Careers. (n.d.). Retrieved February 3, 2017, from http://careers.gm.com/about-gm.html (4)
Jurevicius, O. (2013, September 14). General Motors mission statement 2013. Retrieved February 3, 2017, from https://www.strategicmanagementinsight.com/mission-statements/general-motors-mission-statement.html (5)
Why Do People Buy Pickup Trucks? (2009, September 12). Retrieved Feburary 3, 2017, from http://www.tundraheadquarters.com/blog/why-consumers-buy-pickup-trucks/ (6)
Jurevicius, O. (2016, December 08). General Motors SWOT analysis. Retrieved February 3, 2017, from https://www.strategicmanagementinsight.com/swot-analyses/general-motors-swot-analysis.html (7)
Leadership. (n.d.). Retrieved February 3, 2017, from https://www.gm.com/company/leadership/corporate-officers/mary-barra.html (8)
Corporate Strategy. (n.d.). Retrieved February 10, 2017, from https://www.gm.com/investors/corporate-strategy.html (9)
Burden, M. (2016, September 06). GM purchasing chief aims to improve supplier relations. Retrieved February 10, 2017, from http://www.detroitnews.com/story/business/autos/general-motors/2016/09/05/gm-purchasing-chief-aims-improve-supplier-relations/89898056/ (10)
Falter, R. (n.d.). GRIN – The effects of oligopoly in the US Automobile sector on pricing and development. Retrieved February 10, 2017, from http://www.grin.com/en/e-book/175388/the-effects-of-oligopoly-in-the-us-automobile-sector-on-pricing-and-development (11)
The reduced price / month applies to the entire contract duration. (n.d.). U.S. market share of automobile industry. Retrieved February 15, 2017, from https://www.statista.com/statistics/249375/us-market-share-of-selected-automobile-manufacturers/ (12)
${Instrument_CompanyName} ${Instrument_Ric} Company Profile. (n.d.). Retrieved February 15, 2017, from http://www.reuters.com/finance/stocks/companyProfile?symbol=F.N (13)
Strider, J. (2015, December 30). Ford Vs. Chevy: Comparing Business Models and Strategies (F, GM). Retrieved Feburary 20, 2017, from http://www.investopedia.com/articles/markets/123015/ford-vs-chevy-comparing-business-models-and-strategies-f-gm.asp (14)
Rowland, C. (2017, February 05). Ford Motor Company SWOT Analysis. Retrieved March 10, 2017, from http://panmore.com/ford-motor-company-swot-analysis (15)
News, B. (2013, August 05). Boomers most likely to buy cars marketed to Gen Y. Retrieved March 10, 2017, from http://www.newsday.com/classifieds/cars/car-buying-demographics-shift-as-baby-boomers-age-1.5832961 (16)
John Parker | Mar 15, 2016 1:36 pm EDT. (n.d.). Key Geographical Markets for General Motors. Retrieved March 20, 2017, from http://marketrealist.com/2016/03/key-geographical-markets-general-motors/ (17)
http://www.gurufocus.com/term/operatingmargin/F/Operating%252BMargin/Ford%2BMotor%2BCo (18)
Z. (n.d.). Chrysler SWOT Analysis | USP & Competitors | BrandGuide. Retrieved March 20, 2017, from http://www.mbaskool.com/brandguide/automobiles/4684-chrysler.html (19)
General Motors Co. (n.d.). Retrieved March 25, 2017, from http://www.marketwatch.com/investing/stock/gm/financials/cash-flow (20)
Akshay Singh, Evan Hirsh, John Jullens, Reid Wilk. (2016, March 15). 2016 Auto Industry Trends. Retrieved March 25, 2017, from https://www.strategyand.pwc.com/trends/2016-auto-industry-trends (21)
New Backup Camera Rule: Cameras Will Be Mandatory by 2018. (n.d.). Retrieved April 5, 2017, from http://www.autotrader.com/car-news/new-backup-camera-rule-cameras-will-be-mandatory-by-2018-223739 (22)
Going Deeper: 2016 Full-Size Pickup Sales Analysis. (n.d.). Retrieved April 5, 2017, from http://news.pickuptrucks.com/2017/02/going-deeper-2016-full-size-pickup-sales-analysis.html (23)
General Motors Co. (GM) | PV of FCFF. (n.d.). Retrieved April 10, 2017, from https://www.stock-analysis-on.net/NYSE/Company/General-Motors-Co/DCF/Present-Value-of-FCFF (24)
http://cta.ornl.gov/vtmarketreport/pdf/chapter3_heavy_trucks.pdf (25)
https://hedgescompany.com/automotive-market-research-statistics/auto-mailing-lists-and-marketing (26)
https://www.asee.org/documents/zones/zone1/2014/Student/PDFs/159.pdf (27)
https://www.gm.com/company/leadership/corporate-officers/mary-barra.html (28)
Chevrolet Launches Car Campaign You Never Expected. (2016, January 08). Retrieved April 15, 2017, from http://media.chevrolet.com/media/us/en/chevrolet/news.detail.html/content/Pages/news/us/en/2016/Jan/0108-campaign.html (29)
Sales. (n.d.). Retrieved April 15, 2017, from https://www.gm.com/investors/sales/us-sales-production.html (30)
Vlasic, B. (2017, February 13). Profitable Pickups May Be in Cross Hairs of Trump Border Tax. Retrieved April 15, 2017, from https://www.nytimes.com/2017/02/13/business/general-motors-mexico-pickups.html?_r=1 (31)
Mayeda, A. (2017, April 12). Trump Drops Campaign Promise to Label China a Currency Manipulator. Retrieved April 15, 2017, from https://www.bloomberg.com/politics/articles/2017-04-12/trump-says-u-s-will-not-label-china-a-currency-manipulator(32)
Brent Snavely, Gregory Korte and Todd Spangler. (2017, January 26). Trump’s 20% Mexican border tariff would impact auto industry. Retrieved April 15, 2017, from http://www.freep.com/story/money/cars/2017/01/26/trump-mexican-border-auto-industry/97105754/ (33)
Motoring in Mexico. (2016, October 28). Retrieved April 16, 2017, from http://www.automotivemanufacturingsolutions.com/focus/motoring-along-mexico (34)
Bloomberg LP 2017, Weighted Average Cost of Capital (35)
Cite This Work
To export a reference to this article please select a referencing stye below:
Related Services
View all


Related Content
All TagsContent relating to: "Business Analysis"
Business Analysis is a research discipline that looks to identify business needs and recommend solutions to problems within a business. Providing solutions to identified problems enables change management and may include changes to things such as systems, process, organisational structure etc.
Related Articles

DMCA / Removal Request
If you are the original writer of this dissertation and no longer wish to have your work published on the UKDiss.com website then please: