Features of Cyrene: Investigating the Presence of a Doublet in the IR Spectrum
Info: 19434 words (78 pages) Dissertation
Published: 22nd Dec 2021
Tagged: Sciences
1 INTRODUCTION
1.1 Aims of the work
This work examines some features of Cyrene, in particular, the investigation of the presence of a doublet in the IR spectrum in the absorption region of the carbonyl area. A preliminary study of Cyrene-water interaction was done through different technique in order to better understand the characteristic of this system in order to suggest a possible industrial application.
This work can be divided in two main themes:
Preliminary spectroscopic analysis of the Cyrene spectra: were analysed in particular the vibrational zone of the Carbonyl in order to explain the presence of a double band in this region. Many technique were used like mid IR in different temperature and Raman, and the study of the spectra was extended to the C-H vibrational zone, as well as abinitio calculation. Different models were presented in order to justify the experimental observation.
Analysis of Cyrene-water interaction: The system was investigated by 1HNMR and 13CNMR to analyse the behaviour of the Cyrene in solution. The ratio between the amount of geminal diol, Cyrene and free H2O in different solution concentration were calculate. Preliminary analysis like DSC, DLS, and SAXS, were performed, in order to characterise the solution behaviour, and possible application of such system was also suggested.
1.2 Green Chemistry
With the continuous increase in population and the consequent growing demand for consumer products, pharmaceuticals and personal care products, it has become essential to ensure economic and social development are sustainable.[1]{Gas-Phase, 2015 #1} Industrial process in fact require the use of solvents , is estimate an use of 20 millions of tons per year, many of these solvent are also volatile or toxic.[2]
The dispersion of these organic volatile compounds in the atmosphere is one of the major cause of pollution as well as the practice to burn solvent at end of life cycle. Many of them in fact contains nitrogen and sulfur heteroatoms that are known to lead to atmospheric pollution. With the purpose to find safer and more environmentally friendly solvents, chemists are developing new chemicals with high performance but low environmental impact using the green chemistry principles developed by Paul Anastas and John Warner.[3]Table 1.1
Table 1.1 shows the 12 principles of Green Chemistry
Prevention
It is better to prevent waste than to treat or clean up waste after it has been created.
Atom Economy
Synthetic methods should be designed to maximize the incorporation of all materials used in the process into the final product.
Less Hazardous Chemical Syntheses
Wherever practicable, synthetic methods should be designed to use and generate substances that possess little or no toxicity to human health and the environment.
Designing Safer Chemicals
Chemical products should be designed to affect their desired function while minimizing their toxicity.
Safer Solvents and Auxiliaries
The use of auxiliary substances (e.g., solvents, separation agents, etc.) should be made unnecessary wherever possible and innocuous when used.
Design for Energy Efficiency
Energy requirements of chemical processes should be recognized for their environmental and economic impacts and should be minimized. If possible, synthetic methods should be conducted at ambient temperature and pressure.
Use of Renewable Feedstocks
A raw material or feedstock should be renewable rather than depleting whenever technically and economically practicable.
Reduce Derivatives
Unnecessary derivatization (use of blocking groups, protection/ deprotection, temporary modification of physical/chemical processes) should be minimized or avoided if possible, because such steps require additional reagents and can generate waste.
Catalysis
Catalytic reagents (as selective as possible) are superior to stoichiometric reagents.
Design for Degradation
Chemical products should be designed so that at the end of their function they break down into innocuous degradation products and do not persist in the environment.
Real-time analysis for Pollution Prevention
Analytical methodologies need to be further developed to allow for real-time, in-process monitoring and control prior to the formation of hazardous substances.
Inherently Safer Chemistry for Accident Prevention
Substances and the form of a substance used in a chemical process should be chosen to minimize the potential for chemical accidents, including releases, explosions, and fires.
Among these principle used to suggest the choice, the develop and the use of more eco-friendly solvent there are parameter like toxicity or volatility and many others, but in general to determinate the eco sustainability of a solvent we have to consider the balance between its effectiveness in the considered chemical process, and the environmental effect through all the life cycle of the solvent. For this reason the interest of green chemistry for new alternative solvent such water, supercritical fluids, ionic liquids, is growing. Recent discoveries in green chemistry include, the development of sustainable solvents, which are low polluting, ease recyclable and produced from renewable sources. Many of these solvents maintain or enhance the performance compared to traditional solvents commonly used in industrial processes.[3]
Among these new solvents there is the dihydrolevoglucosenone (Cyrene), which already has shown promise as an alternative dipolar aprotic (Figure 1). [1] Cyrenes renewable nature, lack of mutagenicity, and easily of disposable makes it particularly attractive as solvent.[1]
1.3 Solvent properties
Solvents are use in order to assist in separation and transporting of materials in chemical process. It can stabilize an intermediate of reaction shifting the equilibrium, or simple through its chemical physical properties, like hydrogen bonding ability or boiling point, influence the yield of the process. Normally the solvent are used to dissolve chemicals, separate the reagents promoting their contact, the reason of this capability is in the formation of favourable interaction between solvent and solute, but both thermodynamic and kinetic consideration have to be take in account.[4]
The choice of the correct solvent is then decisive to promote a specific reaction or influence a chemical physical process. Of course it can not exist a green solvent that cover all the possible range of application, and its choice, is done in base of the necessity of a specific industrial process, normally is followed the rule “ like dissolve like”.
Molecules with a permanent dipole are call Dipolar, while the term Apolar should be used rarely to describe a solvent , because phenomena like polarizability have to be take in account.5[5]
We can distinguish also between aprotic solvent, whose molecular structure does not have a dissociable H+ hydrogen atom, and protic solvents that are capable to yield an H+.
Obviously, intermolecular solute/solvent interactions are of highly complicated nature and difficult to determine quantitatively.6[6]
Is well known that the position and intensity of absorption bands in Uv/vis, IR, NMR, and ESR spectroscopy, are solvent-dependent,7[7] these medium effects could depend from many causes , for instance the differential solvation of reactants and products rates of chemical reactions or the different physical absorption of electromagnetic radiation. The degree of this differential solvation depends mainly on the intermolecular forces between solute and surrounding solvent molecules.8[8],9
Nowadays are available many parameters to describe the principal characteristic of solvent. A general distinction between solvent it could be done measuring their polarity, even if could be better define it as solvation power of a solvent. In fact It depends on the balance of several factor like electrostatic, inductive, dispersive, charge-transfer and hydrogen bonding forces.5,10
Various physical and chemical properties like dielectric constant, electron pair acceptor and donor ability, and the ability to stabilize charge separation in an indicator dye, were used in order to describe correctly the polarity of solvents.5
Chemists have tried to understand solvent effects on chemical reactions in terms of the so-called solvent polarity. Hildebrand’s solubility parameter (δ) that provides a numerical estimate of the degree of interaction between materials, and can be a good indication of solubility, it is normally express in the ENT scale were 0.0 is for tetramethylsilane and 1.0 for water.
1.4 Cyrene as solvent
Dihydrolevoglucosenone (Cyrene) is a new dipolar aprotic solvent, (figure 1.1) It can be synthesised in two simple steps from biomass, thus ensuring a low environmental footprint, as well as improving its economic viability.1The pure compound is obtained by simple hydrogenation of the levoglucosenone (Scheme 1.1). 11
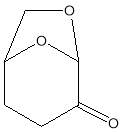
Figure 1.1. Structure of Cyrene
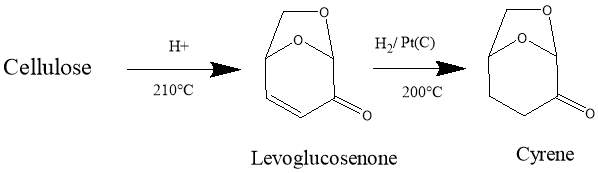
Scheme 1.1. the figure shows the steps for the synthesis of Cyrene from Biomass
As told before numerous parameter are used to characterize the property of a solvent. Among these the most important for Cyrene are reported in table 1.2. . The Kamlet–Abboud–Taft parameters for Cyrene indicate that this solvent is aprotic, the hydrogen bond donor (HBD) ability α is in fact equal to zero. Cyrene shows a similar π* value ,corresponding a measure of general polarity or polarizability (excluding hydrogen bonding effects), to those of highly dipolar aprotic solvents, but with a slightly lower β value which is an indicator of hydrogen bond accepting ability.1 In table 1.2. are also reported the value of Hildebrand solubility parameter, which define a solvent affinity to solve a solute. A solute is soluble in solvents which have a similar solubility parameter.12
It is possible, locate a solvent in the ‘‘Hansen space’’, a threedimensional representation of dispersion (δd), polar (δp) and hydrogen bonding (δh) interactions. Two solvents that are close in the Hansen space, exhibit similar solubilising properties. Considering this parameter the closest solvent in the Hansen space is NMP (N-Methyl-2-pyrrolidone). 1 Although Cyrene has a high boiling point (about 2030-2100C) which makes it less suitable to be removed by evaporation from the reaction environments, thanks to its characteristics , shown above, it is an interesting dipolar aprotic solvent.1
Table 1.2. Kamlet-Abboud-Taft parameter for Cyrene
| Cyrene | NMP | Cycloehanone | ||
 |
0,333 | 0,355 | 0,281 | |
| α | 0,00 | 0,00 | 0,00 | |
| β | O,61 | 0,75 | 0,58 | |
| Π* | 0,93 | 0,90 | 0,71 | |
| δD/MPa0,5 | 18,8 | 18,0 | 17,8 | |
| δp/MPa0,5 | 10,6 | 12,3 | 6,3 | |
| δH/MPa0,5 | 6,9 | 7,2 | 5,1 | |
Cyrene shows the unique spectroscopic features previously not reported in the published literature for this molecule. This study has been complicated by not only the unusual behaviour of this molecule, but also from the limited literature available exploring its properties. As you can see from figure 1.1, the structural characteristics of Cyrene include a carbonyl group and an acetal group in a completely asymmetric cyclic molecule (it belongs in fact to C1 group),13,14 one of consequence of this characteristic is the possible presence in IR or Raman spectra of bands resulting from resonance phenomena. One of these bands could be due to the presence of a Fermi resonance.
1.5 Fermi resonance
One of the assumptions that was immediately investigated, in order to justify the presence of a doublet band in the vibrational region of the carbonyl group in the Cyrene spectra, was the possible presence of a Fermi resonance.
The IR spectroscopy is an analytical technique which based on the interaction between the electromagnetic radiation and matter. The IR spectroscopy is a type of Vibration spectroscopy technique, in fact when an organic molecule is invested by an Infrared radiation whose frequency is comprised between 10,000 and 100 cm-1, the energy transferred from the radiation is converted in vibrational energy.
In a spectrometer the molecule is irradiated with a whole range of infrared frequencies but they are capable of absorbing radiation energy only at certain specific frequencies which match the natural vibrational frequencies of the molecule, namely in the infrared region of the electromagnetic spectrum.
Although the infrared spectra of polyatomic molecules involve vibrational transitions along with rotational transitions, the peaks in the infrared spectrum could be assigned as a fundamental vibrational transition only , especially in the case of low-resolution spectra of polyatomic molecules, were, the rotational fine structure is lost because to the intermolecular interactions. In a real IR spectra, the motion of nuclei cannot be isolated from the motion of other closely surrounding nuclei in the molecule, and for this reason, the characteristic absorption of a particular functional group in a molecule can be assigned only to a range of characteristic frequencies in the infrared spectrum.
Hence, in the low-resolution IR spectrum the frequencies bands, in first approximation, is due to a vibrational transition only. 15
The vibrational spectroscopy has as objective the analysis of molecular vibrational transitions between different states. To do that is necessary to know the manner in which the energy levels are organized, and which the allowed transitions are in a considerate system. In order to analyze the vibrations of a molecule, it is helpful to determine the number of degrees of freedom available to vibration.
“To represent the movement in the space of a molecule consisting of N atoms, we need to use 3N coordinates. These coordinate represents the 3N degrees of freedom necessary to describe the translational motion, rotational and vibrational mode in a molecule. To describe the translational motion of a molecule, that could be identifies with the movement of his center of gravity in the space, we need three coordinates. To describe its rotational motion and the orientation in the space, we need to use two or three coordinates, depending on whether the molecule is linear or nonlinear. The vibration motion concerns the reciprocal displacement of the atoms in the molecule. The degrees of vibrational freedom are equal to the difference between the total degrees of freedom and the sum of those rotational and translational 3N- (3 + 2) or 3N- (3 + 3), depending on whether the molecule is linear or not. These also are the normal modes of vibration of the molecule. The normal coordinates correspond to the actual vibrational modes that the molecule will undergo.”16
Often it can be helpful to use another coordinate system to describe the vibrational motion of a molecule, called internal coordinates, that is comprised of bond and angles.15
In a molecule, it is possible distinguish between different type of vibration movements; the Vibration stretching indicated with the letter ν, in which we have a modification in the length of the bonds , can be of two types, symmetrical and asymmetric. In the symmetrical Stretching the bonds are longer or shorter at the same time, while in the asymmetric stretching a bond is extended, an another is shortened at the same time ;
The vibration bending (δ) is another type of vibration in which we have a change the bond angles. We can distinguish four species of bending in which are possible different movements of the atoms relative to the plane that them it contains: 15
- Rocking
- Scissoring
- Twisting
- Wagging
The vibrations of a molecule set up a potential called force field,and the simplest force field model is the harmonic oscillator.
To describe the energetic vibrational state of a molecule we need to solve the Schrödinger equation for the system considered.
For instance, if one considers the simplest force field model, the harmonic oscillator, defined as a diatomic molecule. (see figure 1.2)
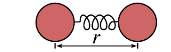
Figure1.2
In which the form of the potential energy it could be wrote as a series of Taylor we can write:17
V(x) =V(0)+ (
dVdx
)₀ x +
12
(
d2 vdx2
)₀ x2
x= r-re
Where re is the bond length at a minimum of potential energy of a molecule. The first two terms are equal to 0 and the remaining term could be interpreted as a force constant. Then the harmonic approximation for the potential energy will be:
V(R)=
12
Kx2 K= (
d2 vdx2
)₀
And the curve of the potential energy is described from a parabola. The introduction of this form of potential energy in the Schrödinger equation give 18
-ħ22μ d2ψdx2
+
12
Kx2 = E
Where
μ =
m1 m2 m1+m2
and the solution of the Schrödinger equation (converting in wave number cm-1) is: 19
G(v)=
v+12
ν̃
Where
ν̃ =
12πc Kμ 12
=
ω2πc
ω=
Kμ 12
v is the vibrational quantum number and can have only integer values 0,1,2,3… where the state at
v=0
corresponde to the ground-state of vibrational energy.
From this expression we can see that the energetic level of a harmonic oscillator are uniformly separate from one to other. In reality, the harmonic oscillator model is an approximation, the real molecules do not obey at Hooke’s law. It follows that the power of recall nuclei is not proportional to their displacement, especially in large amplitudes of vibration. Moreover this model does not consider the breaking of the bond and the repulsion between the nuclei. A model more appropriate use the equation of Morse, an empirical expression to describe the form of the potential energy for the molecular vibrations, that is:20,21
V(x)= De
1De-ax
2
where De is the dissociation energy and a is a constant for a particular molecule.
When this equation is used to solve the Schrödinger equation, the shape of the vibrational energy levels became:
G(ν)=
ν+12
ν̃ ̶
ν+122
ν̃ xe
Where
xe =
a2ħ2μω
=
ν̃ 4De
and Xe represent an anharmonicity constant for bond stretching vibration, and ν̃ is the oscillation frequency. One result of the use of this form of potential is, when v increase, the different vibrational levels become closely together. ( figure 1.3 )22
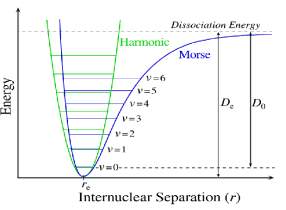
Figure 1.3 shows the trend of the Morse potential compared with the one for the pure harmonic model
For non-diatomic molecules where are possible different vibration mode, in fact in diatomic molecule only the stretching in the direction of the bond is possible, it is convenient define 3N-6 displacement coordinates Ri, that is the minimum number necessary to describe the changes of nuclear configuration. It must be underline that the real bonds in the molecules are not elastic and it is always present a certain grade of anharmonicity. One of the effects of the anharmonicity is that normal vibrations are mixed, and the energy levels are perturbed from their harmonic position by anharmonicity. Taking into account the anharmonicity, the potential energy of such system is given by: 23
V=
12!
∑i,jfi,j RiRj
+
13! ∑i,j,kfi,j,k RiRjRk
+
14! ∑i,j,k,lfi,j,k,l RiRjRkRl
+…….
The first term in the potential is the quadratic term of the harmonic force field. The second and third terms correspond to cubic and quartic contributions to the force field. The solution of the Schrödinger equation for a molecule in which all vibrations are not degenerative gives:
∑iG(Vi)
=
∑iν̃ νi+12
+
∑i≤jxij νi+12 νj+12+
…….
Not all the vibration are active in IR. For the harmonic model, it was found that the quantum number changes by one, but also the dipole moment of the molecule must change in the course of an allowed transition. Therefore, a particular vibrational mode of a polyatomic molecule will be active in the infrared, if the molecule’s dipole change in a normal mode vibration.
Classically the dipole moment of a molecule is determined as follows:
μx
=
∑iqixi
μy
=
∑iqixy
μz
=
∑iqixz
where all atoms are considered to have a partial charge, and atoms that are chemically equivalent are assumed to have the same charge. The displacement of the atoms in a normal mode of vibration is then considered if there is a change in the dipole moment of the molecule. Therefore the symmetry of molecules have a fundamental importance in the description of the spectroscopic phenomena, because the possible IR and also Raman active bands in the spectra depends from the symmetry of the molecule.24Nevertheless to understand a Fermi resonance phenomena, whose study is object of this thesis, is not necessary to deepen in to the description of group theory;
Therefore, we need only to remember few elementary principles.
For all the allowed transition, the vector dipolar moment must be:
μ =
∫ψf* μ̂ ψi
d
τ
and ∆ν = ±1
where
ψf*
is the wave function of a final state of transition and
ψi
is the wave function of the initial state of the transition and the vibrational quantum number have to change of one unity.
1.6 Selection rules and types of transitions
The general selection rules states that a vibrational transition is active in the IR if there is a variation of the electric dipole moment of the molecule during vibration and that the vibrational transitions are permitted for ∆ν= ± 1,± 2, ± 3, …
The fundamental transitions are those that take place between the ground state and the vibrational first excited level (v=0 ⟶ν = 1). The corresponding band is called fundamental band and is usually a strong.
The transition from the ground state to the excited state ν= 2 is called second harmonic, the transition between the ground state and the excited state ν = 3 is the third harmonic, and so on, the corresponding bands are called first overtone, second overtone, etc.
The intensity of these bands is much lower than the fundamental bands and becomes weaker with the increasing quantum number of the excited arrival level.
Another type of transition is that which occurs from one excited vibrational state to another excited vibrational state with higher energy. This type of transition is called “hot transition” and the corresponding band is called “hot band”.
Until now we have considered that the IR spectra are due to vibration of molecule, but the molecular spectra are complicated by the presence of rotation and degenerated levels. Given the symmetry of molecules and the anharmonicity of bonds, and the other phenomena already discussed, in the IR spectra are present other kind of bands. 25
These bands are called combination bands and derive from the transitions between a fundamental state and a state where more normal modes are excited. Even in this case, the resulting bands are significantly weaker than the related fundamental bands.
As shown before, one of the effects of the anharmonicity is that normal vibrations are mixed, and the energy levels are perturbed from their harmonic position by anharmonicity. All the perturbation is rigidly restricted by symmetry, in fact only levels with the same symmetry can perturb each other.
In the polyatomic molecule it may happen that two vibrational levels belonging to different vibrations or at combination of vibrations with the same symmetry and nearly the same energy may give rise to an unusually large perturbation.
If such perturbation, involve a fundamental band and an overtone or a combination of bands, is called Fermi resonance in honor of the physicist that discovered this phenomena for the first time in the spectra of the CO2 molecule. The Fermi resonance is a kind of anharmonic resonance and is named of type one if involve a fundamental and an overtone band, and of type two if involve a fundamental and a combination of bands. The quantum mechanics effect of this interaction is that the two energy levels repel each other and the upper one in energy is pushed at highest energy and the lower in energy is pushed down.26
The macroscopic effect of this interaction is shown in the IR spectra (but also in the Raman spectra) as a doublet band in a region where only one band is expected. Normally the fundamental band has the stronger intensity and is at highest energy where the other peak due to an overtone or combination of bands is smaller and it is at lower energy. Is usually convenient investigate about the nature of this interaction using the Perturbation theory.27
The magnitude of perturbation between two energy levels in fact depends on the value of the matrix element Wi,j of perturbation function W:
Wi,j =
∫ψi0
Ŵ
ψj0*
d
τ
Where the
ψi0
and
ψj0
are the zero approximation eigenfunctions of the two vibrational level that perturb each other.28
The magnitude of the shift between levels can be obtained applying the first order perturbation theory. For instance, considering the case of two levels with unperturbed energies
Ei0
and
Ej0
, and ∆E is the shift of the levels, is possible write the follow secular determinant
Ei0-∆EWWEj0-∆E
Solving the determinant we have:
∆E=
(Ei0+Ej0)/2
±
4W2 +δ212
/2
Where δ is the energy of separation
Ei0
–
Ej0
of the unperturbed level. If δ is large compared with 2W, namely, when the levels are well separated, the equation became:
∆E≈
(Ei0+Ej0)/2
±
δ2+W2δ
In the case of the Fermi resonance the wave function
ψi
and
ψj
of perturbed state are a linear combination of the wave function
ψi0
and
ψj0
ψi=aψi0-bψj0
ψj0
=b
ψi0+aψj0
Where a and b are numerical coefficients.29
It should be stressed that in many cases , as for instance in the C02 spectra , one of the effects of a strong mixing of the vibrational levels is that , the Raman spectrum may shows bands with the similar intensity of IR bands involved in Fermi resonance.30
In the light of the above considerations, it is possible, in principle, obtain from the IR spectra all the information necessary to calculate the Fermi coupling constant that can give us the proof of the existence in the our spectra of the Fermi resonance that involve the fundamental vibration of the carbonyl.
2 A first look to the spectroscopic properties of Cyrene
2.1 Characterisation of the sample and some spectroscopic considerations about Cyrene
Initial analysis was used to verify the structure of the Cyrene molecule and ascertain the purity of the substance provided by the chemical manufacturer (CIRCA). 1H NMR and 13C NMR analysis, were performed at room temperature on the double distilled Cyrene in CDCl3 as solvent. As we can see from the figures 2.1 and 2.2 there are no presence of signals which encourages us to think that the samples do not conform to the specifications and declarations of the company provided in an attachment with the sample.(See appendix)
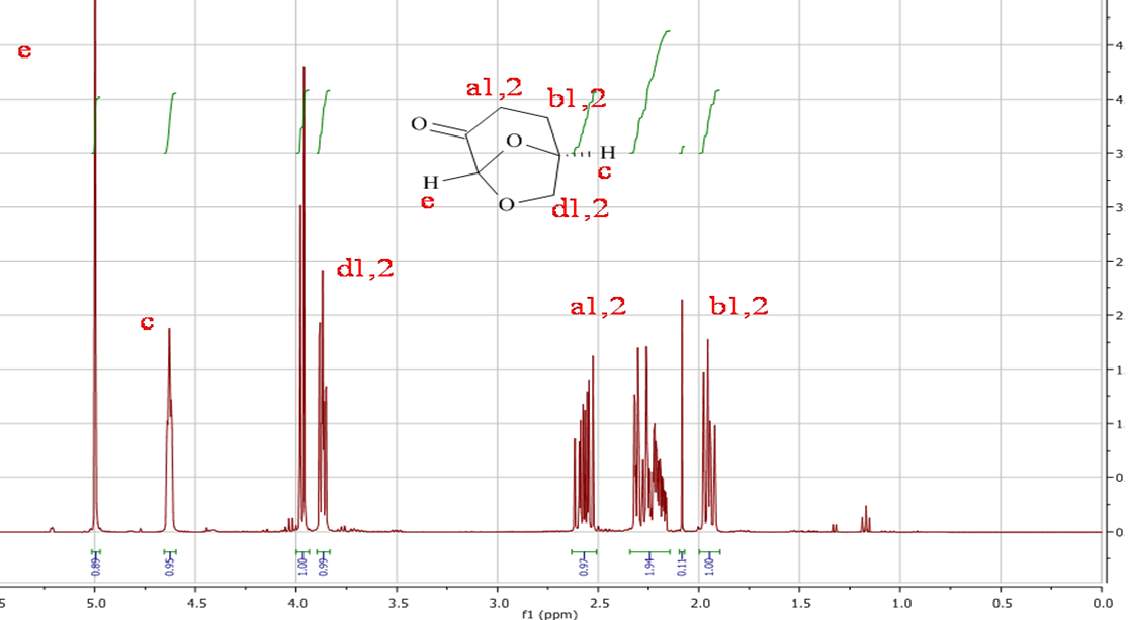
Figure 2.1. 1HNMR of Dihydrolevoglucosenone in CDCl3
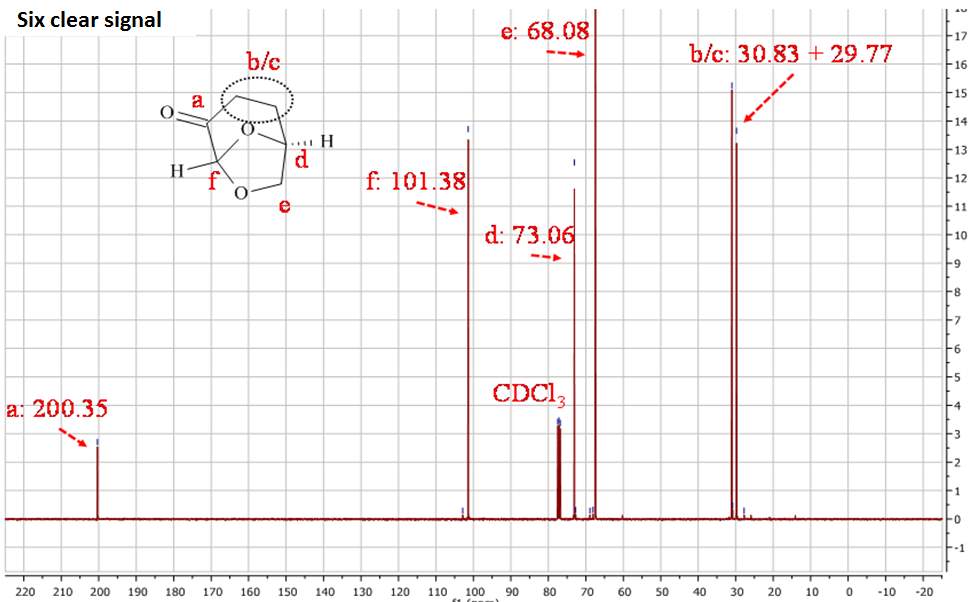
Figure 2.2. 13CNMR of Cyrene in CDCl3
In the 1HNMR exist a direct relation between the area of peaks and the numbers of protons, so is possible by integration give a quantitative analysis. In the 13CNMR were the 13C nuclei do not have uniform relaxation time and as consequence, the relative integrated area of the peaks not give the correct number of C nuclei. However from the 13 CNMR spectra is possible recognize the carbons atoms that are not bonded to the H atoms. These in fact show peak with small intensity, because the relaxation time of a C not bonded to H atom is longer. For this reason is possible recognise from the intensity of the peaks carbonyl groups. The presence in the molecule of C equivalent atoms is responsible for the different number of peak in the spectra, and the number of C atoms present in the molecule. Also the chemical shift of 13C are related to the Hybridization and with the electronegativity of the substituent.1
The 13CNMR in figure 2.2 shows only signal directly related with the molecular structure of Cyrene, in particular is possible see the single signal for the carbonyl (a), and the six signal expected from the asymmetric structure of the Cyrene. The GC-FID and GC-MS analysis of Cyrene indicated that the organic impurities were determined to be lower than 2% in weight. (Figure2.3)
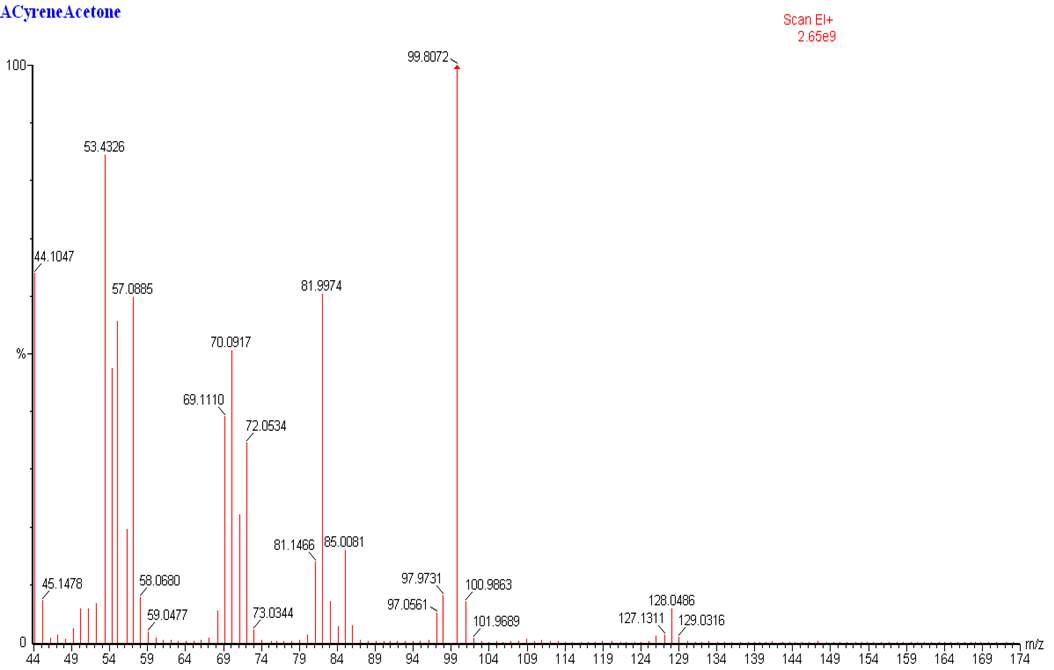
Figure 2.3. GC-MS of Cyrene
Simultaneously, FT-IR spectra of the double distilled pure Cyrene demonstrated the presence of a characteristic double peak in the absorption region of the carbonyl at 1742cm-1 and 1725cm-1 (Figure 2.4).
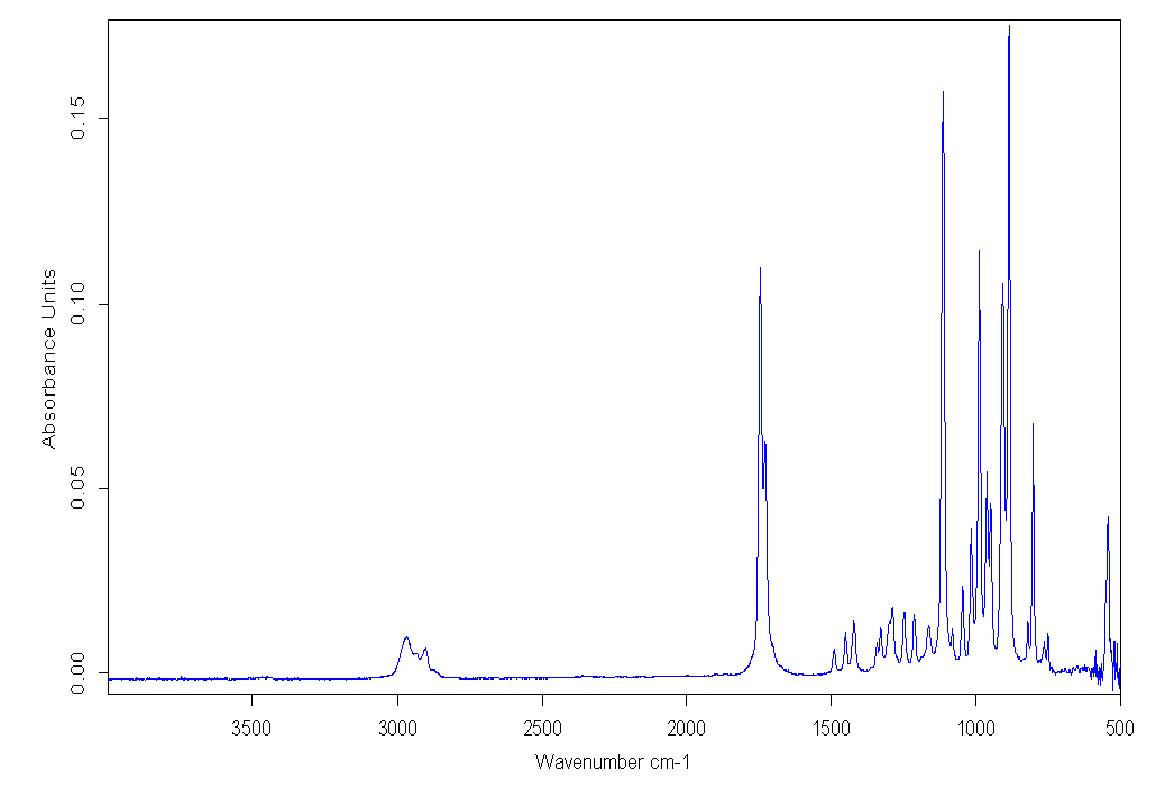
Figure 2.4. FT-IR of pure Cyrene at room temperature
The presence of this double peak was consistently found in all the samples examined and the relative intensity of these peaks were constant. However, based on the molecular structure, a single intense signal would be expected in this region instead of a doublet. As is known, the infrared absorption band arising from the C=O stretching vibration has been studied more extensively than any other and a significant amount of information is known of the factors influencing its frequency and intensity.2
The frequency of the carbonyl absorption is determinate almost wholly by the nature of its immediate chemical environment and the structure of the rest of the molecule is of little importance. Unless, in the molecule are present phenomena like dimerization or keto–enol tautomerism or some resonance effect.3
For this reason it is possible to obtain a considerable amount of data studying the nature, intensity and position of this band. 2 It is also known that the frequency of the carbonyl group is influenced by the different chemical environment. For instance, its position depend by the nature of the solvent in which it is situated .4-7
The presence of two peaks in the carbonyl region of the IR spectra, as reported in literature,2,8,9can be attributed to a wide range of causes, including the opening of the molecule with the resultant formation of rotational isomers, the fast opening and closing of the ring bone (like in sugars),10 the presence of carbonyls with two different chemical environment (caused for example by molecular aggregation),2 complex formation, the presence of two different molecular configurations,8,9athe formation of a dimer or another molecular oligomer, or lastly a dual band may be the result of a some kind of coupling (for instance a Fermi resonance).14
The first step in order to give an explanation of this phenomenon, was to check for the presence of other inorganic impurities in the sample. In fact due to the nature of Cyrene synthesis processes, a small quantity of Pd could form complex through the carbonyl, causing the splitting of the relative band.9b
It was therefore obtained from the company other Cyrene (double distilled) samples, made using different methods. In which a very small concentration of Pd (few ppm as declared by CIRCA, but not quantified) was present. It was verified that in crude Cyrene and twice distilled samples the IR spectra had the same doublet peak with the same intensity ratio. To confirm that the carbonyl splitting did not depend on the presence of impurities from the production methods, the FTIR spectra was performed on a pure Cyrene sample (0.019511 mol) in which 0.0218 g of PdCl2 (1.229×10⁻⁴ mol) was deliberately added. The IR spectra exhibited the same shape for the carbonyl band with ratio intensity, suggesting that the nature of this phenomenon is due to other causes.
The presence of additional impurities such as water were considered as a potential reason for the presence of a double carbonyl. Therefore, a Karl Fischer’s titration was carried out on the Cyrene and an average of 0.33% in weight of water was found to be present in the samples. ( Figure 2.5)
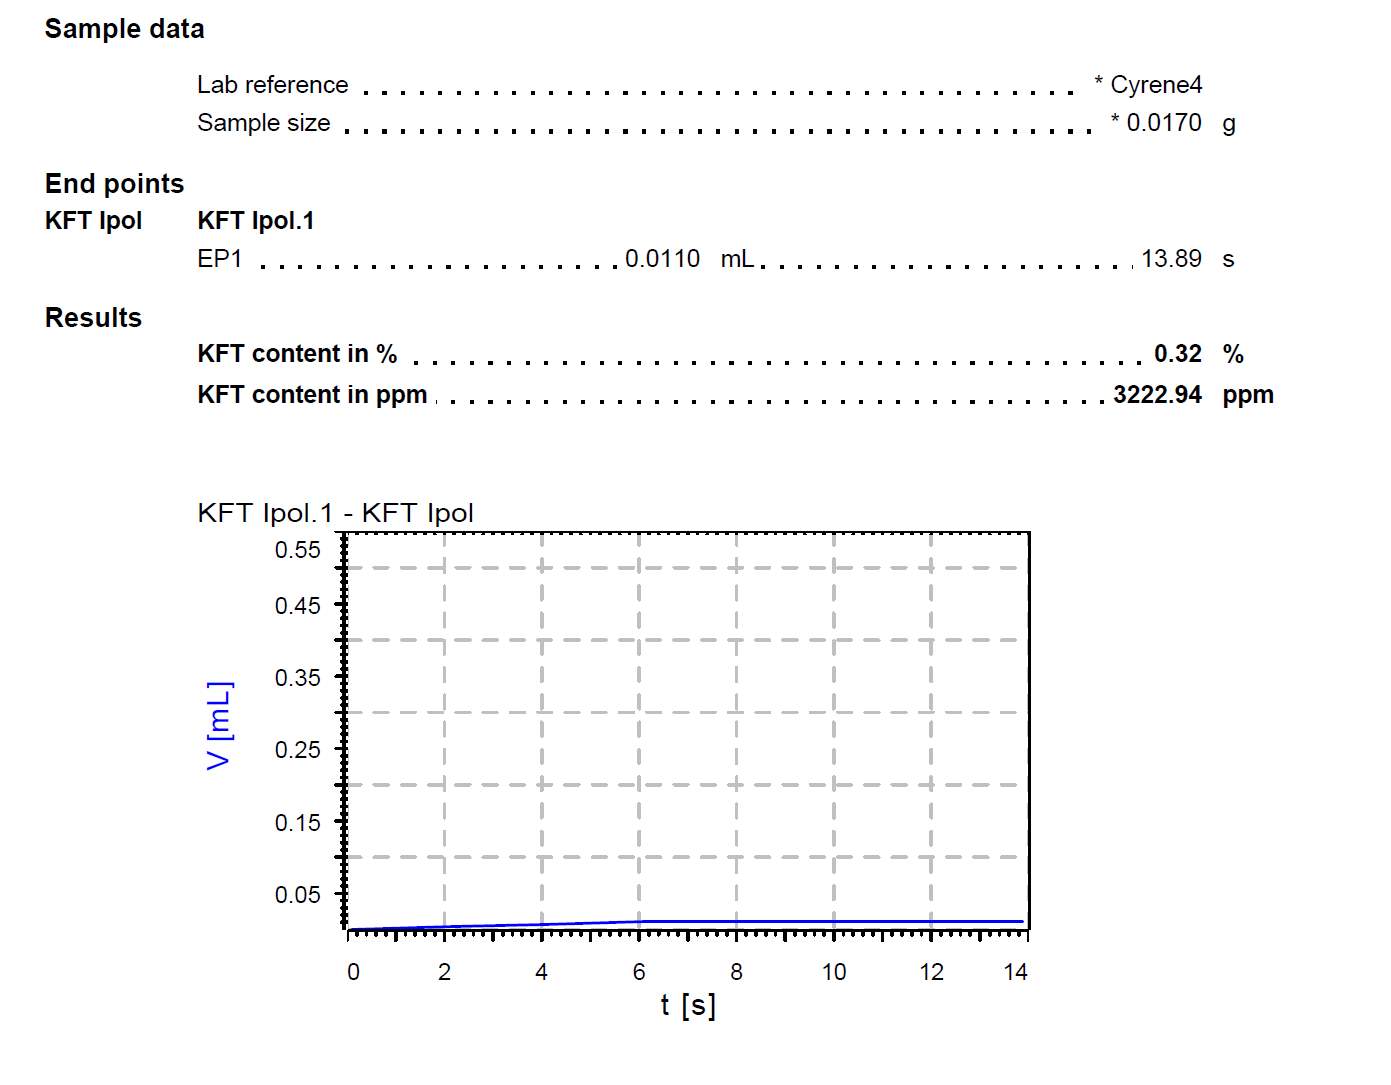
Figure 2.5. shows the report for the KF tritation
The Karl Fischer reaction for water determination follows the equation:
H2O + I2 + [RNH]+ SO3CH3– + 2 RN → [RNH]+ SO4CH3– + 2 [RNH]+ I–
Eq 2.0
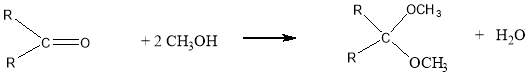
where NR is a base, in which CH3OH is normally used as solvent. In this reaction one mole of I2 is consumed for each mole of H2O. Normally aldehydes and ketones gives problems in the KF titration because they form acetals and ketals respectively with conventional KF reagents.
Eq.2.1
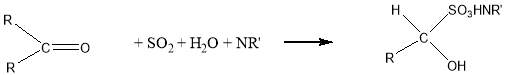
As we can see from the Eq. 2.1 the reaction forms water, which is also titrated, as result is shown an erroneously high water content in the samples. With aldehydes another side reaction, can also occur:
Eq.2.2
In the bisulfite addition, is consumed water and it leads to an erroneously low water content. 11 For all these reason In the titration of Cyrene we used HYDRANAL® a apposite solvent CH3OH free with a specific base that do not give side reactions.
At the same time, the IR measurements were repeated and no OH peak related to the presence of water was found in the FT-IR of any samples.
Figure 2.6 shows a particular spectra in the region of the carbonyl absorption were there are two distinct bands clearly present for the carbonyl group, albeit partially overlapping. It must be noted that the second derivative of the IR spectra, for the pure liquid Cyrene in this region, shows that the first signal (at a higher energy) is due to a single contribution, while the second is formed by several signals.
The deconvolution of the Cyrene spectra using OPUS indicated the possible presence of several peaks composing both the vibrational bands for the carbonyl, this result could be due at an instrumental artefact as consequence of the magnification of the spectra.
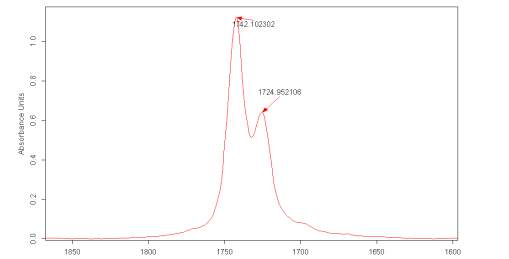
Figure 2.6. FT-IR spectra for Cyrene in the region of the carbonyl
The distance between the maximum between the two peaks is about 17 cm-1. The presence of these two peaks and their difference in energy is consistent with the assumption that the carbonyl could undergo an intense intermolecular hydrogen bonding interactions .3
Another possible explanation is the presence of two different chemical environments for the carbonyl through the formation of an “ordered” structure in Cyrene. For example, the formation of dimers, trimers or other oligomers, some of these possible structures are shown in figure (Figure 2.7).
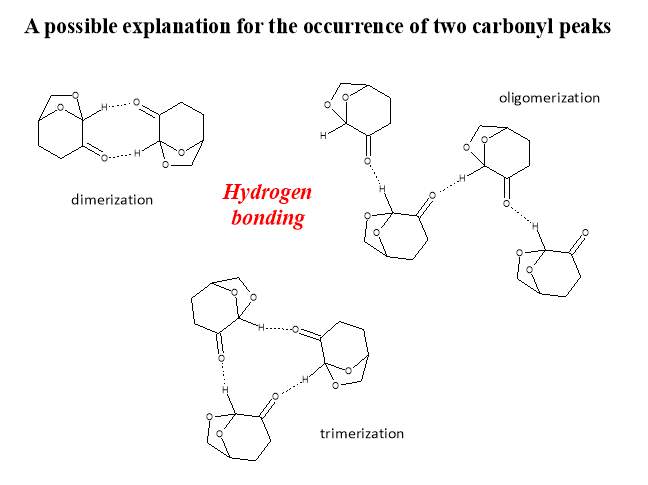
Figure 2.7. Possible oligomers of Cyrene
Spectroscopic studies of molecular structure are normally extended from the conventional mid-IR range to the far-IR or near IR.13
For instance, at low-frequency molecular vibrations provide unique fingerprints, this part of the spectra is highly sensitivity to intra- and intermolecular interactions. The study of this region is normally used to investigate the conformation of many systems, including proteins.14,15
Gas-phase mid-IR spectroscopy combined with theoretical calculations have demonstrated great potential in the successful structural analysis of molecules of biological interest.12–17
In the case of Cyrene, study of the spectra in the mid-IR region was limited, due to the high density of vibrational states and its low symmetry, so the use of additional techniques to resolve individual mid-IR bands is required.22 Furthermore, the mid-IR data quite often allow only assignment of families of structures.17 Albeit with these limitation, an explanation of the spectroscopic behaviour of Cyrene is postulated.
The use of IR and Raman spectroscopy is historically proven to be a fundamental tool for the analysis of ordered systems in which intra and inter molecular interactions between functional groups of a molecule have a direct impact on its position of the bands and their intensity.23
One of the methods to verify the presence of such structures is through FTIR or Raman analysis on pure Cyrene at different temperatures, comparing to the spectra obtained with the one in gas phase (fig.2.9). In presence of ordered structures like dimer or other oligomers, the relative height of the IR signals for the carbonyl band, should vary with changes in the temperature. 4-5-6 -7 (14,15,24,25)
It was therefore examined the FTIR spectrum of the pure Cyrene in Gas phase.(fig2.8-2.9)
Figure 2.8. The IR spectrum in the absorption region of the carbonyl in the gas phase.
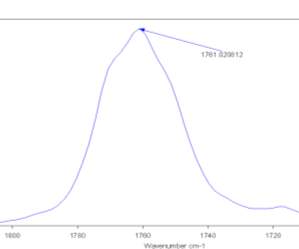
Figure 2.8.
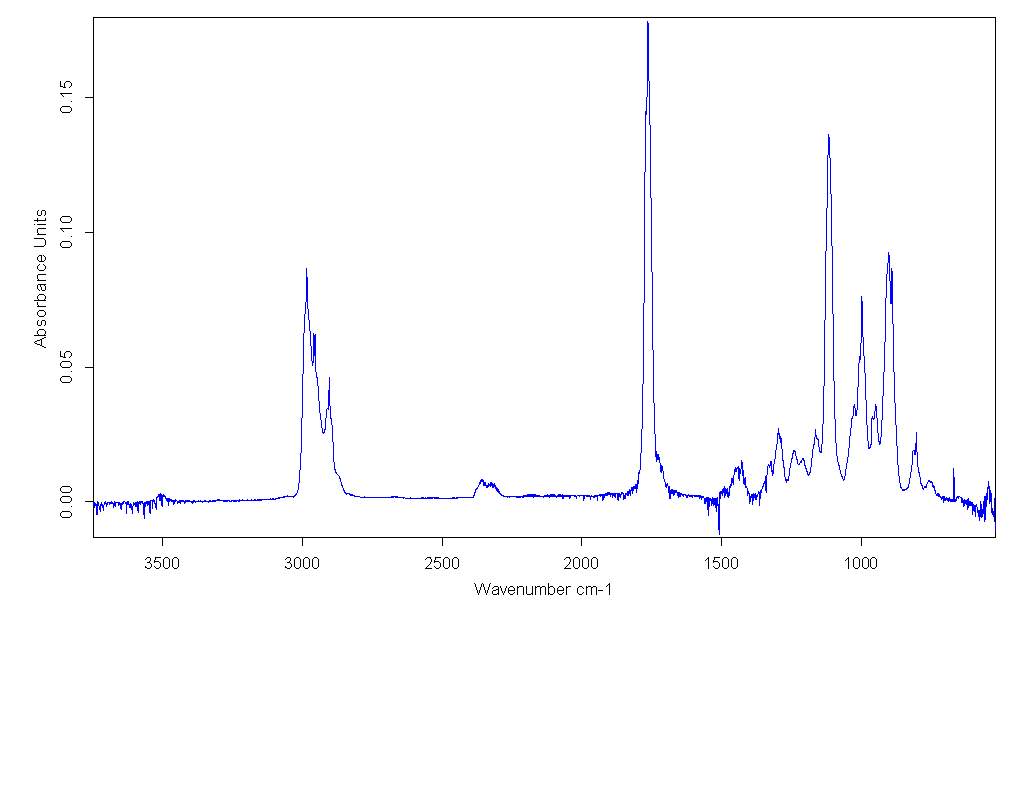
Figure 2.9. FT-IR spectra for Cyrene in gas phase
The presence of only one peak relative to the absorption of carbonyl was found at higher energy. In fact, the IR spectra of condensate phases, demonstrate a displacement in the position of peaks at lower energy if compared with the gas phase spectrum. In literature it could be found that the magnitude of this shift is related to the nature of the force that interact between the molecules of the condensate phase. It can be seen that the distance from the maximum of the peaks, between the gas and the liquid phase in the carbonyl region of absorption, is about 17-18 cm-1 . At this point the IR spectra of pure liquid Cyrene at different temperature was performed.
In the presence of dimers, trimers or other oligomers, it is expected to see an increment in intensity of one of the peak in the doublet. The signal related to the monomer form (normally is the one at higher energy) and a decrease of the peaks related to the formation of oligomers. This behaviour could be explained with the progressive breaking of hydrogen bonds between molecules leading to an increase in the proportion of monomer form in the solvent.
From a series of DRIFTs IR spectra carried out at 30 °C up to 200 °C (Figure 2.10) it was shown that the relative heights of the two peaks in the carbonyl absorption region do not significantly change and the relative distance between peaks remains constant.
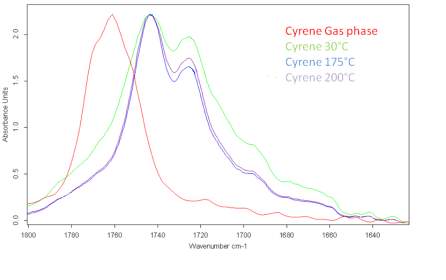
Figure 2.10. Behaviour of the carbonyl peaks at different temperature (DRIFT): in red the peak of Cyrene in gas phase.
This result was unexpected and is in contrast with the hypothesis of the presence of structures like dimers or other oligomers. Although, in principle this phenomenon may be justified by the existence of strong hydrogen bonding interactions or with a diffuse hydrogen bonding net between the molecules. In fact is well known that when a strong hydrogen interaction exists between molecules, the intensity of the peaks in the IR at different temperature may not change drastically in a wide range of temperature. At this stage, some brief considerations on the hydrogen bonding were considered.
According to the structure of the Cyrene, the functional group that are able to form inter molecular Hydrogen bonding between the oxygen of the carbonyl and the oxygens of acetal, which are both able to interact with the hydrogens present in another Cyrene molecules. But is the oxygen of the carbonyl due the polarity of its bond that is expected to be involved in much stronger intermolecular hydrogen bonding, even if the typical bond strength that take place between the carbonyl and an alkyl hydrogen is in the range between -1,9 and -5,5 KJ/mol . 27(26,27) it could give a significant contribute to the stability of possible oligomers.
It should also be noted that from thermogram (Figure 2.11.) of Cyrene there is no evidence of degradation and a mass loss is exhibited at 125 oC. Also the Derivative of the TGA confirms the purity of the molecule, showing the expected behaviour during the evaporation of the sample with the increasing of temperature. Have to be stressed that no visible quantity of water was noticed. It was therefore possible to exclude the presence of a double band due to the degradation of Cyrene with the temperature.
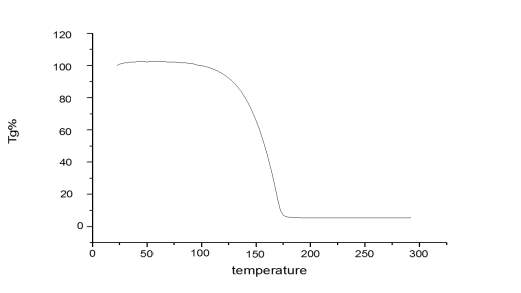
Figure 2.11. Thermogram of pure Cyrene
2.2 Fermi resonance or not?
As previously discussed the spectroscopic splitting of a band can be attribute to a wide range of causes.
One of the assumptions that was immediately investigated, was the possible presence of a Fermi resonance involving the carbonyl of the Cyrene molecule. The spectroscopic behaviour of Cyrene in different solvents was investigated. At this point is useful give a brief description of the spectroscopic behaviour of Cyrene in different solvents, that is solvent is summarised as follows:
The band at 1725 cm-1 in polar solvents increases in intensity and widens, while observing only a limited displacement in the carbonyl frequency from 1725 cm-1 at about 1723 cm-1, while in less polar solvents, the intensity of the band is reduced (Figures 2.12-2.14). The most intense band at about 1743 cm-1, decreasing in intensity in the polar solvents and shows a slight blue shift of just 1-2cm-1 (1745cm-1 ) .
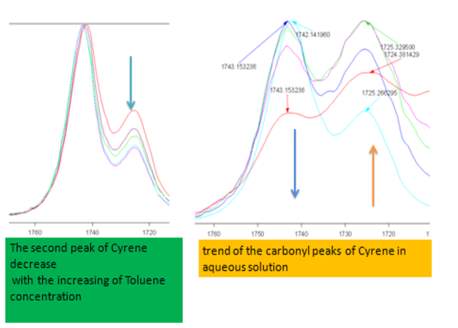
Figure 2.12. Trend of the carbonyl peaks in Toluene and aqueous solution
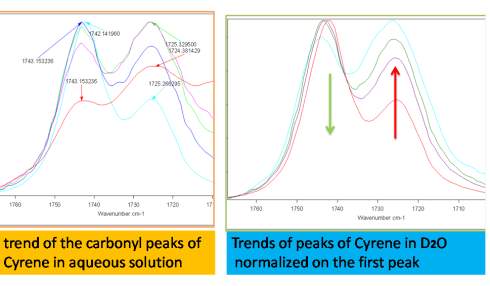
Figure 2.13. Trend of carbonyl peaks in water and D2O
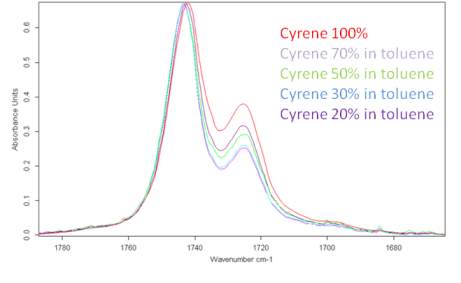
Figure 2.14. Behaviour of Cyrene in Toluene
The IR spectra of pure Cyrene and Cyrene in different solvent, does not demonstrate conventional characteristics for a carbonyl. 2,28
In fact, the relative insensitivity of the first band of the carbonyl to the different chemical environment, while in contrast the second show a larger shift in the spectra, suggest that the carbonyl of Cyrene in not free from each other’s interaction. A free carbonyl, that is not involved in formation of oligomers or which does not undergo inter or intra molecular hydrogen bonding shows a strongest shift in the characteristic frequency of vibration in different solvents. The spectroscopic behaviour of Cyrene could indicate a strong hydrogen interaction between Cyrene molecules. Such interactions may lead to the presence of a specific molecular organization in liquid Cyrene in which there are two different chemical environment for the carbonyl. However, another possibility, for this behaviour is dependent on the presence of a Fermi resonance.15 (29)
In general, Fermi resonance results in the splitting of two vibrational bands that have similar energy and same symmetry in both IR and Raman spectroscopies. The two interacting bands are a fundamental vibration and an overtone or combination band.16(30)
The wave functions for the two resonant bands mix according to the harmonic oscillator model, the result is a shift in frequency and a change in intensity in their IR and Raman spectrum, and, two intense bands are observed, instead of the expected strong band for the fundamental and a weak band for the overtone or combination band.17(31)
If two vibrational mode have same symmetry and similar energies, mixing occurs and the resulting modes can be described by a linear combination of the two interacting modes.32 The effect of this interaction is to increase the splitting between their energy levels, as consequence the distance between the peaks of the interacting vibrational modes increase in the IR spectra.33 The mixing of the two states also tend to equalize the intensities of the bands involved in the Fermi resonance, and a weak overtone or combination band show significant intensity while the fundamental band tends to decrease its intensity. Because the coupling bands have nearly the same frequency, the interaction could be affected if one band undergoes a frequency shift, for instance due to deuteration or a solvent effect, while the other does not, as it happens in the case of Cyrene. This shift in the vibration frequency lead to decoupling the two bands.34,35
It is essential to emphasize that the relative intensities components of a Fermi resonance multiplet can varies significantly in frequency with temperature if one of the resonant band change in frequency. (e.g. the C=O fundamental).18-19(36,37)
When bands are broad, Fermi resonance perturbation of localised levels cannot be applied. This broadening can be the result of a number of things, including intermolecular interaction and shortened excited state lifetimes.
In the case of Cyrene, the bands are sufficiently separated and not excessively wide however, the profiles of the bands are different as seen by fitting using the program OPUS.
In particular, the band at 1745 cm-1 approximately has a Lorentzian profile, while the band at 1725 cm-1 has a mixed Gaussian-Lorentzian profile. It was not possible to perform a satisfactory fit for the bands related to the carbonyl in different solvent, due to the presence of abnormal bands whose position changes with the concentration of the solvent. This behaviour probably is due to the presence in the peak of overtone or combination bands that changes position and width in different solvents.
It had been seen that the IR spectra of Cyrene and twice distilled Cyrene in different solvent, does not demonstrate conventional characteristics for a carbonyl. It was noted from the IR spectra in various solvent the ratio between the intensities of the bands change significantly. See Figure 2.10-2.14
Although this behaviour can be explained by the effect of the solvent, 20-21 (38,39) for instance the intensity of the carbonyl increase in solvent with proton donor , due to the change in the dipolar moment of C=O , or with the formation of carbonyl of structure with the solvent , as a dimer or other oligomers . The ratio between the intensities of the two peaks in the Cyrene spectra, are unaffected by the temperature, thus could excluding the formation of a dimer or the existence of two different molecular configurations with different energy. 14,15, 24,25
This behaviour, could indicate a strong hydrogen interaction with the other molecules of Cyrene or with the solvent. In fact in the case of two different conformer form, with the increasing of temperature, we should see a stronger different in the relative intensity of the bands with a corresponding significant change in the shape of bands in the fingerprint region.40
However, this was not observed in the IR spectra of gas and condensate phase.41,42?
The simplest comparison in the literature suggesting a Fermi resonance is present in cyclopentanone.22-23-24(43,44,45)? However, the cyclopentanone did not show a clear Fermi resonance behaviour with the solvent variation method. The other suggestion postulated by the authors was the presence of a dimer, which could also explain the doublet present in the IR spectrum for this molecule. 22-24(43-45)
This literature reported methodology was therefore applied to Cyrene. To determine if the hypothesis of a Fermi resonance is correct, polarized and not polarized Raman Spectra for pure liquid Cyrene was obtained, as well as second series of IR spectra conducted different temperature using a specific cell for liquids (although one of the window was cracked). Although Raman polarized that not polarized spectra shows that the relative intensities of the peaks of carbonyl, in liquid Cyrene at room temperature, do not change substantially (figure 2.10), as expected in the presence of Fermi Resonance.22-23(44-45) The ratio between the carbonyl bands, in this second set of IR spectra recorder at different temperature, change with the temperature is in contrast to previous experiments (figure 2.15-2.16). 22-25(43-46)
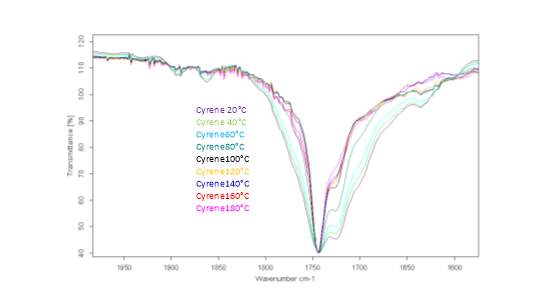
Figure 2.15.The IR spectra at different temperature.
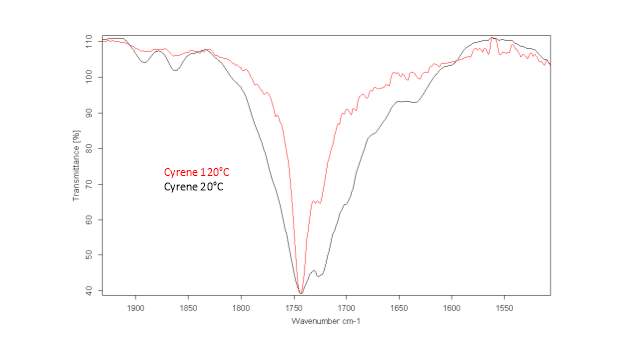
Figure 2.16. IR spectra of Cyrene at different temperature
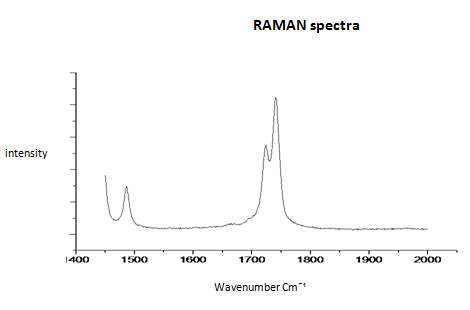
Figure 2.17. Raman spectra of pure liquid Cyrene at room temperature
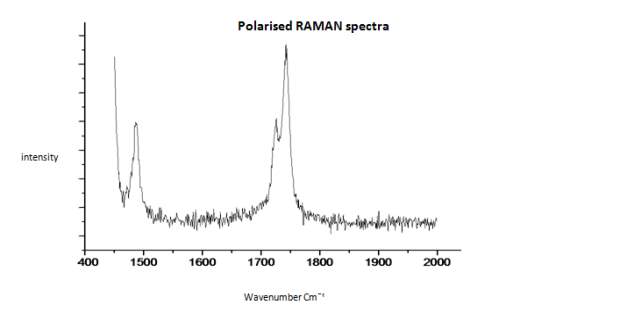
Figure 2.18. Polarised Raman spectra of pure liquid Cyrene at room temperature
Given the lack of reproducibility in the IR at different temperatures, it was necessary to repeat this experiment using another instrumentation. A third series of analysis at elevated temperatures were made using the REACT FTIR in the range of 25-140 0 C. figure 2.19-2.20
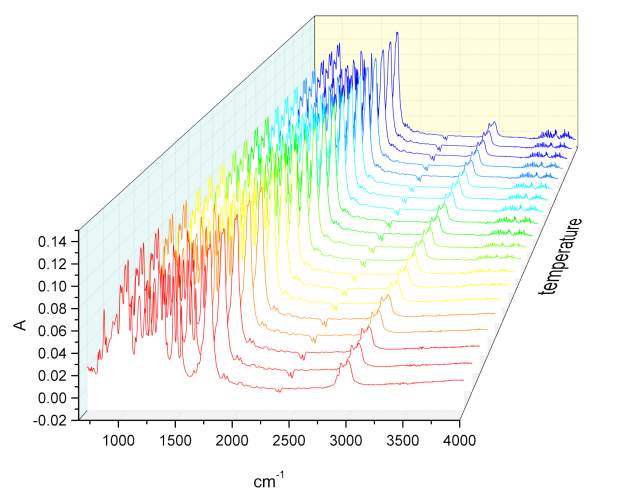
Figure 2.19
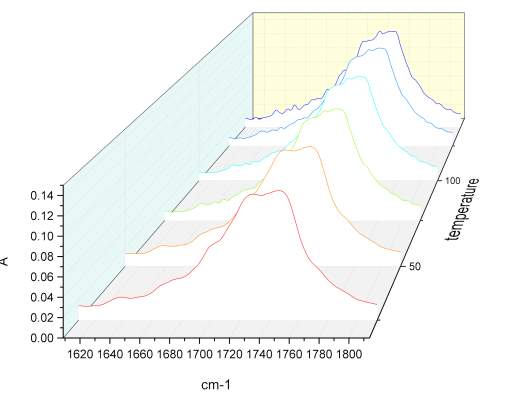
Figure 2.20 n
Unfortunately the instruments resolution was only 4 cm-1. As observed in figure xxx, the relatively intensity of peaks does not change significantly. Once correct the baseline for the third series of IR spectra temperature it was possible calculate the value for the total integral of the carbonyl peaks from 25 °C to the one at 140 °C. The variation of the area of the peak at highest energy is compensate with the decrement of the one at lower energy, and the value of the total integral remain constant, which is indicative of an absence of resonance phenomena.
Nevertheless, given the variability of result in different series of IR spectra at temperature, others methods have been utilised to disprove the existence of Fermi resonance. These includes, the “solvent variation method”, which is a semi empirical method that is valid for large molecules, but not for small molecules such as CO2.5 (14)
This method provides the calculation from the IR spectrum of the value of Fermi constant coupling for the bands by an interaction in various solvents. If this value does not change in different solvents, this provides evidence to support a Fermi resonance.14 -26
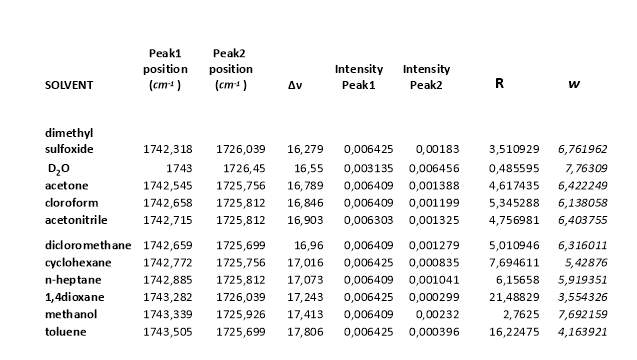
The data of ratio between the intensity of the two peak in the carbonyl region and the relative distance between the maximum intensity of the peaks in different solvents are necessary to calculate the Fermi coupling constant using is method (figure 2.21, tablet 2, ).14 (9)
The coupling constant was calculated using the following equation:
R= {∆ +(∆2-4W2)1/2}/{∆- (∆2-4W2)1/2}
Were R is the ratio between the integrated intensity of peaks, W is the Fermi resonance coupling constant and ∆ is the difference of frequency between the peaks at the maximum of intensity.
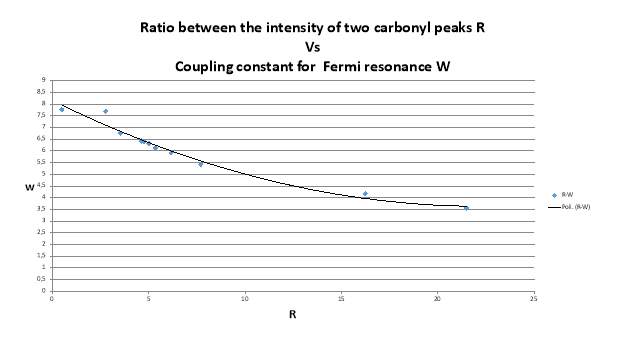
Figure 2.21. The trend of Fermi’s coupling constant
As shown in the figure 1.21 the value of Fermi coupling constant change strongly, if the presence of a Fermi resonance was confirmed it should remain almost constant.
Tablet 2. Data collecting from IR spectra and using for the calculation
Others tests that are used to prove a fermi resonance are proposed in the literature include the isotope substitution method, which as has been demonstrated as a simple method that can easily exclude both ,the presence of Fermi resonance as well as the presence of two different molecular conformations as responsible for this oddity in the IR spectra.8,49
However, in the case of Cyrene this technique would be technically difficult and particularly expensive. Although the variation solvent method cannot be considered as definitive proof to deny coupling phenomena, the experimental data obtained indicates that the Fermi resonance is not involved the carbonyl of Cyrene molecule. The last remaining hypothesis that can explain the doublet band in this region of the spectra, is the formation of oligomers between Cyrene molecules and will be discussed in the next section.
2.3 Which molecular organization for Cyrene?
The important role of the hydrogen bond
This section discusses the experimental data suggesting that Cyrene is organized in a complex bulk, in which two different “organizational” environments are present for the carbonyl, thus explaining both the spectroscopic oddity of the doublet band and other unusual physical characteristics of density and boiling point.
As told in the introduction The Kamlet–Abboud–Taft parameters for Cyrene indicate that this solvent is aprotic (Table 1.2), with a similar π* value ,that corresponding to a measure of its dipolarity, to those of highly dipolar aprotic solvents. It shows also a slightly lower β value which is an indicator of hydrogen bond accepting ability.1(50)
From this data and from the structure of Cyrene it should be expected that the principal force interact between Cyrene molecules is the hydrogen bonding. In order to define the strength of this interaction, it was performed an wide series of IR of Cyrene in different solvents and simultaneously it was check the IR spectra of liquid Cyrene compared with the one in gas phase in the C-H region.
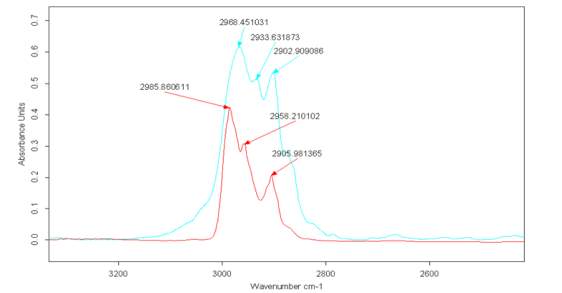
Figure 2.22
Figure 2.22. reports the spectra related to the liquid Cyrene (blue) and the spectra of Cyrene in gas phase (red). Comparing the peak at 2900 cm-1 in liquid phase with the one in gas phase, shows an increase in intensity compared with the signal at 2985 cm-1. This signal remains in in a similar position for both the liquid and gas phase Cyrene. It is be clear signs of interaction of a specific hydrogen bond between the Cyrene molecules in the liquid state. As told before, once excluded resonance phenomena, the appearance in liquid phase of a second peak (shown as a doublet in the carbonyl zone) is probably due to structuring (not necessarily a dimer), which involves specifically the C-H and C = O group.
It is well known that some weak hydrogen bonding has an effect on the no shift or in same case,51as for the Cyrene , a blue shift relative of C-H vibrational mode in the IR spectra.
Due the nature of both C-H and C=O it is possible for the existence of a weak hydrogen bonding interaction,51 leading to an extended hydrogen bonding interaction between molecules, thus explaining the high value of both density and boiling point. This non shift of C-H peak passing from the gas phase to a condensate form, is another unique aspect of the Cyrene spectra. In Cyrene may exist a very particular case of hydrogen bonding, namely an anti-hydrogen bonding.52
Over the last 20 years, a large number of studies on hydrogen bonding had been produced. Recently hydrogen bonding interaction with peculiar characteristic blue shift or non-conventional hydrogen bonding between two different H atoms has been reported.53-52
The classic hydrogen bonding is described as a non-covalent and attractive interaction between a proton donor X-H (electron acceptor) and a proton acceptor Y that can be involve the same or different molecules.63 According at this description, in a conventional hydrogen bonding the hydrogen atom is bonded to an electronegative group or atom and when this is involve in hydrogen bonding through the interaction with a proton acceptor Y (electron donator), the distance between X and, became smaller than the sum of Van Der Waals radii of the atoms X and Y. In the same time the distance X-H increase and this bond elongation can be visualized in the IR spectra as a red shift in the frequency of the fundamental vibration of X-H , also it is generally observed an increase of its intensity.
The formation of this interaction lead to a decrease of the magnetic shield of proton involved in the hydrogen bonding, that is visible in a shift at lower field in NMR, it was found in fact a correlation between the experimental hydrogen bond distance and strength an NMR chemical shift.64-69
This shift is proportional to the number of hydrogen bonds between molecules.69
At the same time the electron density flows from a proton acceptor to the donor. 70
The electron density is in fact is transferred from the proton acceptor (lone pair) to the σ* antibonding orbital of the X-H bond, causing the weakening and the elongation of this bond and the decrease of X-H stretch frequency. 71
However, the Hydrogen bonding is a kind of interaction that is far to be completely understood. In theory the hydrogen bonding could be explained as an attractive force between partial electric charges with different polarity. In fact, the electronegative atom X attracts the electron density from the partially positively charged hydrogen, and this attracts a lone pair electron from Y, but it true only for weak hydrogen bonds. The hydrogen bonding shows several type of contribution, due to electrostatic and polarization effect and charge transfer, especially when a delocalization effect or dispersion forces plays an important role.72,73
The wide nature of these effects is reflected by a wide range of shifting and intensity in the IR spectra. For instance the shift in the IR can go from few cm-1 to more than 100 cm-1 in same case, with energy interactions between molecule in the order of 15-40 Kcal/mol for strong hydrogen bonding, and from 4-15 Kcal/mol in the case of a moderate or weak hydrogen bonding interaction. This wide variability in the strength, depends strongly from the angle and the distance between the groups involved in this type of interaction.
How was already told the red shift and the consequent increasing in intensity of the spectral band involved in the hydrogen bonding , is a spectroscopic characteristic of this kind of interaction. However, there are other situation in which the stretching vibration of X-H is shifted to higher frequency (blue shift). When that happens we are in front of a non-conventional type of hydrogen bonding called Blue shifting or improper or anti hydrogen bonding. This peculiar type of interaction is typically observed in the cases in which the X-H bond elongating hyper conjugative n(Y)⟶σ*(X-H) interaction is relatively weak. 74According to the theory when the interaction is weak and the hybrid orbital of X in X-H bond undergo a change of both polarization and hybridization, we have a shortening of X-H bond that cause a blue shift in the spectra.
Over the years many model were proposed in order to explain this phenomena, but its real nature is object of debates in the scientific community.
As we saw before with the formation of a conventional the hydrogen bonding the electron density flows from lone pairs of the proton acceptor to Y to the σ* antibonding molecular orbital of the proton donor X-H with an increasing of electron density on it. As consequence we have an increasing of polarity of X-H bond (a larger negative charge on the proton donor and an increasing of positive charge on the proton acceptor). This is the cause of the weakening of A-H bond and its red shift in the IR stretching vibrational mode as well as an increase of the total dipole moment of the system.
For the Blue shifting hydrogen bonding and others improper hydrogen bonding, it was proposed more than a mechanism, we will report only one as example:75,76
The flow of electron density from the proton acceptor to the antibonding molecular orbital of proton donor, like in a conventional hydrogen bonding, is followed by the shortening of X-H bond.77,78,79, 80
“The bond length X–H is controlled by a balance of two main and opposite effects. One of them is the hyperconjugative interaction
n(X)→ σ*(X-H) that is responsible for elongation of the X–H bond, whereas the other is the increase in the s character of the hybrid molecular orbital at X, accompanying the polarization of the X–H bond. If the latter effect dominates, the X–H bond contracts and ν(X–H) undergoes a blue shift. If the former dominates, the red shift of ν(X–H) occurs.” 106,107
However, as told above this effect is due to a balance of a variety of effects including electrostatic , polarization charge transfer , dispersion , steric repulsion force ; an examples is the case of C–H—–O bond present in the methane-water complex , were without the dispersion contribution , the complex would not exist,81,82,83
Another example is the hydrogen bonding between fragments with opposite charge where the dipole –dipole term is not predominant as shown not all hydrogen bonds are just electrostatic in nature.
However the balance between this varieties of effect could explain the not movement of the C-H band in the IR spectra. A major part of a class of nonconventional hydrogen bonds belongs to the C–H——B bonds, in particularly at the C–H——-O bonds. The influence of this kind of interaction it is shown to be very important in complex systems .84,85A first description of the hydrogen bonding between the C-H group with an oxygen was proposed by Suton but only in recent times, its central role to explain the structure of proteins their stability and folding was stressed.86-89
In particular it was observed as this kind of weak hydrogen bonding interaction was responsible to the behavior of a wide range of biological molecules. Although The energy of this bond is just a bit stronger than the van der Waals bonds ,90( about 2-4 Kcal/mol ), the C-H….O=C role in the proteins , is fundamental , even if it represent only the 6-10% of the total of the hydrogen bonding , its angular preference , and its numbers , are responsible for many specific interaction between biological molecules. At the contrary the role of this bonds is secondary in the aggregate and crystal91
It was shown that the strength of this bond depend strongly on the nature of the proton donor acidity and from the proton acceptor basicity. In fact the strength of the C–H—B hydrogen bonds and their stretching modes n(C–H) strongly depend on the nature of the proton donor92 as C(sp)-H > C(sp2)-H > C(sp3)-H. Therefore ,the importance of this weak interaction do not have to be underestimated , for instance Dougill and Jeffrey used C–H—O=C ‘‘polarization bonding’’ for the explanation of the anomalously high melting point of dimethyloxalate. In the same way, the presence of this hydrogen bonding could explain the chemical-physical property of the Cyrene.
2.4 Which kind of organization we should expect from Cyrene? And which kind of oligomer is possible for this solvent?
Although the existence a such weak interaction has been demonstrated, the behaviour of Cyrene in various solvents, suggests the presence of an intermolecular oligomerization involving the carbonyl. To confirm the existence of such a structure a series of experiment were undertaken, including: FTIR of Cyrene in very dilute solution with CCl4, comparison between calculated and experimental value of ΔH of vaporization, comparison between calculated and experimental IR spectra in gas phases, and calculated IR spectra for some dimer form of Cyrene.
FTIR of twice distilled Cyrene in CCl4 (in proportion of 1/200 mol), indicates a strong band for the carbonyl of Cyrene at 1749cm-1 (figure 2.23).
Figure 2.23
Two smaller and very wide bands at 1697 cm-1 and at 1650 cm-1 attributable to combination bands are also present. Although these bands could due to the presence of oligomer, the most plausible explanation is that they are related with a characteristic vibration of Cyrene. These are also present in the Cyrene gas phase and because their intensity does not increasing with temperature they cannot been attributed to hot bands. Probably the same bands are responsible for the complication in the fitting of the bands using OPUS.
Another proof supporting the self-assembly of Cyrene molecules come from the determination of the ΔH of vaporization of the pure Cyrene through the classical Clausius-Clapeyron experiment.
Fig.2.24
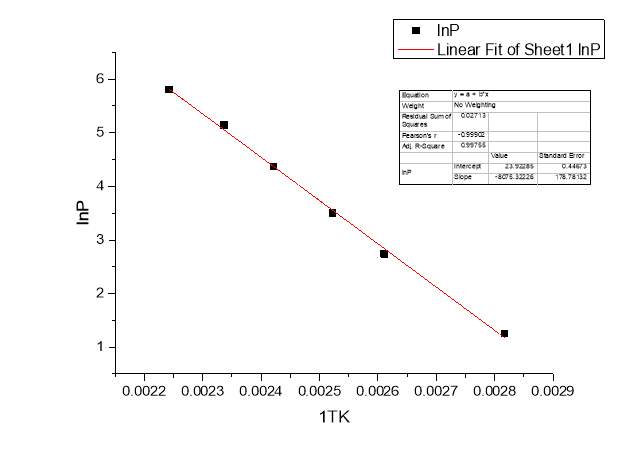
Figure 2.24
As we can see from the figure, plotting the experimental data of the natural logarithm of the pressure lnP against the temperature 1/T we have obtained a line which slope was calculated from the classical relation:
lnP1P2=ΔHvapR1T2-1T1
Slope=-ΔHvapR
The value obtained for the enthalpy of vaporization of pure Cyrene was 67.142 KJ/mol. This value was compared with the one calculated using ACD/labs that shows a value of ΔHvap=46.83 ±3 KJ/mol at boiling point. Fig2.25
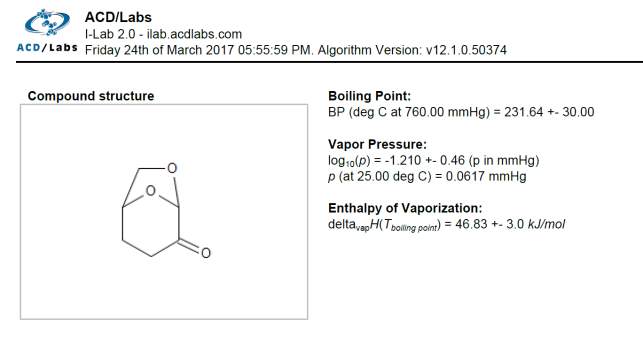
Figure 2.25
The experimental value of the entropy of vaporization ΔSvap at boiling point using the relation was calculated through:
ΔSvap=ΔHvapT
The result of ΔSvap was 137 J/molK. The
ΔHvap
, typically has an error of greater than 10%, the very high value of entropy could be an indication of molecular interaction. In fact following the Trouton’s rule positive deviation from the theoretical value of the entropy of vaporization are related with the presence of hydrogen bonding interaction between molecule.93-96
In addition, the calculations of IR spectra of Cyrene in gas phase were compared with the experimental data. Figure 2.26
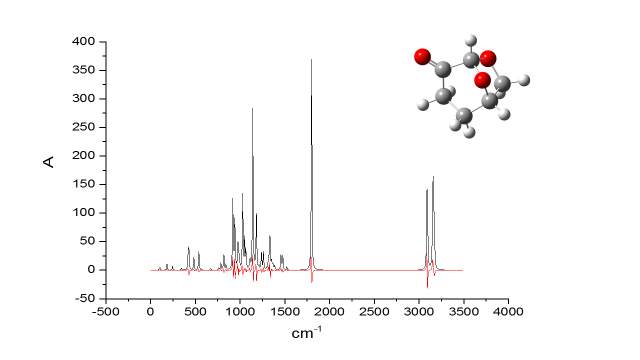
Figure 2.26
It became apparent the remarkable similarity of the calculate IR spectra of Cyrene in gas phase, with the experimental one, in particular in the finger print region. The calculations based on IR spectra for several dimers demonstrated that it was possible notice the splitting of the carbonyl band.
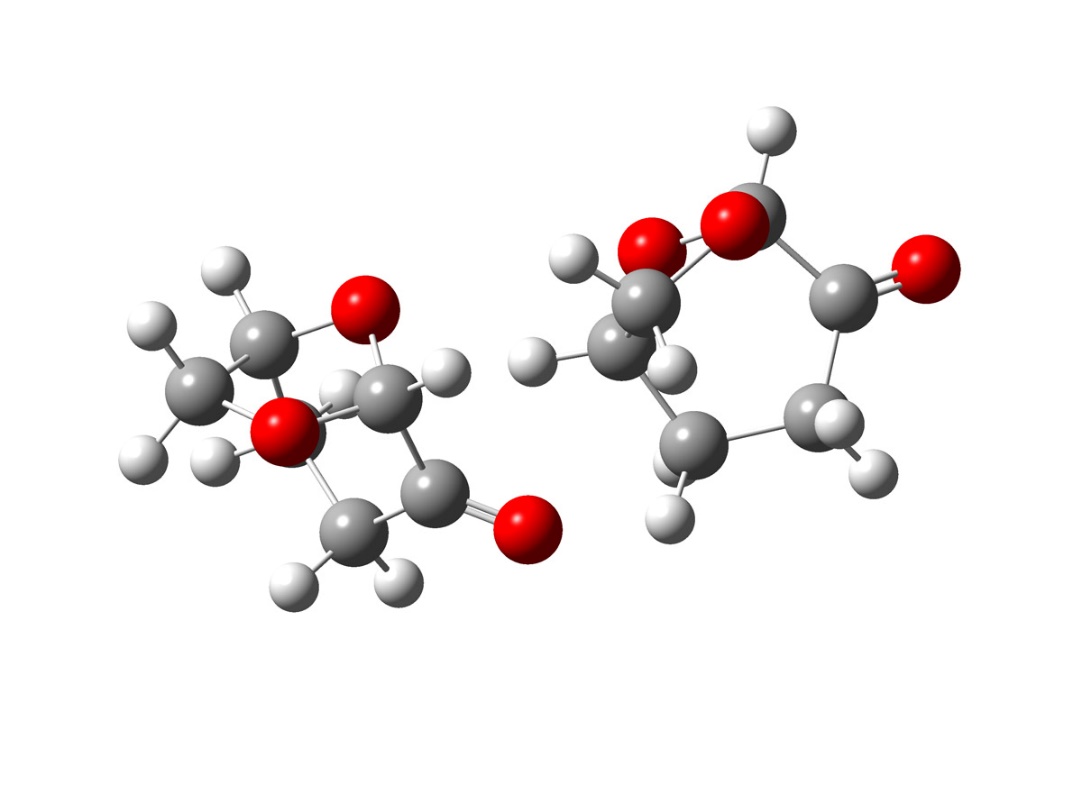
Figure 2.27
As observed in figure 2.27, the conformation of this dimer present in solution, two different chemical environment for the carbonyl, that could explain both the splitting of the carbonyl band and the relative insensibility from the chemical environment of one of the peaks. Although is possible shown many other oligomers models, that could explain this behaviour, they require more accurate calculation and a deeper spectroscopic study that for obvious reason cannot be object of this study. However, the following calculation, gives a reasonable explanation of the experimental spectroscopic characteristic of Cyrene, strongly suggesting the existence an oligomer structures responsible for its chemical physic characteristic.
Figure 2.28
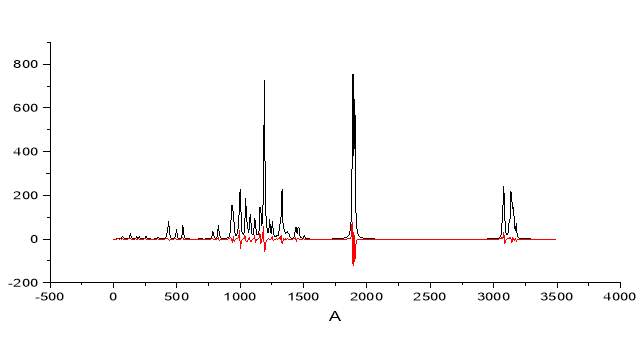
Figure 2.28 note the splitting of the band for the carbonyl
The model above presented shows the clear spitting of the carbonyl band and the simultaneous increase of the antisymmetric stretching in the C-H zone, exactly as observed in the experimental IR.
Hence, as shown in the previous paragraph, crosschecking the experimental data with all the calculation, it was reasonably exclude the possible existence of Fermi resonance involving the carbonyl and at the same time then attributed the second peak in the carbonyl region to the presence of an oligomer form of Cyrene that conventionally was attributed to a dimer.
The probable existence of these dimer forms in the pure liquid Cyrene, leads to the question if is possible or not the presence of a long range order in the solution, as shown for instance for the liquid crystals or ionic liquid solvents. To answer this question a new set of experiment using a Polarized Optical Microscope and a light scattering spectroscopy were performed.
The idea that Cyrene could shows some pattern like liquid crystal comes from the fact that its molecular structure shows a typical amphiphilicity and an anisotropy that is necessary for the formation of such ordered structures. see Figure 2.29
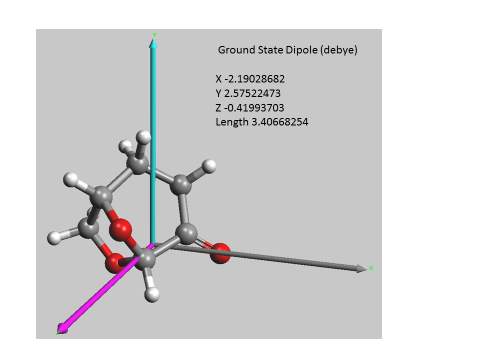
Figure 2.29
In fact, the anisotropic interactions when sufficiently intense favouring a common alignment of the molecules. As is possible to see from the calculation reported in figure, that an amphiphilic structure with a significant dipole moment passing through the plane between the carbonyl and the alpha carbon. In other molecules like 4-pentyl-4′-cyanobiphenyl (5CB), shown in Figure 2.30 the presence a large electric dipole moment aligned along the long axis molecular that is responsible for the strong anisotropy. 97
The 5CB molecule is particularly important because it is chemically very stable and has a liquid crystalline phase (nematic phase) at room temperature. 98 (figure 2.30)
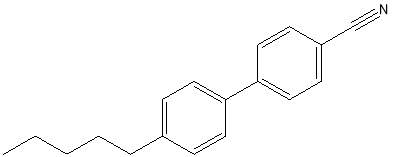
Figure 2.30
2.5 Polarized Optical Microscopy
Polarized optical microscopy usually represents the first useful technique to investigate the presence of liquid crystalline face as well as the miscibility between two different compounds. The natural light oscillates on different frequencies that correspond to the colours of the spectrum, these oscillations occur on all planes perpendicular to the direction of light wave propagation. When the natural light pass through a polarizing filter, this selects the waves according to the plane of their vibration. The light that results, remaining composed of waves at various frequencies, but vibrates only on one of these plans. The polarized light microscope is equipped with a device that filters the white light through two different polarizing filters. The first one is situated between the light source and the sample, the second is located between the sample and the objective. The two polarizers are oriented relative to one another, so that, if the first lets through only the vertical oscillations, the second that is rotated by 90 ° compared to the first, let pass only the horizontal oscillations. If a sample is not optically active, the vertically polarized light passed through the first filter would be completely obscured by the second. Many samples like liquid crystal have the characteristic to be birefringent. The birefringent material deviate the polarized light passed through the first filter and divided it into two radiations that oscillate at different frequency with a plane rotated by 90 ° to one another. In this way the analyser filter is achieved by a radiation in which still present an horizontal component, and the light that pass through appear coloured, because the phenomena of interference between the two different frequencies of light.
Using this technique at room temperature, no useful images were derived from investigation, thing that exclude the presence of visible typical patters due to the existence of nematic or smectic phases typical of liquid crystal.99
Although many liquid crystals materials may not always be in a liquid-crystal phase, like for instance the thermotropic liquid crystals, it was possible exclude the existence of this behaviour in the range of temperature from -70 to 25 oC, performing some DSC experiment.
2.6 DSC analysis of pure Cyrene
In order to investigate the chemical physical behaviour of Cyrene, light polarised microscopy and DSC and MDSC were used to investigate these solvent samples.
The Differential Scanning Calorimetry is a technique that measures the heat flow and the temperature associated with transitions of the material subjected to heating in a controlled atmosphere. 100
This analysis technique allows obtaining a large number of information like for instance transition temperatures, the degree of crystallinity, purity, the specific heat, and the endothermic or exothermic transitions peaks. Inside the apparatus, it is put two aluminium capsules, thermally isolated between them, one containing a material that have to be characterized and the other acts as reference. A computer adjusts the flow of heat, between two crucibles in which are positioned the two capsules in order to equilibrate their temperature. When, the temperature varies as effect of some transitions that takes place in the material, the crucible containing the sample generates a flow of heat endothermic or exothermic, and the computer records these flow changes and adjusts the heater trying to maintain it constant respect to the reference. Normally the analysis, are performed in an inert atmosphere, (usually nitrogen) in order to avoid possible oxidation of the sample, which could distort the detection of the transition phenomena.100
The choice of the type of capsule, hermetic or not, its size and material, as well as the method of analysis are decisive for the correct interpretation of the experimental data. We have use for the analysis samples of 13-14 mg and aluminium pan with hermetic lid provided from TA instrument. (Fig 2.31)
. 
Figure 2.31. TA Instruments Q2000 using for the DSC analysis
The transition from amorphous solid to crystalline solid is an exothermic process and in the DSC curve is shown as an upwards peak. When the temperature rises and the sample reaches its melting temperature, is shown a peak downwards in the thermogram related with this endothermic process. The glass transition is a kinetic phenomenon that is measured in the heating run. The measured value of the glass transition depends on many factor like the cooling rate, experimental conditions, and from the thermomechanical history of the sample. The lower the cooling rate, the lower is the resulting glass transition temperature.
The consequence is that the value of its temperature depends on the measurement conditions and cannot be precisely defined. In many cases, an enthalpy relaxation peak is observed that overlaps the glass transition. This depends on the history of the sample. Sometimes the physical aging below the glass transition leads to enthalpy relaxation.100-103
The glass transition appears as a step in the DSC curve and shows a change of the specific heat capacity, Cp, from the solid to the liquid phase.
Cold crystallization is an exothermic crystallization process. It is normally observed when a heating sample that has previously been cooled very quickly, has had no time to crystallize. Below the glass transition, molecular mobility is severely restricted and cold crystallization does not occur. Melting is the transition process from the solid to the liquid state. It is an endothermic process and occurs at a defined temperature for pure substances. This characteristic is used for the identification of a specific substance or for the determination of its grade of purity. During this process temperature remains constant and the heat required to change of state is known as the latent heat of melting. 104
In this work, the differential scanning calorimetry was used to observe the phenomena of crystallization and melting of Cyrene not reported in literature.
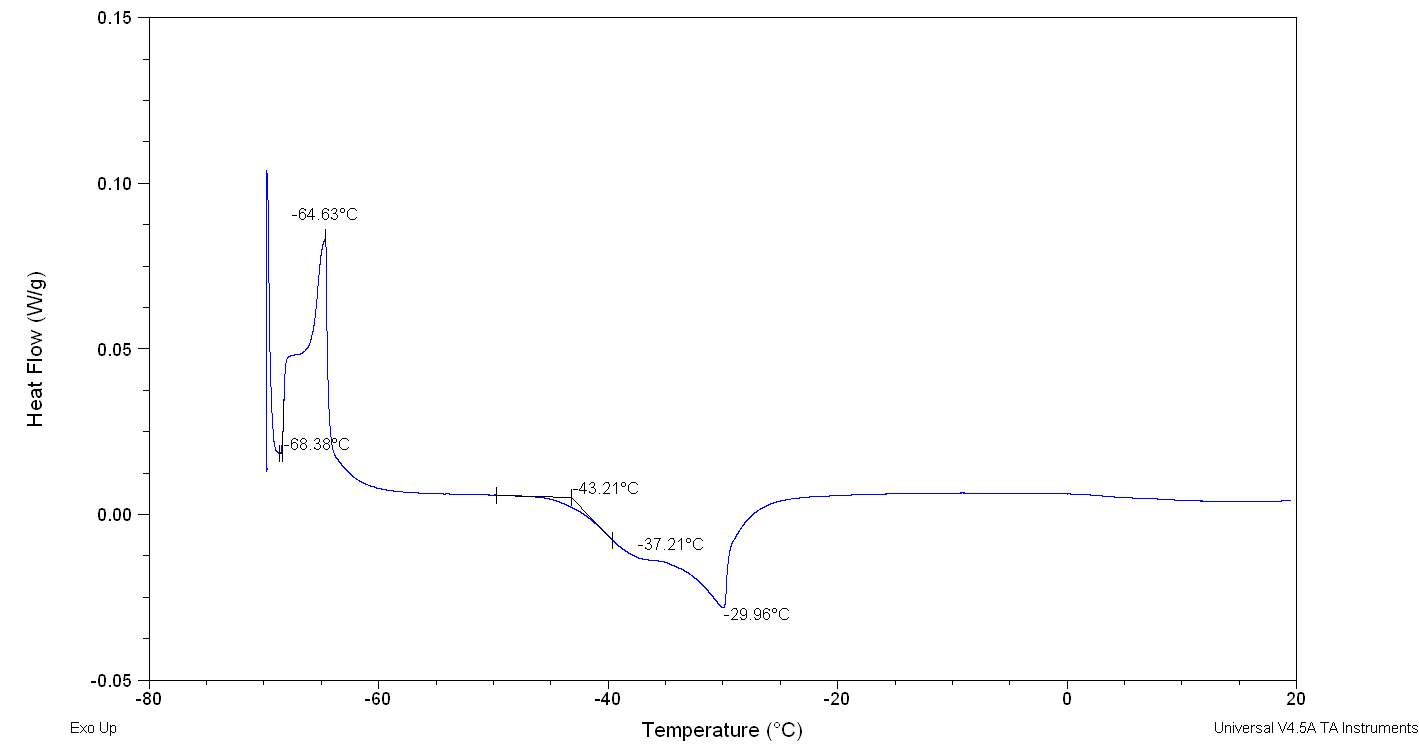
Figure 2.32
The figure 2.32. show only the last heating cycle in which is possible notice the possible amorphous behaviour of pure Cyrene. Although is not possible see the peak of the glass transition, that should be at lower temperature than 70o C , that is the working limit temperature of the instrument, it is evident the presence of an exothermic peak at -64,5oC that correspond to the cold crystallization of the samples , it results formed by at list two separate peaks . The fact that in not evident the glass transition temperature further complicate the analysis because a wide physical properties change at glass transition temperature , as for instance the specific heat capacity Cp , or the dielectric constant. As we can see from the figure the melting peak consists in two peaks, whose relative intensity depend from the thermal history of the samples. The general behaviour is in line with an amorphous material in which are present more than one form of possible crystals. Cyrene could shows a polymorphism in the experimental condition. See figure 2.33
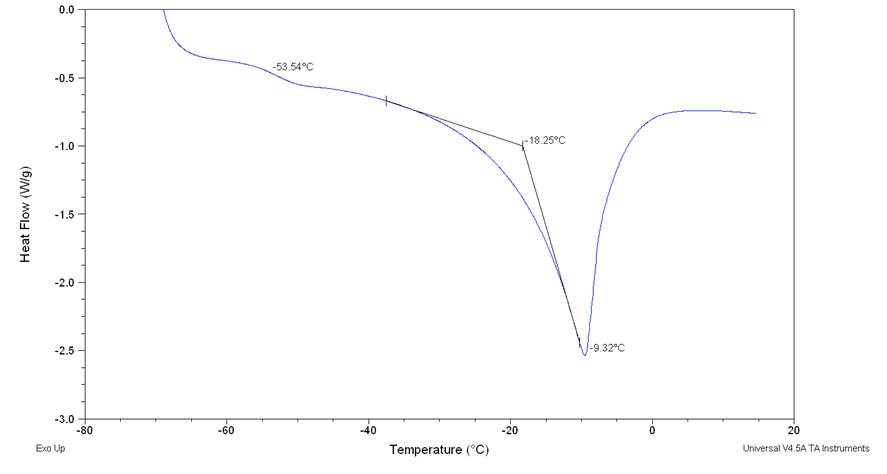
Figure2.33
From the figure is possible notice the absence of cold crystallization wen a lower cooling rate is performed and no other peaks relative at other phase transition of were observed. 105
From the data above presented, it could be take it as almost certain, that Cyrene does not shows a long range order like in liquid crystal ,in fact the correspondent transition peak are absent. This lack of long range order in Cyrene solution is also shown in the SAXS experiment reported in the follow chapter.
3 Cyrene and water solution
3.1 The Water Molecule and its liquid structure
In the molecule of water, the hydrogen atoms are bonded to the oxygen atom through two of the four molecular orbitals with sp3 hybridization. the overall geometry of the molecule is tetrahedral , with two of the sp3 orbital remaining not involved in any bond. Because this, the geometry is slightly distorted ,and the angles between bonds that in a pure tetrahedral molecule should have a value of 109.47° is redused at 104.5 ° because of the greater space occupied by the molecular orbitals containing electronic doublets. As well known , the oxygen atom has a higher electronegativity than the hydrogen atom and the O-H bonds in the water molecule is polar, with a negative partial charge on the oxygen atom and a positive partial charge on the hydrogen atoms. This structure and its polar character are responsible for the particular chemical physical characteristics of water ,In fact properties like high melting and boiling points, , high specific heat and negative thermal expansion coefficient , can be explained in terms of hydrogen bonding interaction. 1
We have to remember that hydrogen generally shows a remarkable directionality . In fact hydrogen bonding in water shows strong directionality due to the fact that oxygen atoms with its electron pair orbitals behave as hydrogen bond acceptor wile the hydrogen atoms act as hydrogen bond donor. The formation of an hydrogen bonding through the interaction between ,an hydrogen atom of a O-H bond of a molecule ,with the oxygen atom of another water molecule , generally shows a OH⋅⋅⋅O bond angle of 180° . In liquid water, the Hydrogen bond energy is about 1.32 kcal/mole,2but its value depend from many factor as for instance , from the orientation and the position of other hydrogen bonded molecules, their bond length and angle , and temperature. 3 A wide range of techniques were used in order to describe the real structure of water,4 for instance using infrared and Raman spectroscopy or X-ray and neutron scattering through which It was noticed that the structure of liquid water is dynamic, 5,6and its properties are determined by a fast rearrangement of the molecules , this is due to the fact that broken Hydrogen bonds are unstable , and they can survive only for very short times. Many studies sugest that In liquid water a short range structure is present , in which at least 4 molecules are assembled in tetrahedral shape, but the apparent number of molecules appear larger in the second coordination shell.7,8,9
During the years many type of models were proposed in order to discover the real structure of the liquid water , untill now no one alone is capable to explain estensively the property of water .The principal models that describe the water structure are , the continuum model , mixture model, and statistical thermodynamic model . The continuum model , describe the hydrogen bonding interaction in liquid water like a continuous net in which the interaction never been broken, in which the prevalent structure of water depends from the temperature , because the consecutive change of hydrogen bond length and energy.
In the mixture models instead structure water consists of two different zone , in one is present an ordered ice-like structure and in a second a less order structure. the Statistical Thermodynamic Model instead,10,11 water is composed of small, quasi spherical clusters, in which non-bonded water molecules filling the space between clusters. Other water molecules with three two or one hydrogen bonding can be found on the periphery of these clusters. The latest studies sustein the suggestion that in liquid water are present two different region , one with a low density in which a tetrahedral shape structure is dominate , and the other one that shows an high density in which interstitial water is present forming less ordered structures.11
3.2 Cyrene – water system
Cyrene has a carbonyl functional group , and like other ketones or aldehydes , in the presence of water forms a geminal diol , which is in equilibrium with the ketone form according to the following general reaction (Figure 3.1).
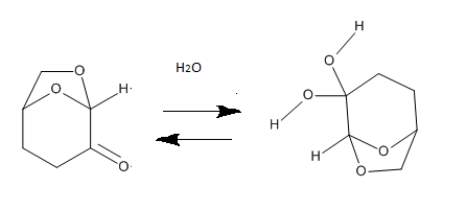
Figure 3.1. Equilibrium between Keto-diol form of Cyrene in water
It has been demonstrated that, in the presence of an acid or a base, water react rapidly to the carbonyl group of aldehydes and ketones establishing a reversible equilibrium with a hydrate form. It were proposed two different mechanism different for the hydration reaction in both basic and acid solution. 12 Figure3.2, 3.3
Hydration base catalysed reaction mechanism
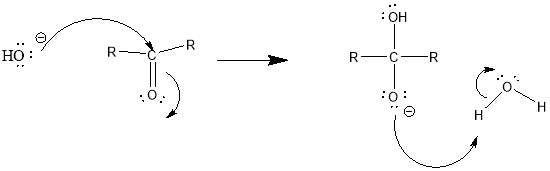
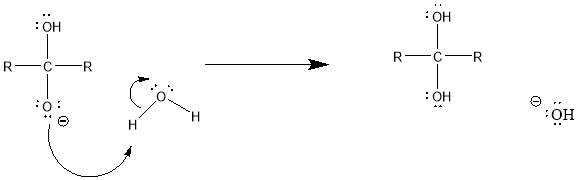
Figure 3.2
Both water and hydroxide ion are nucleophiles ,but because HO – is much more nucleophilic than H2O, even at low concentrations reacts with the carbonyl much faster than H2O. 13
Here the OH– act as catalyst facilitating the establishment of the equilibrium, in fact although OH– is consumed in the first step of the reaction , it is regenerated in the second step, without affect the equilibrium between the ketone and its hydrate form.
Hydratation acid catalysed Reation
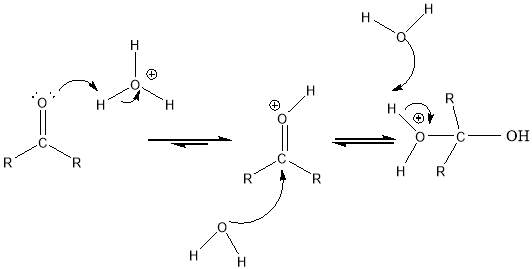
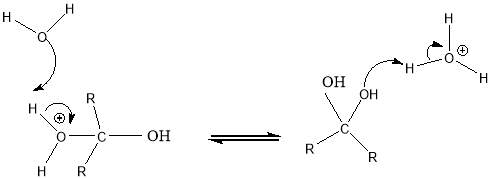
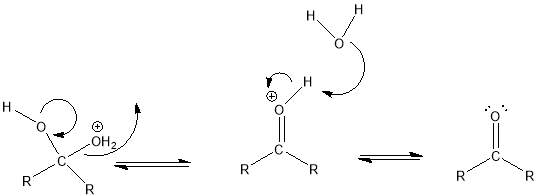
Figure 3.3.
Generallyhydrates form of ketones are present only in a small fraction in their mixture of water solutions. Can be cited for instance the case of the formaldehyde solution in which the hydrate form is dominant , while in the case of the acetone solution the hydrate form is very small. However the hydrates of some ketone are stable enough to be present in high concentration , even if as told before generally the hydrate form of aldehyde are more stable than the germinal diol of many ketones, in both cases ,the reaction is normally very fast . However several methods have been designed in order to calculate its rate. Like for instance the UV.14-20.
Furthermore through 1HNMR analysis it is possible in principle determinate the ratio between the ketone form and the hydrate , and calculate the value of the dissociation constant.
Because the reversibility of the reaction and the relative instability of many hydrates form of ketones , the isolation of the germinal diol is difficult. In fact removing water from the reaction in order to isolate the germinal diol form can convert the hydrate form in the ketone. For these reason the isolation of the germinal diol of Cyrene is very difficult. Only few hydrate form are stable enough to be isolated , for instance the germinal diol of the tricloroacetaldehyde , it is due to the strong stabilization effect caused by the interaction between the hydrogen of diol and the Cl atoms.
3.2 general factors affecting the geminal diol equilibrium
As we said In most cases the resulting geminal diol is unstable and cannot be easily isolated even if for instance , we have seen that in solution like formaldehyde hydrate form is predominant. The equilibrium position in these kind of reactions, is influenced by both steric hindrance and the electronic effects of substituent groups close to the carbonyl. In the case of the acetaldehyde the stability of its hydrate form could be explained by the fact that it has a weaker π component of its carbonyl bond if compared with the others aldehyde or ketones . Also the small steric hindrance of the hydrogen atoms, has an important role to favour the addition reaction of water. If we compare the small hydration of the acetone, we can say that this is due to the stabilizing effect of the electron-methyl groups on the carbonyl double bond. In fact , electron donating alkyl groups stabilized the partial positive charge on the carbonyl carbon and decreases the amount of geminal diol product, also its steric hindrance obstacle the addiction of water. The alkyl groups, therefore, both for electronic and steric effects, increase the stability of the carbonyl respect to the germinal diol form , making the addition of water unfavourable. To the contrary , as shown for the tricloroacetaldehyde, the addition of strong electron attractor groups in alpha destabilizes the carbonyl and tends to form stable geminal diols. However the order of reactivity of the cyclic ketones suggests that the release of internal strain due to the formation of hydrate is an important factor in that influence the rate of hydration. Cyclopropanone, for instance , exists only in its hydrate form and its O-C-O angle measure 1100.21
In order to describe the behaviour of water-Cyrene system a wide range of experiment were performed. A series of FTIR spectra of Cyrene solution in water and D2O at different dilution were done . Figure 3.4
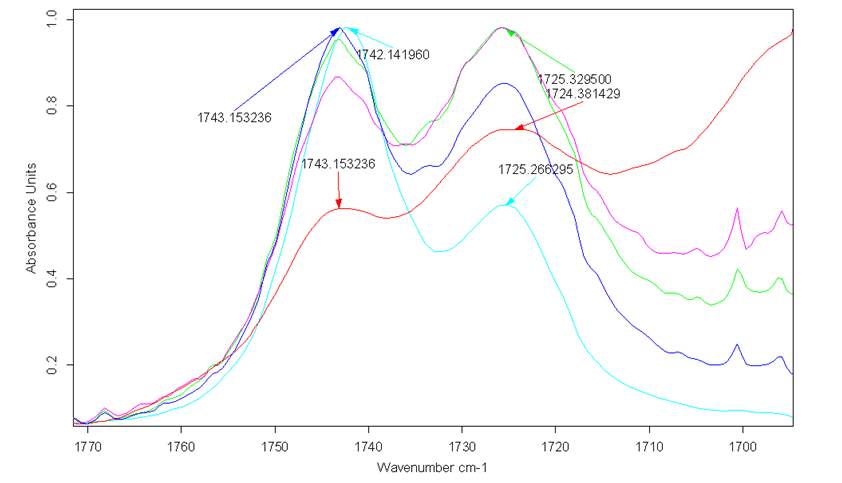
Figure 3.4.
Fig trend of the bands in aqueous solution in the carbonyl zone : in light blue Cyrene 100% ,in blue Cyrene 80% , in green Cyrene 70%, in purple Cyrene 65%, in red Cyrene 50% .
In the figure is possible to see the trand of the carbonyl bands with the growing dilution, all the bands were normalised on the first peak . In particulr it is possible underline that with the addition of water the relative intensity of the carbonyl bands change strongly . The first peak decrease and the second one increase becaming wider as effect of the formation of hydrogen bonding between water and Cyrene molecule. Have to be stressed that the second band is due to the formation of a wide range of hydrate forms involving the C=O . It was not possible do a sotisfactory fitting because the complessity of the behaviour with the dilution. Nevertheless, because it can not be osserved in the spectra an isosbestic point , the formation of the dublet involve more than two species, conventionally monomer and hydrates form of carbonyl. Other part of the spectra were studied, for instance the fingerprint zone , but because its complessity due to the contemporary presence in the solution of the geminal diol form , it was not possible to find a clear indication of the possible structure or interaction of bouth, Cyrene and geminal diol form . In order to better investigate this behaviour it should be necessary to use Raman spectroscopy or far infrared, as well as the correct band assignment. Although above the dilution of 50% in weigth , bouth peaks were covered by the broad band of water making difficult the interpretation of the spectra, It was possible follow the trend of the carbonyl doublet studing the solution of Cyrene in D2O. (see figure 3.5)
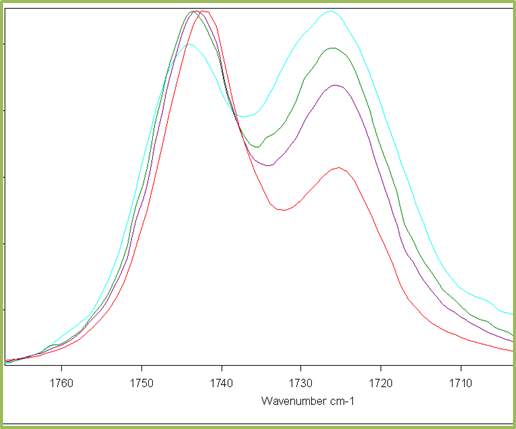
Figure3.5. trend of the carbonyl bands of Cyrene in D2O at different dilution . In red 100% Cyrene, in blue Cyrene 65% in weight
In particular the ratio between the bands increase until the loss of signal with the increasing of dilution. It was always possible distinguee two bands, the second one about 1725 cm-1 wider and higher then the first one. In order to determinate the composition of Cyrene , and germinal diol in solution it was crucial the investigation by NMR in various concentration in both , D2O and water solution. (Figure 3.6.)
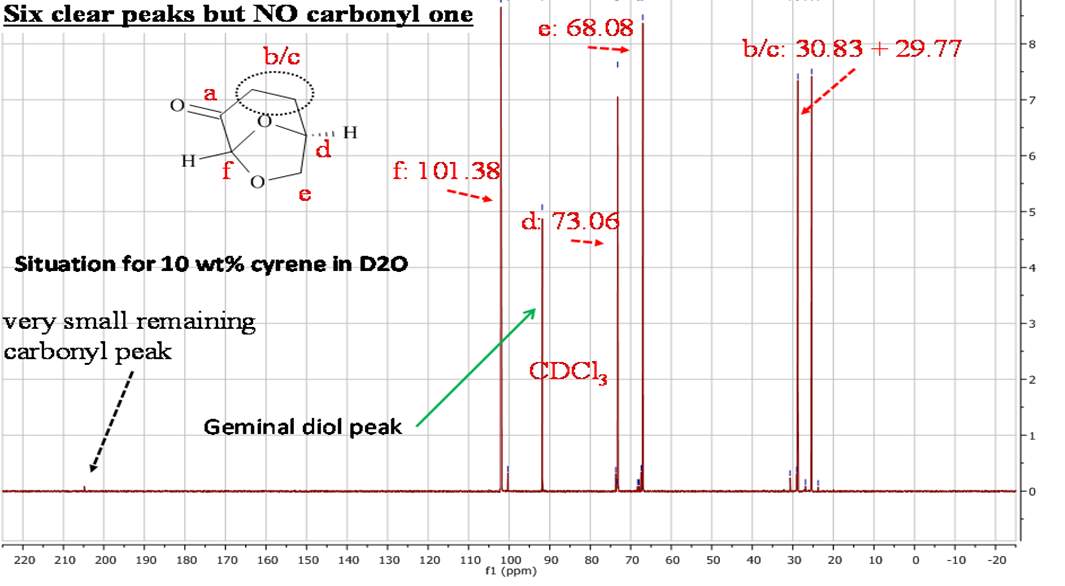
Figure 3.6. 13CNMR of 10% in Weight of Cyrene in D2O
Figure2.6. highlights a small peak relative to the carbonyl, and there is an intense peak for the geminal diol, a clear sign that the equilibria at this concentration of Cyrene in D2O has moved to the diol form. It was therefore possible by integrating peaks of the 1HNMR for the D2O -Cyrene system , to calculate the relative ratio of moles of diol for each mole of Cyrene present in solutions at different concentrations of D2O (fig 3.7). Using this method, it was possible to show the relative molar ratios of Cyrene, Geminal Diol (OD)2 and free D2O as a function of initial weight percentage Cyrene in D2O (table 3.1).
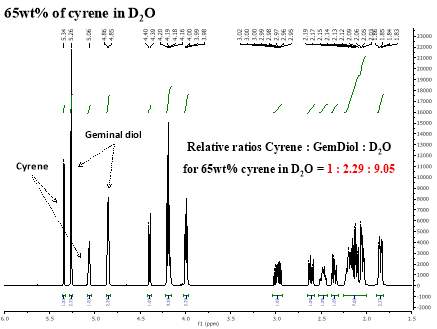
Figure 3.7. 1HNMR of 65%Wt Cyrene in D2O
In figure are shown the peak relative at Cyrene and Its hydrate form
Table 3.1. Moles of geminol diol and free H2O per every mole of Cyrene present in different water solutions
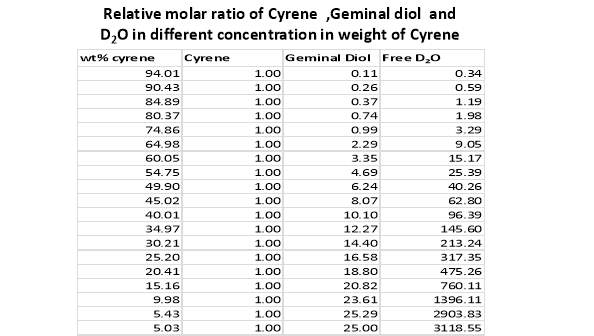
These data were used to determine the general trend and behaviour of Cyrene in D2O plotting the experimental data (Figure 3.8.). The same analysis was then conducted for Cyrene in H2O (Table 3.2).
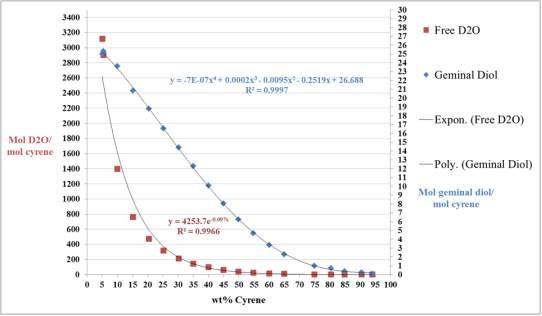
Figure 3.8. the figure shows the moles of germinal diol and free D2O in different Cyrene-water solution
Table 3.2. Moles of germinal diol and free H2O per mole of Cyrene present in different concentration of Cyrene-water solution
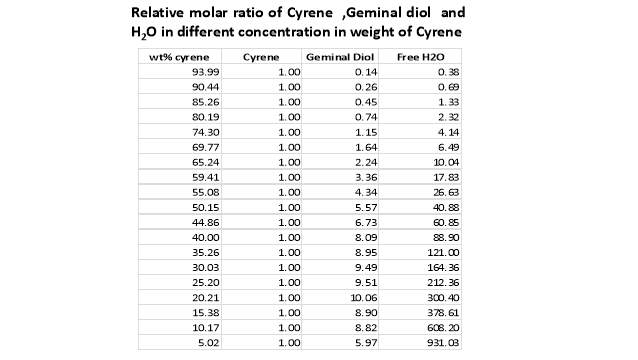
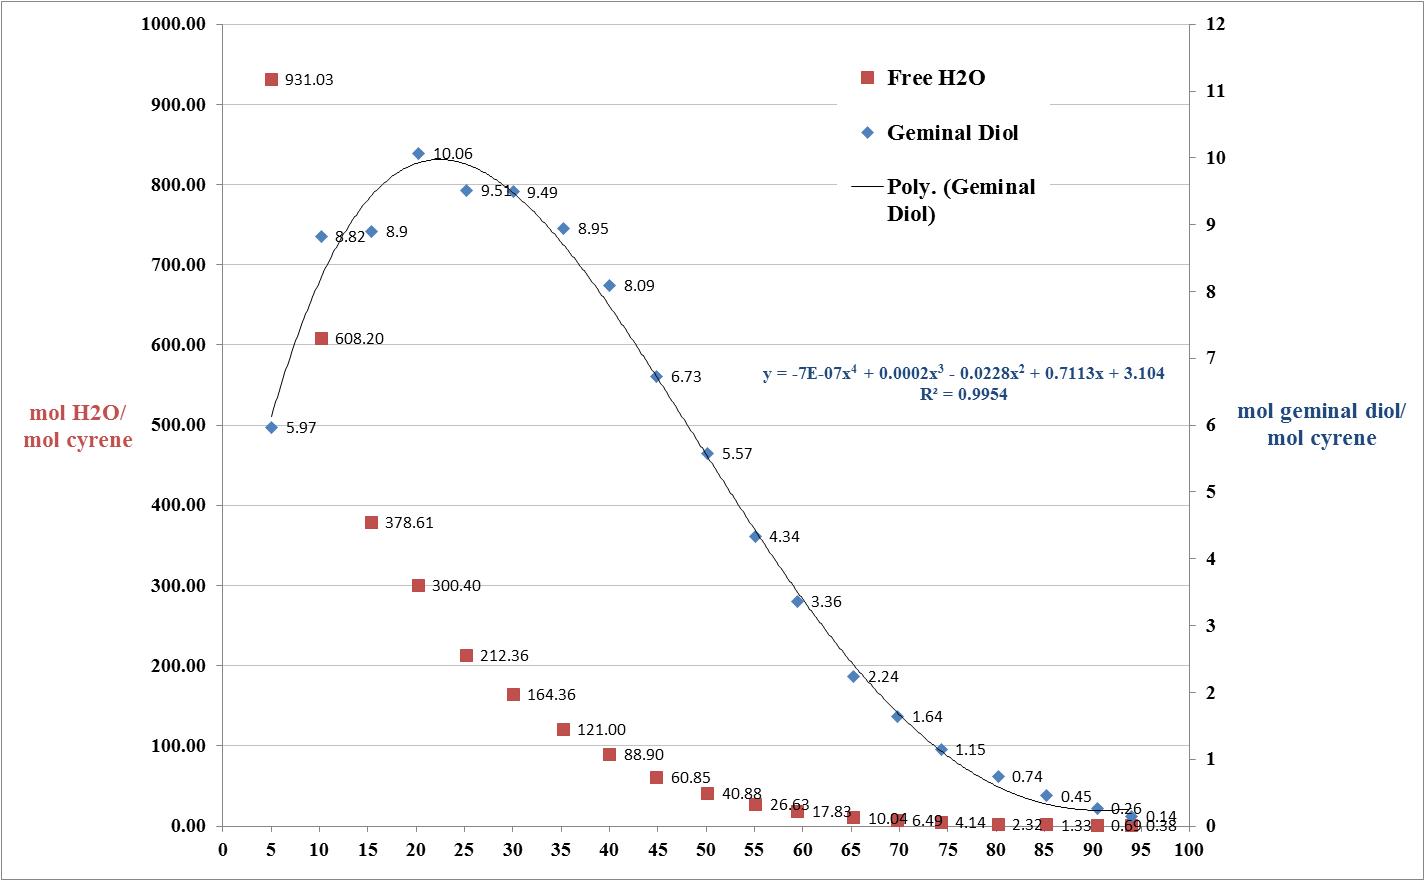
Figure 3.9.
As can be seen from figure 2.9., the behaviour of Cyrene in H2O looks very different and exhibits a maximum, which is not present in that obtained for the Cyrene-D2O system. In fact, if the behaviour of the geminal diol is compared, two different systems are obtained for each mole of Cyrene (figure3.10).
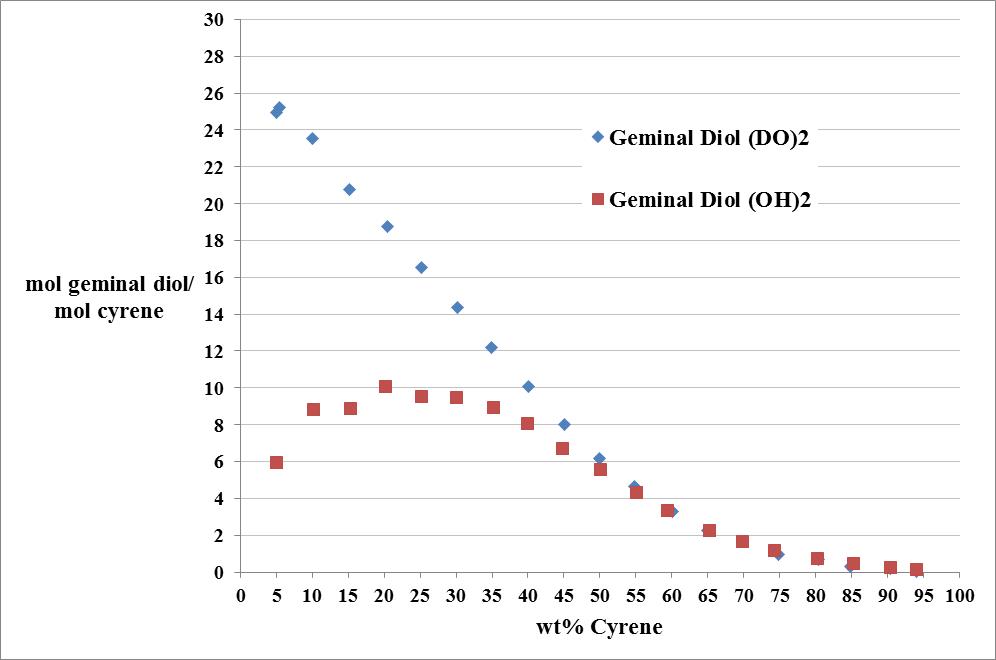
Figure 3.10. Comparison between the plotted data from the solutions of Cyrene in D2O and H2O in different weight concentration
Figure 2.10 .highlights two contrasting trends, which can be explained by the fact that the D2O forms the more intense hydrogen bonds with the Cyrene that would shift the equilibrium toward the formation of the diol. It should also be stressed that the formation of the geminal diol and its relative equilibrium with the keto form has important consequences on the behaviour of Cyrene in aqueous solution. In fact, thanks to the presence of two hydroxyl groups in place of the carbonyl, the Cyrene is able to interact in a more complex way with its chemical environment, forming more easily interactions with other molecules present in solution through hydrogen bonds. The equilibrium between the ketonic form and the diol form, can be used in theory, to increase the solvating ability of the Cyrene, in all those situations in which the formation of hydrogen bonds favours the dissolution of the substances in solution, for example in the solubilisation of biomass. This aspect of the research is actually object of an article under writing, but it not will be included in this thesis. Here it will be reported only few experimental data as example.
Other 1HNMR at different temperature were performed in order to understand the trend of the equilibrium between ketone form and the germinal diol form with the changing of temperature. Fig 3.11-3.12
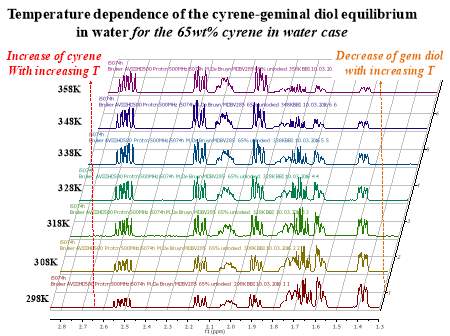
figure 3.11. 1HNMR of 65%Wt Cyrene in H2O at different temperature
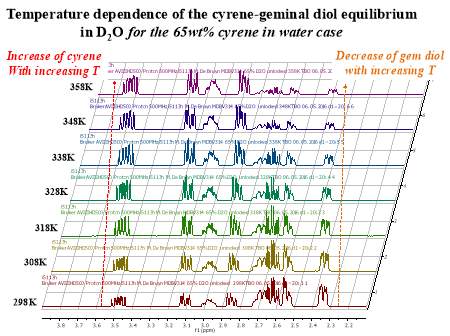
figure 3.12. 1HNMR of 65% Cyrene in D2O at different temperature
both the figures relative to the 1HNMR experiment in H2O and D2O show that there is an increment of the Ketone form when the temperature increase. It is well known that the hydration ration equilibrium is very sensitive to temperature.22
Although the collected data in theory are enough to determinate the constant of equilibrium for this reaction , this could be done only by thermodynamic way , due to the rapidity of the reaction. However as shown from the curve in figure 2.10 , the kinetic of Cyrene in water has a very complex behaviour , and could be very difficult to determinate because it have to involve the formation of clathrate, as is shown clearly from its (non linear) dependence of the association constant Kh of germinal diol-Cyrene with the concentration of water.23 a
Kd=Cyrene KetoneGeminal Diol =1Kh
eq.3.1
3.3 Density and viscosity measurements
It was performed measurement of the density in all the concentration range of Cyrene-water and Cyrene D2O solutions . Figure 3.13
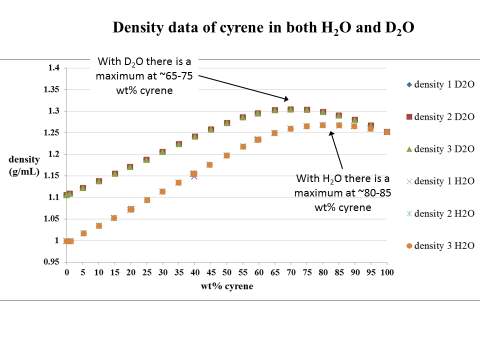
Figure 3.13. shows a comparison between the trend of the density in the Cyrene solution of D2O and water
the figure point out the strong deviation from the ideality in behaviour in both the solvent. In particular we have to stress the presence of a maximum in density that should correspond whit the formation of same kind of structure ( probably clathrate) at 80-85%wtg concentration. This trend , in the current state of my knowledge , is not been reported in literature for any common green solvent utilised . Notice that in D2O the same maximum is shifted at lower concentration value , may be due to the solvent effect , related at the stronger hydrogen bonding interaction present in D2O.23b
the same position of the maximum was found for the peak shown in the viscosity graph of
Cyrene-water solution. figure 3.14
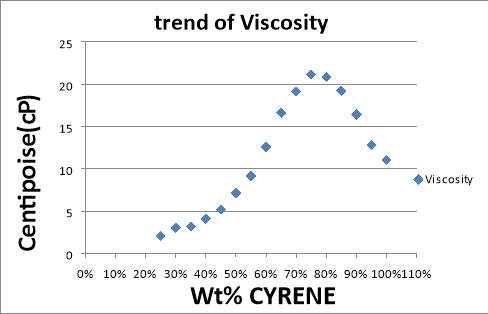
Figure 3.14 show the uncommon data of viscosity values.
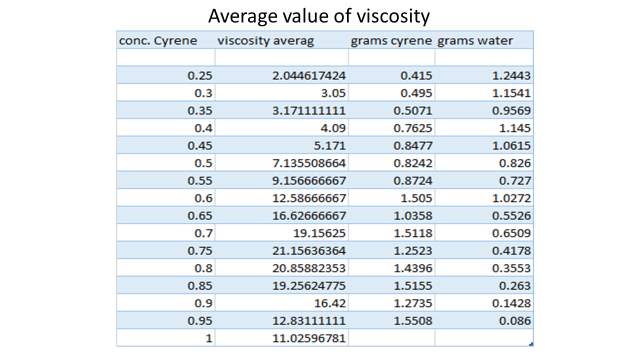
Table 3.3
Table2.3 in table are reported the average of value for the viscosity data
SAXS and DLS experiment Experiment
SAXS analyses for aqueous solutions of Cyrene and in D2O were obtained in an attempt to observe the eventual formation of structures in these solvents (Figure 3.15.).
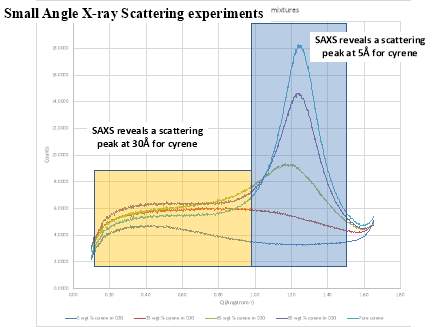
Figure 3.15. SAXS for Cyrene in D2O
In light blue pure Cyrene, in violet 95wgt% Cyrene, in green 65wgt% Cyrene , in red 35wgt% Cyrene, in blue 5Cyrene wgt%
From the figure is possible see the presence of a intense peak related with the normal distribution of molecule of Cyrene in solution in different concentration . This scattering peak shows structure with an average of dimensional size of 5A0 , compatible with a single free molecule of Cyrene. At low concentrations of Cyrene in D2O, the figure x shows a peak where typically a flat line would be expected, this result is constant with the possible formation a structure between the Cyrene and D2O. However, it is easy to hypothesise the formation of complex interactions between Cyrene and water, with the consequent formation of structures.(Figure 3.16.)
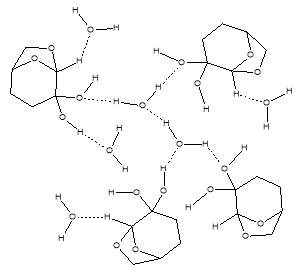
Figure 3.16. A tentative model of how the Cyrene/geminal diol aggregates in water (in very dilute solution).
Dynamic light scattering experiment were made in order to confirm the existence of structure in very diluted Cyrene water solution. Figure 3.17
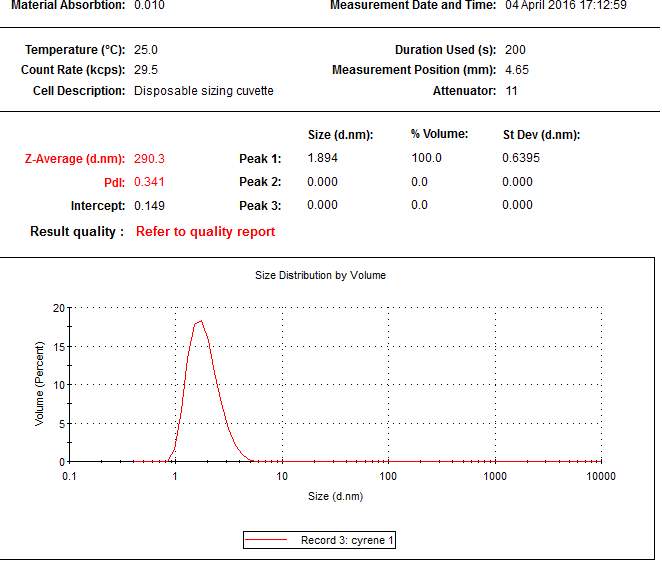
Figure 3.17
At this extreme dilution as we can see from the previous experiment , only geminal form of Cyrene id predominant , so the possible presence of structure is imputable to the interaction between this form and water . As we can see from the figure a clear peak shows a size distribution around 2 nm that is in accordance with the result of SAXS experiment . This result is compatible with the presence of structure of about 20-30 Ao . Nevertheless , more experiment have to be done to confirm this result , due to the not optimal poly dispersion of the sample .
3.4 DSC experiment of Cyrene water solution
In the determination of the method for the DSC analysis for Cyrene , it was chosen the program with the heating –cooling rate that allow to have the better data in the large range of concentration of Cyrene- water solution. This because the physical behaviour of Cyrene-water change drastically with the temperature. For all the data reported was used the following method:
1) equilibrate at 20°C,
2) Ramp 5°C/min to -70°C,
3) Ramp 15°C/min to 20°C (x 2 times)
The method above allow to have useful data from very diluted solution to about 45%wgt of Cyrene-water solution , reducing at the same time the super cooling effect of water. Figure 2.18
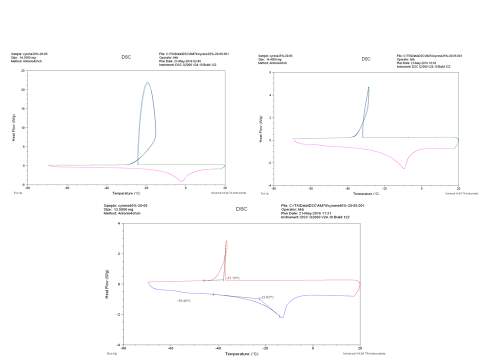
Figure 3.18 Same example of the DSC in the range of 50%wgt concentration
From the DSC thermogram was possible , using the function onset available in the for the instrument, calculate the value of the melting point depression .figure 3.19
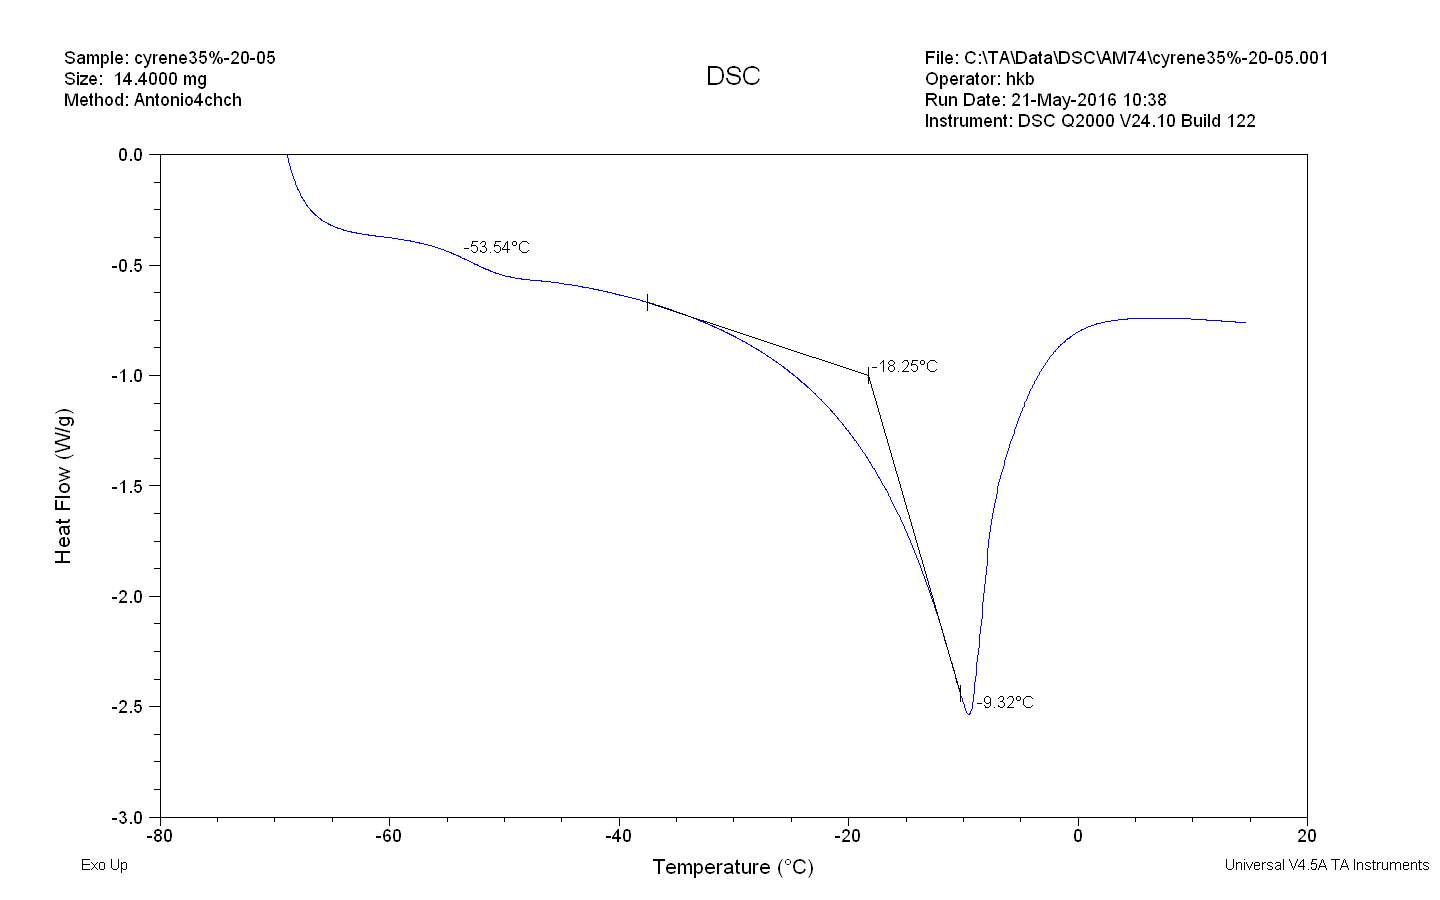
Figure 3.19 Example of onset calculation using the specific function available in the software of the TA Instruments DSC Q2000
The same value were compared with the one obtained by using a fibre optic (SAIREM miniflow) for samples at different dilution , that were first frozen using liquid nitrogen . figure2.20
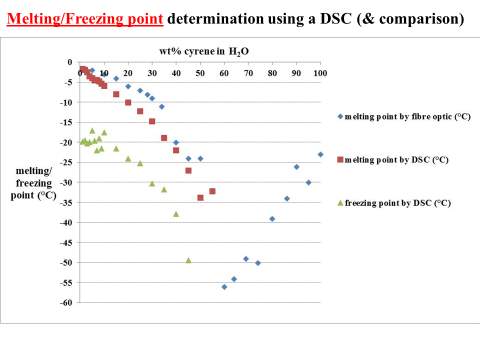
Figure3.20
fig the trend of melting and freezing point obtained using different method
Is possible to see as the value obtained using DSC calculation from the melting point , are really close to the one observed using the optic fiber during the melting of frozen solution .
It is possible to see that the value of freezing point are shifted at lower temperature, due to the super cooling effect of the water. From all the experimental data is possible observe the presence of an eutectic point close to -550C.
Have to be report ,that during the melting of the Cyrene-water solution at certain concentration, was possible observe the existence of a uncommon phenomena like the formation of a kind of ice with a consistence similar to the toothpaste , with a very high viscosity. Figure3.21
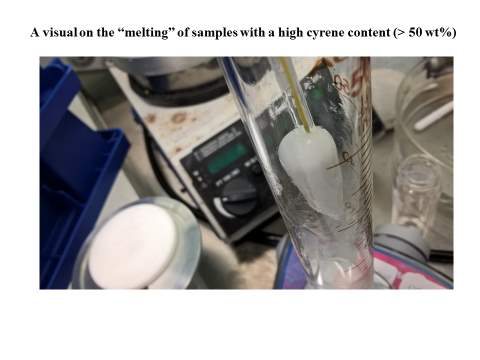
Figure 3.21. shows the consistency of high Cyrene water ice.
This phenomena is probably related with the formation of an amorphous system , according with the DSC thermogram , in which is not possible observe any peak relative at freezing or melting.
At this point it was attempt the calculation of the molecular weight of Cyrene using the melting point depression instead to the freezing point depression , obtained by the DSC thermogram recorded in very dilute Cyrene-water concentration. The data of the freezing point depression of Cyrene –water solution were not used because the thermograms shows a supercooling peak for the water at very low concentration.24-26
It was used the follow equation:
ΔT = iKfm Eq.3.2
Where , ΔT is the difference in temperature, Kf is the cryoscopic constant of water = 1.86 °Ckg/mol
And i is the van ‘t Hoff factor in this case i=1, and m= molality of the solution.
The result were not useful , probably because the contemporary presence of Cyrene molecules and its germinal diol form, and because their interactions with water, that make the system not ideal. However it was possible using the DSC data perform the calculation of the activity of water in the system.
Calculation of the activity of water
Using the follow equation and the melting point DSC data it was calculate the value of the activity of water.27
Eq.3.3
lnaw=-ΔHfR (Tf-T)TfT+ΔCfR(Tf-T)T-lnTfT
Eq.3.3
Table 3.4
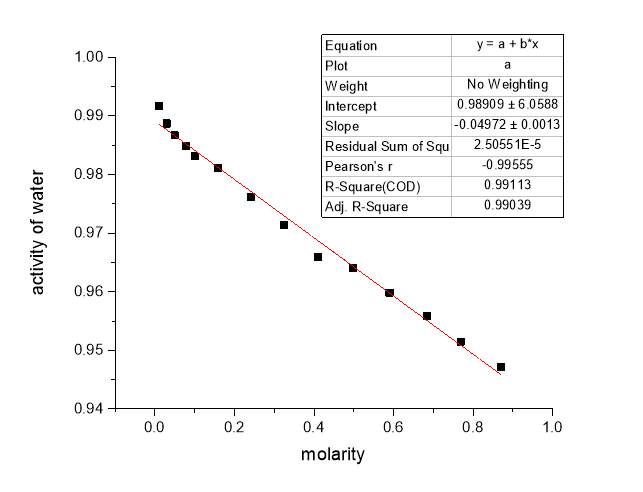
Figure3.22
As we have seen , Cyrene shows an complex behaviour in water, but theoretically it is possible thanks to the collected data, relate the coefficient of activity and melting point depression , to a specific structure, as well as the fraction of water bonded with Cyrene . Certainly many other experiment are necessary in order to confirm the data above reported and clarify the nature of Cyrene water interaction.28-30
References
[1] J. Sherwood, M. De bruyn, A. Constantinou, L. Moity, C. R. McElroy, T. J. Farmer, T. Duncan, W. Raverty, A. J. Hunt and J. H. Clark, Chemical Communications 2014, 50, 9650-9652.
[2] J. H. Clark, T. J. Farmer, A. J. Hunt and J. Sherwood, International journal of molecular sciences 2015, 16, 17101-17159.
[3] P. T. Anastas and J. C. Warner, Green chemistry: Theory and practice 1998, 29-56.
[4] F. M. Kerton and R. Marriott, Alternative solvents for green chemistry, Royal Society of chemistry, 2013, p.
[5] F. M. Kerton, Alternative solvents for green chemistry, Royal Society of chemistry, 2013, ch.1.3
[6] C. Reichardt, Chemical Reviews 1994, 94, 2319-2358.
[7] R. C., Solvents and Solvent Effects in Organic Chemistry, VCH Publishers Weinheim, 1988, p.
[8] A. Buckingham, P. Fowler and J. M. Hutson, Chemical Reviews 1988, 88, 963-988.
1) Dihydrolevoglucosenone (Cyrene) as a bio-based alternative for dipolar aprotic solvents† James Sherwood,a Mario De bruyn,a Andri Constantinou,a Laurianne Moity,a C. Rob McElroy,a Thomas J. Farmer,a Tony Duncan,b Warwick Raverty,b Andrew J. Hunta and James H. Clark*a
2) Opportunities for Bio-Based Solvents Created as Petrochemical and Fuel Products Transition towards Renewable Resources Clark, James H ; Farmer, Thomas J ; Hunt, Andrew J ; Sherwood, James International journal of molecular sciences, 2015, Vol.16(8), pp.17101-59
3) *Anastas, P. T.; Warner, J. C. Green Chemistry: Theory and Practice, Oxford University Press: New York, 1998, p.30. By permission of Oxford University Press.
4) Alternative Solvents for Green Chemistry Francesca M. Kerton RSC, 2009
5) Alternative Solvents for Green Chemistry Francesca M. Kerton RSC, 2009 ch.1.3
6) Chem. Rev. 1594, 94, 231S2358 2319 Solvatochromic Dyes as Solvent Polarity Indicators Christian Reichardt
7) Reichardt, C. Solvents and Solvent Effects in Organic Chemistry, 2nd ed.; VCH Publishers: Weinheim, 1988
8) Buckingham, A. D.; Fowler, P. W.; Hutson, J. M. Chem. Rev.
9) Huyskens, P. L., Luck, W. A. P., Zeegers-Huyskens, T., Eds.
10) D. J. Adams, P. J. Dyson and S. J. Taverner, Chemistry in Alternative Reaction Media, John Wiley & Sons Ltd, Chichester, 2004.
11) G. R. Court, C. H. Lawrence, W. D. Raverty and A. J. Duncan, US Pat., 2012/0111714 A1, 2012.
12) Further property of ionic liquids: Hildebrand solubility parameter from new molecular thermodynamic model M.M. Alavianmehr a , S.M. Hosseini a, ⁎, A.A. Mohsenipour c , J. Moghadasi
13). J. P.lowe, in ,Quantum Chemistry ,Academic Press , second edition ,Chapter13 , pp. 429
14). B. Schrader ,in ,Infrared and Raman spectroscopy methods and applications, VCH , first edition,1995, pp.39-41
15) Mueller fundamentals of quantum chemistry KLUWER ACADEMIC PUBLISHERS 2001)
16) herzberg, molecular spectra and molecular structure vol 2 1988
17) D.Griffiths, introduction of quantum mechanics
18) herzberg ,molecular spectra and molecular structure vol 1 pag 75, 1988
19) High resolution spectroscopy second edition wiley pag 172
20) Banwell fundamentals of molecular spectroscopy pag 77 1983
21) hollas high resolution spectroscopy pag165
22) (from Wikipedia) draw by Mark Somoza March 26, 2006
23) High resolution spectroscopy second edition wiley pag 246
24) see for instance the symmetry of the molecule of water Banwell fundaments of molecular spectroscopy pag 94
25) see the examples of water, influence of rotation on the spectra of polyatomic molecule. Banwell, Fundamentals of molecular spectroscopy 1983, pag 95-97)
26) hollas , high resolution spectroscopy second edition wiley 1998
27) Herzberg molecular spectra and molecular structure vol 1 1988 ,pag14
28) Herzberg molecular spectra and molecular structure vol 2 pag 216 1988)
29) Hollas High resolution spectroscopy second edition wiley Pag 248)
30) Hollas High resolution spectroscopy second edition wiley Pag 249
Cite This Work
To export a reference to this article please select a referencing stye below:
Related Services
View all


Related Content
All TagsContent relating to: "Sciences"
Sciences covers multiple areas of science, including Biology, Chemistry, Physics, and many other disciplines.
Related Articles

DMCA / Removal Request
If you are the original writer of this dissertation and no longer wish to have your work published on the UKDiss.com website then please: