Face Perception: Development, Maturation and Decline?
Info: 12273 words (49 pages) Dissertation
Published: 28th Feb 2022
Tagged: PsychologyMedicine
Abstract
The aim of this study was to investigate if face perception is an ability that develops, matures and subsequently declines with age. There were a total of 30 participants in the project, who were organised into 1 of 3 groups based on their age. Face perception was examined using the Caledonian Face Test which utilizes synthetic faces and involves the subject identifying which of the 4 faces shown is different from the rest. This test quantifies the subject’s face perception ability by producing a threshold of the minimum difference required to discriminate between faces. The results from this study found no statistical difference in the face perception abilities of the three age groups.
Table of Contents
Click to expand Table of Contents
1.0 Introduction and Background
1.1 Face Perception Tests
1.2 Neural systems for face perception
Configural Processing
Holistic Processing
Face Cells
1.3 The inversion effect
1.4 Face perception and Age
Neonates
Children
Adolescence
Elderly
1.5 Evidence of Preservation of face perception with age
1.6 Impairment of Face Perception
Prosopagnosia
1.7 Aims and Hypothesis
2.0 Methods
2.1 Participants
2.2 Preliminary Tests
2.3 The Caledonian Face Test
2.4 Statistics methods
3.0 Results
3.1 Experiment 1 – Effects of Feedback on Face Discrimination
3.2 Experiment 2 – Effects of Age on Face Perception
3.3 Regression Analysis
4.0 Discussion
5.0 Conclusion
References
Appendix 1
1a
1b
1c
1.0 Introduction and Background
Looking at a human face can tell you a lot about a person. Faces indicate the age, gender, ethnic background and state of emotion of a person. They generally all have the same arrangement of two eyes, two eyebrows, a nose and a mouth but amazingly most adults can distinguish between thousands of faces (Diamond et al. 1986). This ability still stands when faces are presented in variations in lighting, viewpoint, expression or hairstyle (Hancock et al.2000; Diamond et al. 1986). Being able to recognise a face and interpret emotional expressions is an important part of day-to-day human interaction. It is a skill that most people take for granted and can perform seamlessly without much thought, yet it requires detailed processing in the brain.
1.1 Face Perception Tests
Face Perception has been investigated for several years by researchers in different fields including psychology, neurology and vision sciences. The ability to recognise faces has been assessed in different ways. Commonly used tests are: the Benton Facial Recognition Test (BFRT), the Warrington Recognition Memory for Faces test (WRMF) and the Cambridge Face Memory Test (CFMT). In the BFRT, subjects are asked to match a face photographs with a target face. The faces are cropped to remove any clothing and only leave part of the hair (Duchaine & Nakayama 2004). However, test faces and the target face are presented beside one another, making it possible to compare and match features such as eyebrows– this doesn’t allow for the subject to use more holistic processing (see later for explanation), believed to be the mechanism used for faces (Duchaine & Nakayama, 2004). Furthermore, a study by Duchaine & Nakayma (2004), found that subjects who had developmental prosopagnosia (an impairment of face perception, see later) can produce results that would be considered within normal abilities in the BFRT.
Secondly, the WRMF test presents subjects with 50 photographs, with each photo shown for 3 seconds. Then, they are shown two pictures at a time and asked to identify which face they recognise, one has been shown before and the other is a new picture. But the photographs contain other clues to identity such as clothing, hair, emotional expression and posture (Duchaine & Nakayama, 2006). These can render the test less sensitive to detecting an impairment of face perception.
The (CFMT) also uses photographs of faces but they have no external cues. There are three different stages to the test and the faces are shown from different perspectives. Again this test involves a forced choice strategy that includes distractor images. The CFMT has been shown to be better at identifying prosopagnosia – Duchaine & Nakayama (2005) found that the CFMT was able to correctly identify 75% of prosopagnosics, compared to 38% classified using the WRMF and 25% with the BFRT.
In this project, the recently developed Caledonian Face Test is used to measurethresholds of face discrimination. It uses synthetic faces which are based on photographs that include the hairline and internal features but exclude external cues like clothing and posture. These faces were constructed by Wilson, et al. (2002) and used by Logan et al. (2016) to develop this clinical test. Four synthetic faces are presented to the subject in a diamond shape (Figure 1).
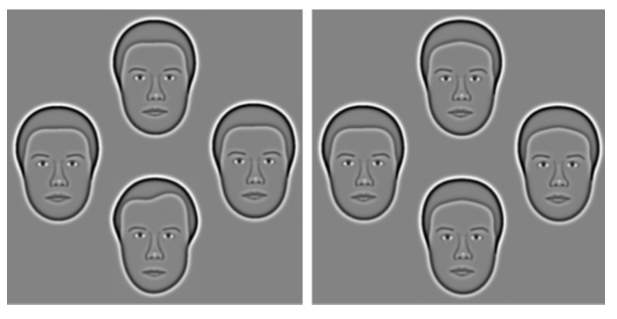
Figure 1 – On the left shows three mean faces (top, right & left) and one target face (bottom). On the right, the difference between the faces is much smaller – mean faces at top, right and bottom with target face on the left (Logan, et al. 2016)
Three of the faces are identical (mean faces) and one is different (the target face). The task is to identify the ‘odd one out’. A specific number of trials are carried out before the results are quantified to form a threshold of the subjects face discrimination abilities.
1.2 Neural systems for face perception
There is converging evidence from functional magnetic resonance imaging (fMRI) studies that there are specific areas within the brain used for face perception (Kanwisher, et al.1997; Liu, et al. 2010; Allison, et al. 2000; Hoffman, et al. 2000). fMRI measures brain activity by detecting levels of oxygen saturation in the blood. When there is increased neural activity in the brain more oxygenated blood travels through active areas (Buxton, et al. 2005). When looking at faces, in humans and macaque monkeys there is a significant increase in blood flow through an area of the temporal cortex called the fusiform gyrus, specifically the fusiform face area (FFA) (Tsao, et al 2006). There is also increased activity in two other areas: the occipital face area (OFA), located in the inferior occipital gyrus and the posterior section of the superior temporal sulcus (fSTS) (Liu, et al. 2010). Figure 2 depicts the increased activity detected with fMRI when a subject views a face stimulus (Hoffman et al. 2000; Haxby et al. 2010). These three face-selective areas can be located in both hemispheres and are thought to have different roles in processing but what they do exactly is not known (Liu, et al. 2010).
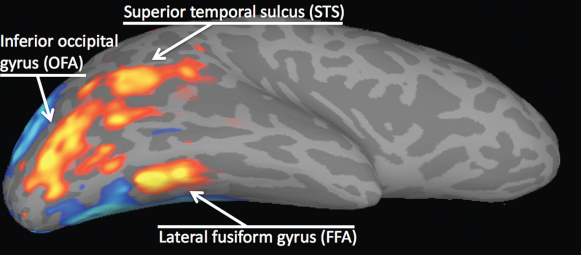
Figure 2 – activity in the three face-selective regions (Haxby et al. 2000)
It is thought that the FFA is more involved in the recognition and identification of faces compared to the other areas and that the fSTS processes facial expressions (Hoffman & Haxby, 2000). The fSTS is also activated by images of the face and body as well as any movement of the eyes, body or hands (Allison, et al. 2000).
Configural Processing
Configural processing refers to processing which focuses on the relationship between face features (Maurer, et al. 2002). It involves three types of processes: the first order relations which recognise that an object is a face by detecting a pair of eyes, a nose and a mouth in the appropriate arrangement (T-shape); second order relations, which process the spacing between face features such as the distance between the eyes; and holistic processing, where the face is seen as a whole (Maurer, et al. 2002; Paukner et al. 2013; Tsao & Livingstone, 2008).
Holistic Processing
Tanaka, et al. (1993) conducted research into how faces are recognized regarding their parts and wholes, with the hypothesis that faces are processed more as a whole i.e. more holistically, than other objects. Results showed an improvement in the ability to identify single parts of a face when they were presented on a whole intact face, compared to when shown in isolation. However, subjects were better at identifying parts in isolation compared to when on a scrambled face. This suggests that the identification process for intact faces differs from scrambled faces and that faces are processed holistically, rather than relying on individual face features (Tanaka, et al. 1993). In another part of the experiment, the recognition of houses was compared to recognition of faces, where parts such as a window were to be identified on their own or in the whole-house context. No difference was found in recognition ability when parts were shown on their own or as part of a house, confirming that faces are processed more holistically than other objects.
Holistic processing of faces is illustrated by the composite effect. This is when the top half of one person’s face is combined with two different bottom halves, creating the impression of two new faces and making it seem as if the top halves are different from each other (Figure 3)

Figure 3 – The composite effect (Susilo, et al. 2013).
But, when a horizontal misalignment is put between the two face halves, then the top halves are recognised as the same face, while the bottom halves are seen as two different face parts (Susilo, et al. 2013).
Face Cells
Studies of macaque monkeys by Wang, et al. (1996) and Bruce, et al. (1981) identified that there are cells in the cortex which respond specifically to a face stimulus. Another study by Tsao, et al. (2006) used fMRI to locate the face-selective regions in two macaque monkeys. Then, by electrophysiology they recorded single units within the face selective regions and discovered that almost 97% of the neurons in these areas were selective to faces. This indicates that face processing is complex and uses very localised areas.
1.3 The inversion effect
Face perception is particularly affected by inversion. All objects tend to be harder to identify when they are presented upside down but faces are disproportionately affected by this (Yin, 1969). A demonstration of his effect is the Thatcher illusion – where the features are inverted on an upside down face. This inversion of features can be very difficult to notice on an upside down face, whereas on an upright face, any inversion of features is obvious (Figure 4).
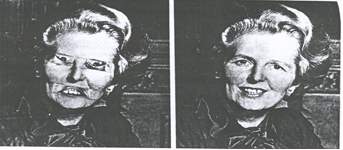
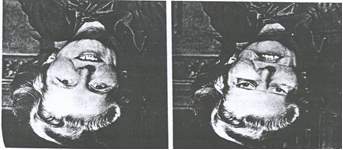
Figure 4 – Thatcher illusion (Thomson, P. 1980). Picture sourced from Horney, D.J. (2001).
The inversion effect is a phenomenon that provides an example of how faces are processed holistically. Inverting faces disrupts configural processing (Maurer, et al. 2002). Furthermore, it makes face perception and discriminating between different faces more difficult (Freire, et al. 2000).
1.4 Face perception and Age
Neonates
Research has shown that from birth, neonates have a preference for face like stimuli over non-face objects and scrambled faces. Experiments by Groen, et al (1975), found that neonates responded with more head and eye movements when presented with a board that had facial features in the correct arrangement on it, compared to when shown one with scrambled features or a blank board. Similar results were found by Johnson et al. (1991). Johnson et al. (1991) also considered that neonates have poorer vision than adults and their ability to resolve detail isn’t as developed. They wanted to investigate whether infants were only attracted to a ‘face’ because it has three high contrast areas i.e. the face features, rather than because they could resolve these features. At birth, visual acuity (VA) is about 1 to 3 cycles per degree (Daw, 2006) or 6/300 Snellen (Simmers, A. 2015). Results revealed neonates preferred to look at face features over three high contrast squares in the position of the eyes and mouth, indicating their attraction to faces isn’t related to poor VA. These experiments contribute to the notion that face perception is present from an early age and that new-borns are sensitive to the arrangement and detail of a face.
Children
In a study by Lawrence et al. (2008), subjects undertook the WRMF test. In the analysis the WRMF score was compared to the age of each subject and it was discovered that from the age of 6 there is a linear relationship of improvement in face recognition up until the age of 16. However, a plateau in the score was noted between 10 and 13 years before further improvement.
A study by Carey & Diamond (1977) suggests that holistic processing develops slightly later in childhood and that children under about 8 use the facial features more for recognition. As mentioned previously, inversion of faces is known to reduce recognition abilities, more so than inversion of other objects (Yin, 1969). However in Carey & Diamond’s (1977) study, they found that 6 year olds were unaffected by the effect of inversion on recognising faces, while inversion did reduce the face recognising abilities in 8 and 10 year olds.
Adolescence
Germine et al. (2010) investigated whether the ability to recognise faces continues to get better after childhood and into adolescence. They tested the ability to learn and recognize unfamiliar faces and found that face recognition abilities increased rapidly until age 12 when there was a plateau in improvement. Then, a further improvement was noted up until the age of 30-34 years. Another study by Susilo, et al. (2013) was conducted to investigate if face perception develops early in life (early maturation hypothesis) or if it develops in adulthood (late maturation hypothesis). Results supported the late maturation hypothesis because of an increase in performance of 3.69% from 18 to 33 years old. These findings are similar to those found by Lawrence et al (2008) and Carey et al. (1980).
Elderly
It is known that with age, cognitive functions deteriorate (Habak, et al. 2008). There is evidence that there is also a decline in face recognition with age (Ferris et al. 1980; Lott, et al. 2005 & Bartlett, et al. 2016; Konar, et al. 2013; Lamont et al 2005; Crook and Larrabee 1992). One study by Lott, et.al (2005) found a decline of face perception ability in the elderly. A reduction in face perception abilities was noted in subjects with good VA (6/6) and in those with poorer VA. In another study, Konar, et al. (2013) found that face identification accuracy was worse in older adults compared to younger people.
1.5 Evidence of Preservation of face perception with age
Although the majority of research into face perception and ageing suggests a decline in perception ability with age, some studies provide evidence towards age having no effect. For example, a study by Habak, et al. (2008), used the synthetic faces created by Wilson, et al. (2002), and presented them to 19 younger subjects and 21 older subjects. In a face matching test no decline with age was found when matching frontal or side views.
1.6 Impairment of Face Perception
Face recognition can be impaired by eye conditions that cause reduced VA and contrast sensitivity (McCulloch, et al. 2011). A study by Barnes, et al. (2011) found that those with Age Related Macular Degeneration (ARMD) were less accurate and had slower response times in a face matching test compared to control subjects. Bullimore, et al. (1991) also correlated ARMD with poor face recognition and found that those subjects with more advanced disease, were worse at identity recognition than expression recognition.
Prosopagnosia
Prosopagnosia is a neurological disorder of impaired face perception, where a person is unable to recognise a familiar face (Meadows, 1874). It can be developmental or acquired. In the developmental form, there is no known brain damage or neurological disease (Bentin, et al. 1999; Harris et al. 2005) but it has been suggested there is a genetic link for the condition (Duchaine, et al. 2007). Acquired prosopagnosia occurs through damage to the area of the brain involved in face processing, the fusiform gyrus. This could be from a stroke, head trauma or surgical treatment (Logan, et al. 2014).
Research into patients with acquired prosopagnosia has provided further evidence that faces are processed specially. For example Sergent, et al. (1992) found that face and object processing are different and use different parts of the brain.
1.7 Aims and Hypothesis
As mentioned previously, there is some evidence suggesting face perception abilities improve up until the 4th decade of life and then proceed to decline (Lawrence, et al. 2008; Germine, et al. 2011; Lott, et al. 2005). The aim of this project is to investigate whether or not face perception is an ability that develops, matures and then subsequently declines over a lifetime and to contribute to existing research on face perception. Furthermore the Caledonian Face Test is more sensitive than other face perception tests that are currently available (Logan, et al. 2016) and therefore has the ability to identify small differences between age groups. Face perception is an ability that is often overlooked however for those with impairments of face recognition it can cause stress and embarrassment in social situations (REF) and is worthy of study. It is hoped this study will contribute to existing research, help establish whether or not face perception declines with age and also contribute to the gathering of data for normative values of face perception and age.
2.0 Methods
2.1 Participants
Participants were recruited from either staff or students at GCU or from family members of the experimenters. They were contacted via social media, word of mouth and email. A total of 30 participants were recruited and organised into groups based on their age: 18-24, 25-39 and over 40’s. The volunteers were invited one by one into a laboratory room at GCU for the experiments to be conducted. Once seated, they were given an information sheet detailing what the project is about (Appendix 1a), a consent form to sign if they were willing to take part (Appendix 1b) and a questionnaire (Appendix 1c). For this study the exclusion criteria included anyone with known ocular pathology such as cataracts or ARMD, anyone with a neurological condition, for example Parkinson’s disease and anyone under the age of 18.
2.2 Preliminary Tests
Before beginning the face perception test, VA and contrast sensitivity were recorded for each participant using the Freiburg visual Acuity and Contrast Test (FrACT) programme. FrACT was developed by Michael Bach (see Bach, 1996) and uses the ‘Landolt C’ to calculate the VA threshold. The subject sat at 1m from a computer screen with their head and chin placed into a rest attached to a table in front. Participants were instructed to wear their habitual correction during all tests. The subject is asked to focus on a cross in the centre of the screen and a single ‘C’ is then flashed in the centre. The letter orientation is changed throughout the test to be facing either up, down, left or right. The subject must use the arrow keys on the keyboard to indicate which direction the ‘C’ is facing. With each letter presentation the letter changes size, either getting bigger or smaller depending on the previous response. After eighteen trials have been completed, the VA is given in log MAR. This procedure was carried out both monocularly and binocularly.
Next, contrast sensitivity (CS) was measured binocularly. The size of the ‘C’s remained constant while the orientation and contrast of the letters changed with each trial. Again the task of the subject was to indicate the direction of the letter by using the arrow keys. The FrACT programme then produces a threshold of the contrast sensitivity after a specific number of trials. This threshold is given as a Weber fraction – the preferred value for letter stimuli (Pelli & Bex, 2013).
2.3 The Caledonian Face Test
Following the preliminary tests, the Caledonian Face Test was used. This measures the minimum difference required for reliable face discrimination (Logan, et al. 2016). As mentioned previously, the subject views the computer screen at 1 metre and is presented with four faces in a diamond configuration. The task is to click on the face they believe to be different from the rest using the mouse and if unsure then to make a guess. A pilot study was carried out before testing to establish whether or not a feedback response should be used during the test. The feedback comes in the form of a noise that indicates if the correct face has been identified as being different. The results from the pilot study indicated that feedback did not significantly affect the threshold of discrimination (table 1 & graph 1) and therefore no feedback was used in testing. Trial runs were provided to give the subject an opportunity to familiarise themselves with the task before threshold measurement was started. There was no set limit as to how many trial runs were allowed; instead the participants were instructed to verbally communicate to the experimenter when they understood the task. All participants used 3 trial runs or less. Then testing was started and there was no further talking between examiner and participant until the test was completed.
The synthetic faces used were created by Wilson, et al. (2002) and are based on real face photographs. Photographs of 40 males and 40 females were taken from frontal views, in greyscale and with neutral expressions. From these photos key points of spatial information were extracted to begin the development of synthetic faces. There were 23 measurements that described the circumference of the head and shape of the inner hairline. A further 14 measurements were taken to describe the location and size of the internal face features. A grid was then superimposed onto the faces to run through these points. Therefore there were a total of 37 measurements used to define each face. These points are shown in figure 5a. A mean face was created for each gender by averaging out the measurements from all the photographs. The eyes for each synthetic face were generic. These mean faces appear in every trial of the Caledonian Face Test, they were randomly assigned either as the target face or as the distractor faces.
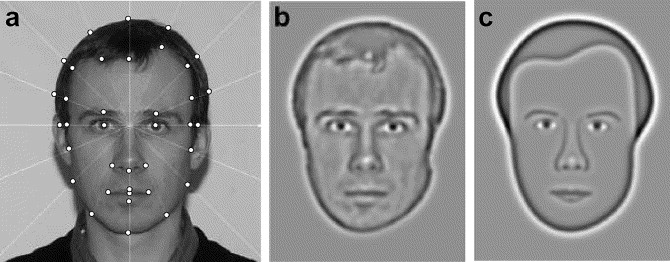
Figure 5 – Different stages in the development of the synthetic faces used in the Caledonian Face Test (Wilson et al. 2002)
The next step in the development of the faces is shown in figure 5a and 5c, where the faces were then filtered of high spatial frequencies. This removed details such as wrinkles, which are not required for face perception (Fiorentini, et al. 1983). To create quantifiable differences between the faces, any of 37 measurements can be changed in relation to the mean face, independently of each other.
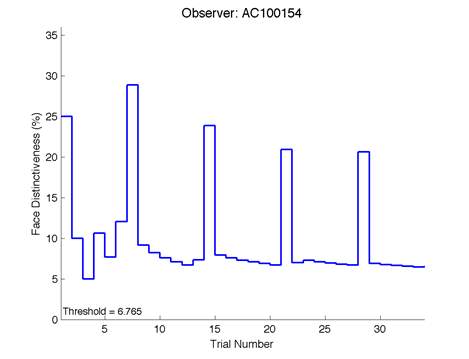
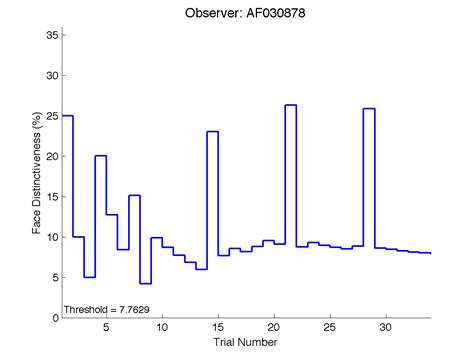
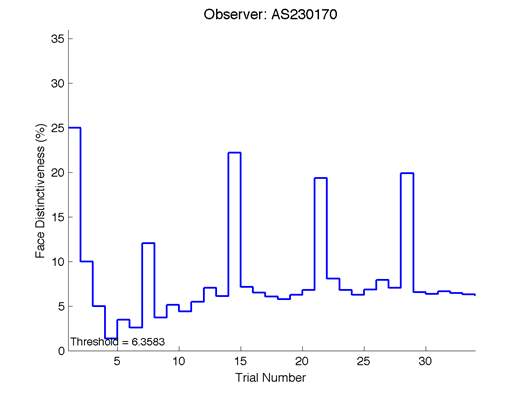
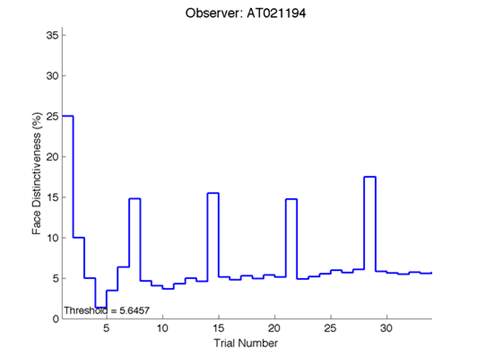
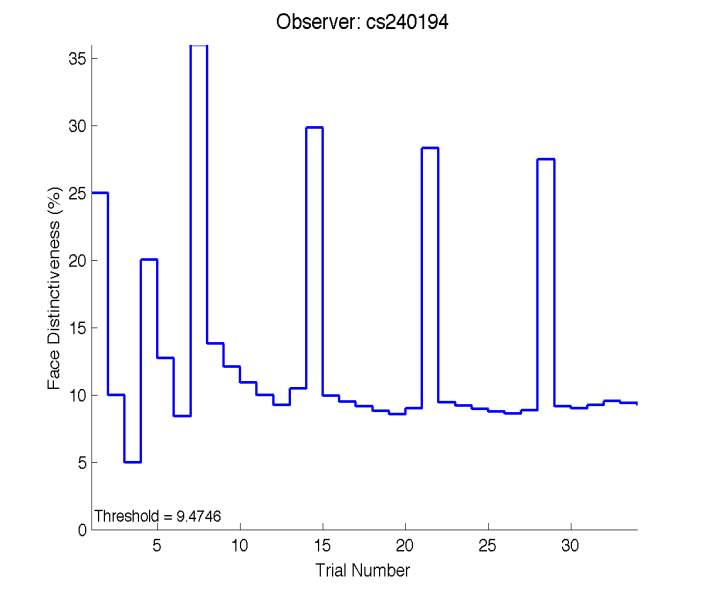
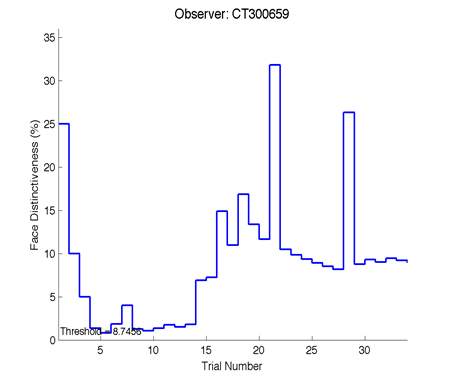
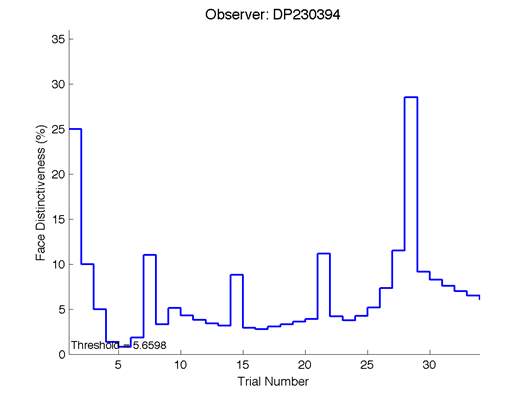
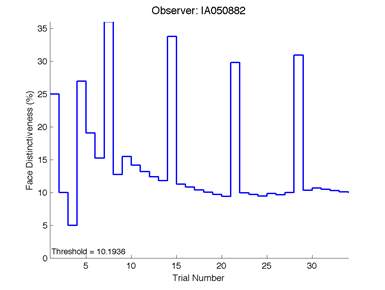
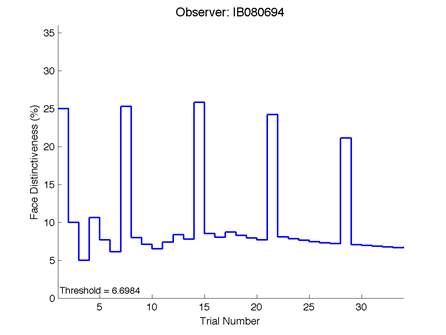
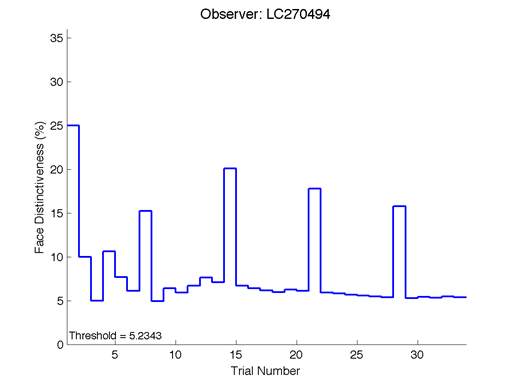
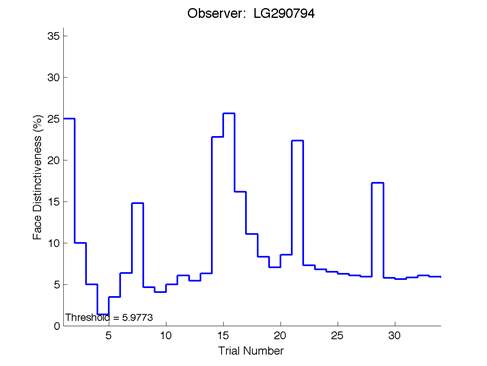
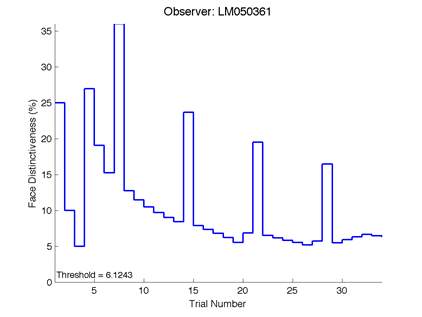
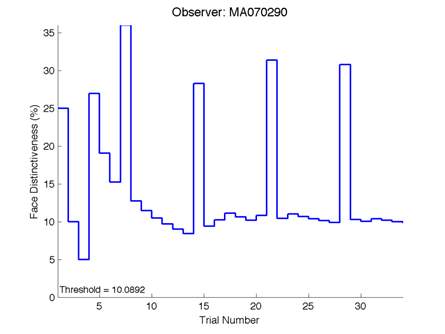
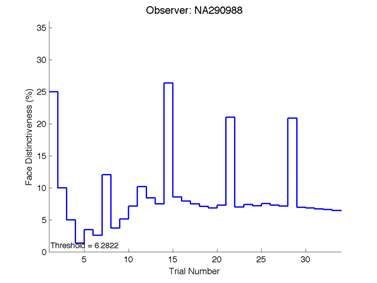
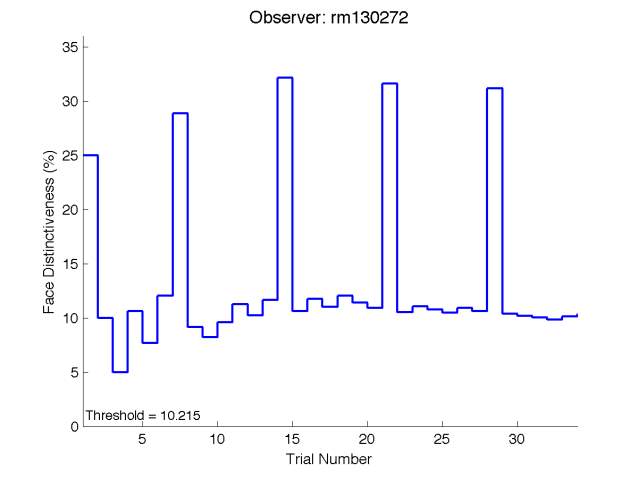
The Caledonian Face Test applies an adaptive QUEST procedure which adjusts the difference between faces based on the previous response given by the participant. So for example, if the subject did not correctly identify the odd face then the difference between the target face and distractor faces would be in the next trial (Watson & Pelli, 1983; Logan, et al. 2016). Once thirty trials have been carried out, the Caledonian Face test produces a value of the threshold of face discrimination and a graph which shows the difference between the target faces and reference face against the trial number (see appendix) (Logan, et al. 2016).
Figure 6 is an example of an output graph displayed once the test is completed. It shows how the response of the subject determines the amount of face difference in the next trial.
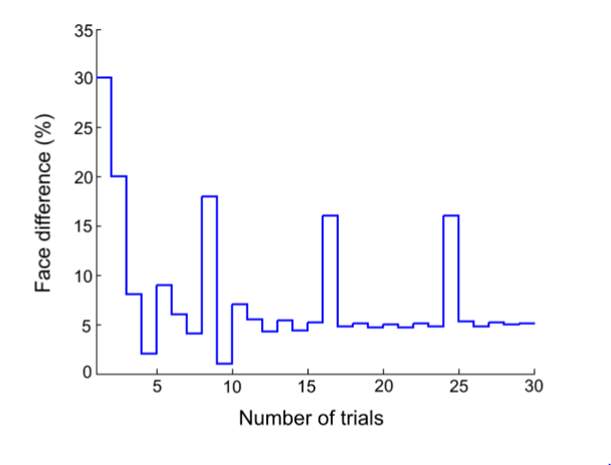
Figure 6 – Face test output. If the response is correct the face difference becomes smaller and vice versa. The large increases in face difference at trial numbers 8, 16 and 24 are included to keep the participants attention (Logan, et al. 2015).
2.4 Statistics methods
A Paired samples T-test was used to assess if a feedback response should be used in the face test. Next, an Analysis of Variance (ANOVA) was carried out to investigate the effects of threshold of face discrimination with age. The mean thresholds of discrimination of each age group were then compared against each other. Regression analysis was used to compare the relationships between thresholds of face discrimination, age, VA and contrast sensitivity.
3.0 Results
3.1 Experiment 1 – Effects of Feedback on Face Discrimination
Before starting the project a small pilot study was conducted. The Caledonian Face Test allows for the option of a feedback response in the form of a noise to indicate whether the subject’s response was correct or not. Trial runs were set up to determine if feedback affects the threshold of face discrimination and if it should be included in the test or not. There were 4 observers who each done the test with and without feedback twice. The thresholds of discrimination were then analysed in a paired samples test (Figure 6).
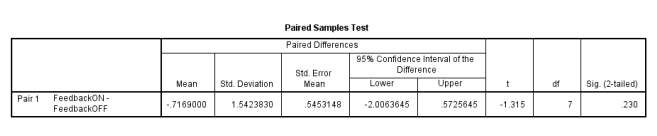
Figure 6 –Showing the p value of 0.23%.
From the Sig. column in Table 1, the p value is greater than the 5% significance level indicating that there is no evidence of a response difference with and without feedback. The upper 95% confidence limit is 0.573%; since this contains 0 it provides further evidence that the effect of threshold from feedback is not significant.
Graph 1 shows the thresholds of face discrimination of each observer from the two trial runs.
Graph 1: effects of feedback on the threshold of face discrimination
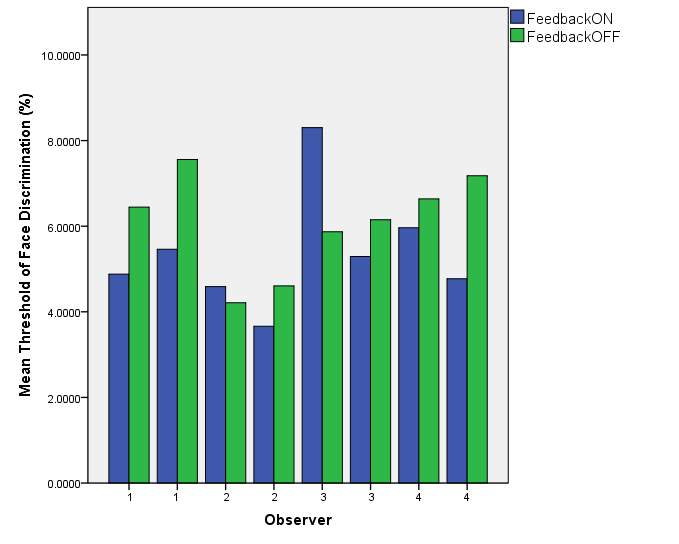
Graph 1 – The effects of feedback on face discrimination threshold. Results were variable in that some observers performed better with feedback (observer 1) while others performed worse. Observers 2 and 3 produced a higher threshold with feedback on during the first trial, but in the second having feedback on produced a lower threshold.
Considering the information provided by the paired samples test and graph 1, the decision was taken not to include a feedback response in the Caledonian Face Test for this project because no difference in threshold of face discrimination was found and it would also add time onto the test.
3.2 Experiment 2 – Effects of Age on Face Perception
A one-way between groups analysis of variance (ANOVA) was carried out to investigate if age has any effect on face perception abilities. As shown in figure 7 there was no significant difference in threshold found at the p < 0.05 level between the groups. This tells us that overall from the 30 participants used in the study, there was not a statistical difference in the threshold of face discrimination between the groups.
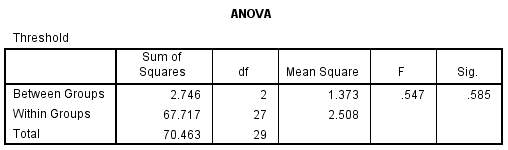
Figure 7.0 – ANOVA, displaying the significance value between groups.
Although there is no statistical difference in threshold, from figure 7.1 we can see that there is a slight increase in mean threshold from the younger group to the older group. The difference however is small overall (0.735%) and not significant. This table also displays the minimum and maximum values achieved in each age group.
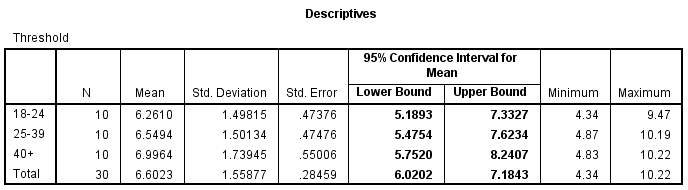
Figure 7.1 – Descriptives table of the ANOVA, displaying the mean threshold of discriminatory abilities in each group.
The mean threshold of discrimination in the 18-24 group was 6.261 ± 1.50%. The mean for the 25-39 group was 6.549 ± 1.50% and for the 40+ group the mean was 6.996 ± 1.74 %. The standard deviation for each group is relatively small, implying that the test results are accurate.
Graph 2.0: Mean threshold of face discrimination for each age group
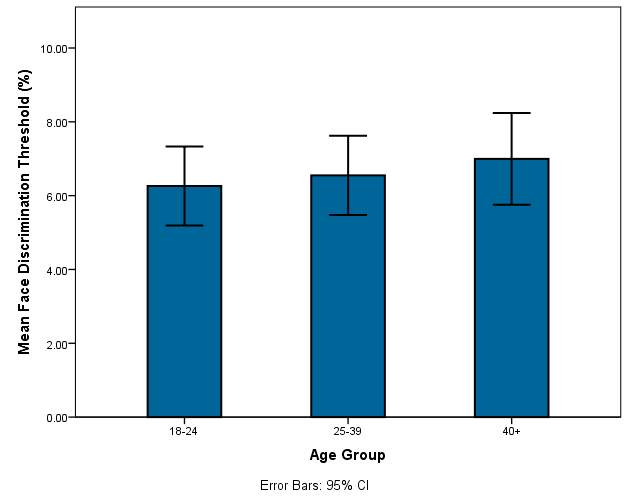
Graph 2.0 – The mean thresholds of each age group are displayed along with the error bars.
In graph 2.0 there is a very slight increase in the mean face discrimination thresholds as well as the minimum and maximum measurements for each group. The error bars in each group are of similar length and there is not a large difference in their length which indicates that age has little effect on the threshold in this study sample. The 40+ category has a slightly larger error bar.
Post Hoc
A Post Hoc test was conducted[1] to further compare the differences between the groups (figure 7.2). The results gave further confirmation that the difference in threshold between the groups was not significant.
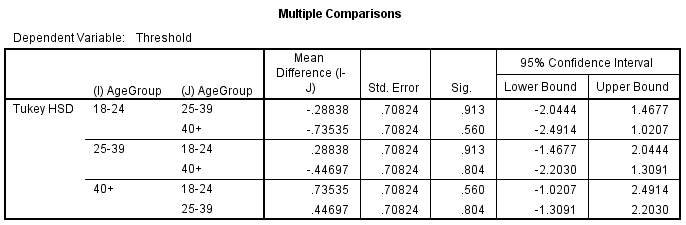
Figure 7.2- Post Hoc analysis. No mean difference has been highlighted as having a significant difference between the groups.
3.3 Regression Analysis
A regression analysis was conducted to explore the relationship between threshold (the dependent variable) and age. In figure 8, the R Square (R²) value tells us how much variance in threshold discrimination is explained by age.
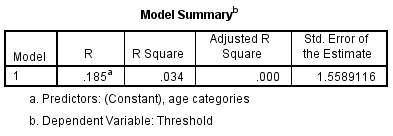
Figure 8 – Model Summary of threshold with age. The R² value here is low at 3.4%. This means that only 3.4% of the variability in threshold can be explained by age differences and so other factors must be involved.
Graph 2.1: Threshold of face discrimination with age
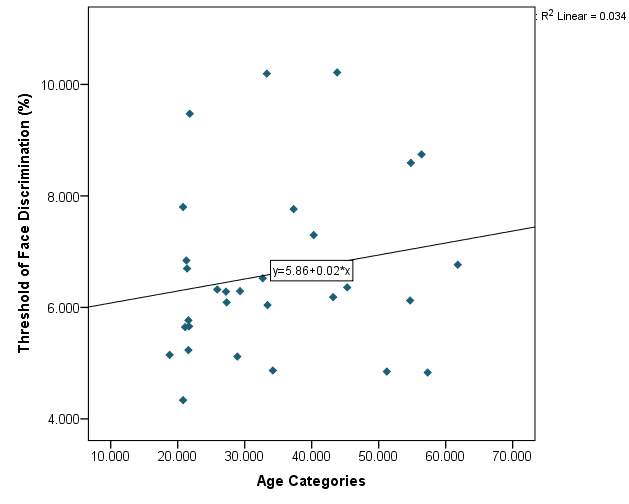
Graph 2.1- The threshold of face discrimination varies between subjects. There is a random scatter of points and there is no definitive pattern. The lowest recorded threshold was 4.3368% from a participant aged 20. While the highest recorded threshold was 10.215% from a participant aged 43.The line of best fit does have a positive slope however the fit is poor.
VA compared with age of subjects:
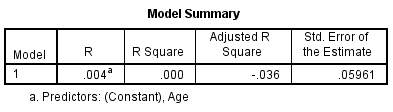
Figure 9 – The R² value is 0%. Therefore from the subject sample VA cannot be accountable for differences in age.
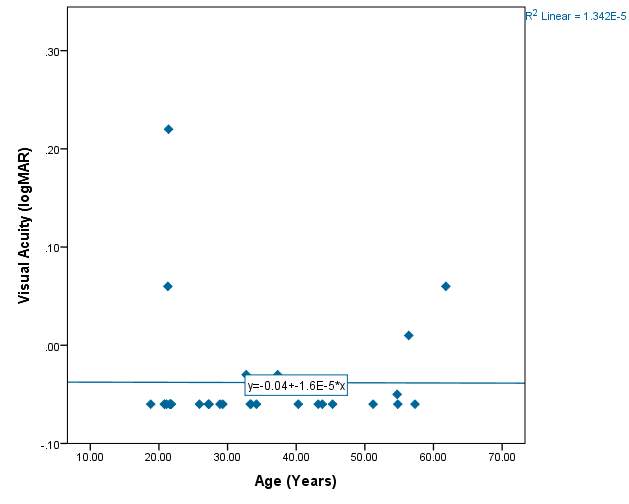
Graph 2.2 – There is no suggestion from the graph that age has an effect on VA. Most of the participants were wearing their habitual correction during the test and therefore had a good VA. Again participant IB stands out from the rest of the participants in the graph due to having a poorer vision of 0.22logMAR.
The best fit line in graph 2.2 has almost no slope. This is due to using the FrACT system at 1m when VA was measured and such an artefact was produced. Many of the participants had a VA of -0.06 logMAR, which was the measureable limit at distance of 1m. From figure 9 and graph 4 it is clear that age has little effect on VA.
Contrast sensitivity compared with age of subjects:
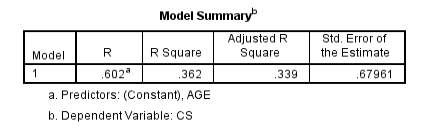
Figure 10 – 36.2% of the variability in contrast sensitivity can be explained by the age of the subjects. This is the highest R² value found in the project, indicating there is an increase in contrast sensitivity with age. However the value is not statistically significant.
Graph 2.3 – Reasonable scatter shown of contrast sensitivity with age. Values of contrast sensitivity vary particularly within the lower age group. Within the 40+ category, values of contrast sensitivity >2.00 were more common than in the lower age categories. The line of best fit has a positive slope and indicates that with age contrast sensitivity increases slightly. The r² value is 36%.
Threshold of discrimination compared with VA:
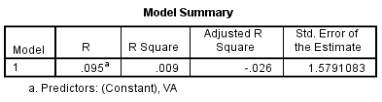
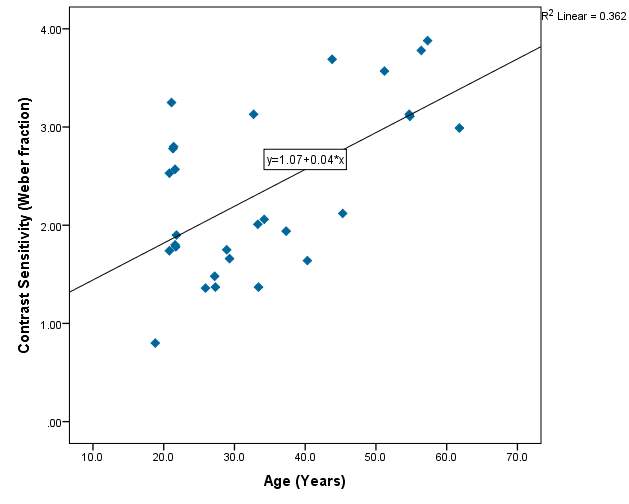
Figure 11 – Model summary output for threshold of face discrimination with VA. Only 0.9% of the variability in threshold can be explained by VA, suggesting there is a small association between the two.
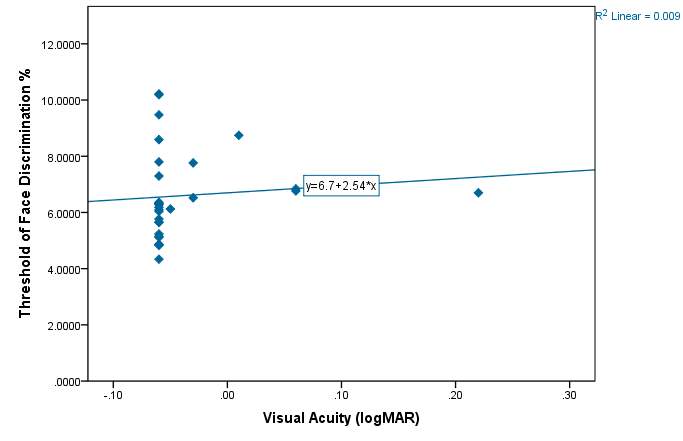
Graph 2.4 – The VA does not vary much between participants. Most of the subjects had a VA of 0.00 logMAR or better. One subject had a poorer vision of 0.22 logMAR but still had a reasonable threshold of discrimination at 6.6984%. Again in this graph the artefact from using the FrACT programme is visible in that many of the VA measurements were the same.
Most subjects had good VA and wore any necessary refractive correction. One subject in particular (IB) aged 21 does not normally wear any form of correction for myopia and had poorer vision as a result of this. However this did not appear to affect the person’s face discrimination abilities as they still performed reasonably with a face threshold of 6.6984%. Another participant (FA) had a VA of -0.06 logMAR with a similar threshold of 6.8411% indicating that reduced VA does not affect the threshold of face discrimination. The R² value of 0.9% provides further evidence that VA has little effect on the face threshold.
Threshold of discrimination compared with Contrast Sensitivity:
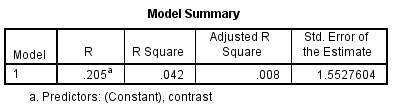
Figure 12 – Model summary output for Threshold assessment with contrast as a predictor. This shows that only 4.2% of the variability in threshold of discrimination can be explained by contrast sensitivity.
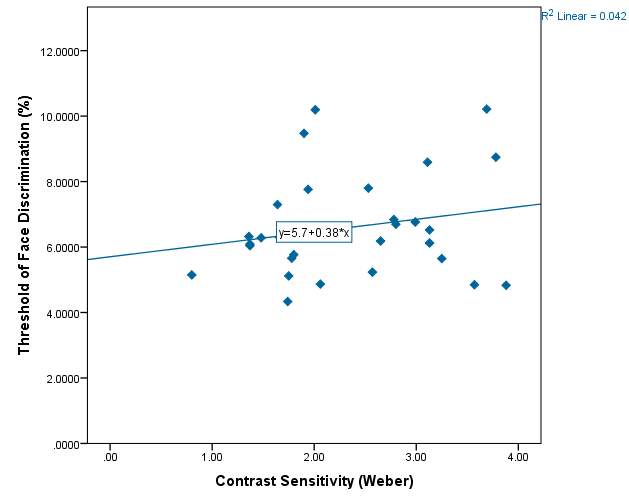
Graph 2.5 – Threshold of discrimination compared with the contrast sensitivity of each subject. There is a reasonable spread of scatter in the graph but no obvious pattern. The lowest value of contrast sensitivity was 0.80 and the highest vale was 3.88.The line of best fit has a positive slope indicating a slight increase in face threshold with increased contrast sensitivity.
4.0 Discussion
Using the recently developed Caledonian Face Test, the results of this study found that there was no significant difference in face discrimination abilities with age. Across the three age groups the mean thresholds of face discrimination were very similar. The 18-24 group had a mean threshold of 6.261 ± 1.50% (mean ± standard deviation), the 25-39 group had a mean of 6.549 ± 1.50% and the over 40’s group had a mean threshold of 6.996 ±1.74%. Although the results did show an increase in average face discrimination threshold with age, the difference was not significant at the p<0.05 level. Regression analysis confirmed that age only explained 3.4% of the variability in threshold found from the subject sample. These results agree with a study by Habak, et al. (2008) which found that age had no effect on face discrimination abilities when faces were shown from the same perspective.
According to Logan, et al. (2015) normal thresholds of face discrimination are between 3.39% and 8.11% (from participants aged between 20 and 52 years old). In our study most participants (83%) had a threshold within this range. However there was more variation than expected because three subjects who were aged between 20 and 52 had a face threshold higher than 8.11% (CS age 21, IA age 33 and RM age 43). This is likely to be unrelated to basic aspects of vision since the participants had VA’s and contrast sensitivities within normal ranges and also declared in the questionnaires that they weren’t aware of having any ocular conditions.
The results from our study differ from other studies that support the late maturation of face perception hypothesis. This includes one such study by Germine, et al. (2010) which used the CFMT in participants aged between 12 and 64. They found that face recognition improved up until just after 30 years of age. Their study also reported an age related decline in face recognition from 30 to 65 years of age. There are other studies that further support this late maturation hypothesis, these include: Lamont, et al. (2005), Lawrence, et al. (2008) and Carey, et al. (1980).It is thought that one possible reason for this late development is due to the likeliness of young adults coming into contact with more people at this time in life (Lamont, 2005). Possible reasons for the conflicting findings in our study include the sample size used, only a small number of participants were recruited (n=30). A small sample can mean that the true effect of age on face perception isn’t established (Button, et al. 2013.) Also the age range of the participants was limited to 18-61 because most subjects were recruited from staff or students at the university. Therefore the study could not asses if there were any changes in face discrimination during childhood and early teens or in over 60 year olds. From graph 3, the line of best fit does have a positive slope, so if a larger sample size was used that covers a wider age range including older people, then it is possible that age could have a more significant effect on the threshold of face discrimination. The average age of participants in this study was 34.3 years old.
Face tests currently in use such as the WRMF, which require the subject to memorise a group of faces first, involve more than testing face discrimination abilities alone. They introduce memory requirements such that if a person had a bad short term memory then they will likely perform worse on the face perception test. This could make it difficult to differentiate between reduced face discrimination ability and a poor memory/general cognitive decline (Weigelt, et al. 2012; Logan, et al. 2015). For example, in matching tests conducted by Burton, et al. (2010) that involved memory it was found that there was a decline in performance with age. On the other hand, tests that involve memorising faces can help identify prosopagnosics because it is a condition related to face memory deficit and hence these tests would pick up on that (Logan, et al. 2015). The WRMF has been criticised because it includes other clues to identification such as clothing and posture (Duchaine & Nakayama, 2006). In contrast, matching face tests like the BFRT which shows faces side by side allow for the comparison of features and less reliance on holistic processing. (Duchaine & Weidenfeld, 2003).
The Caledonian Face Test is similar to the BFRT in that the synthetic faces are shown beside each other and it is possible that matching strategies can be used. Another drawback of the Caledonian Face Test is that the synthetic faces don’t include other information which is useful in identifying a person such as the colour of the irides, eyes and eyebrow shape, hair colour/texture and skin texture. On the other hand, people can still recognise a face from 5m away or more, when the details of iris colour and skin texture are unavailable (Logan, et al. 2015). Furthermore the faces in this test are shown only from a frontal view, which is unlike everyday situations where faces are seen from different perspectives.
From the results of our project it was recognised that there was an artefact in the measurement of VA. Many of the subjects were found to have a VA of -0.06 logMAR. This is because the FrACT system is set up to present the letters with decreasing size and is only able to do so if the distance at which the test is used is sufficient and if the resolution of the screen is appropriate. In the Freiburg vision test manual, Bach suggests that standard VDU monitors are suitable for assessing VA when used at 2m or more (http://www.michaelbach.de/fract/media/FrACT3_Manual.pdf). In this study on face perception, the VA’s were recorded at 1m using the FrACT programme. As a consequence of this the best VA that could be achieved was -0.06 logMAR. At smaller distances the resolution of the VDU screen is required to be higher to accurately measure the VA.
Advantages of the Caledonian Face Test include that it is not affected by slight reductions in VA and contrast sensitivity. This was evidenced in our study by participant I.B. who had a binocular unaided vision of 0.22 logMAR with a face discrimination threshold of 6.698%. This was the poorest recorded vision in the study, due to the subject not wearing any refractive correction for myopia. However the face threshold was still comparable with other subjects who had a good VA and were of similar age. Further confirmation that VA has little effect on thresholds comes from the R² value in the model summary of discrimination with age (Table 6) which was 0.9%. Contrast sensitivity showed a decline with age but analysis of the data revealed that it was statistically insignificant. The reason that reduced VA and doesn’t affect the threshold is because a band-pass filter was applied to the synthetic faces. This means that the faces have been filtered of high spatial frequencies to remove very fine details (such as skin wrinkles) that someone with a reduced VA would not be able to see. Band-pass filtering means that those with good VA do not have an advantage over those with slightly reduced VA because the same amount of detail is available to both subjects.
When real face photographs are used is face tests, quantifying face perception can be difficult. Another advantage of the Caledonian Face Test is that the synthetic faces are controlled by measurements which allows for the precise adjustment in face difference and therefore a quantifiable result. The test also has no ceiling or floor effects i.e. there is not a limit as to how much the faces can be adjusted by. Therefore a wide range of discrimination thresholds can be assessed. In other tests the abilities of the participants could exceed the difficulty of the test, for example in the BFRT the maximum score is 50 (Duchaine & Weidenfeld, 2003). Additionally the Caledonian Face Test works around the subject’s face discrimination threshold so that fewer trials are required to reach the threshold, therefore making the test shorter. In this study no time limit was applied to the Caledonian Face Test because it was found by Logan, et al. (2015) that applying a time limit does not affect discrimination thresholds and also the test was not being carried out as part of a clinical examination where there would maybe be restraints on how long can be spent with each person. The subjects were not timed during the test however the examiners agreed that each person completed the test in less than 5 minutes.
This study could be improved by repeating the tests using a larger sample size that has a wider age range. Also, the groups could have been organised into decades for example those 30-40 year olds etc. This would provide a more reliable representation of the effects of age on face discrimination and make it clearer where these differences lie. Furthermore, the FrACT system could be used to measure VA’s at 2m or more rather than 1m to reduce ceiling affects. Or, the VA’s could be recorded at 6m using a logMAR chart. Future work into face perception could include establishing normal values of face discrimination thresholds for different ages. Also a larger study could be conducted using the Caledonian Face Test in combination with other tests such as the CFMT and the BFRT to provide a broader understanding of the effects of age on face discrimination. This would also allow for comparison of tests which allow for matching strategies to be used with tests based more on face memory. The Caledonian Face test itself could be further developed to contain more face information such as iris colour and eyebrow shape.
5.0 Conclusion
In summary, the results from this study did not support the hypothesis that face perception is an ability that develops, matures and then subsequently declines with age. There was an increase in the threshold of face discrimination found between the mean values of each age group; however analysis of the results indicated that the difference was not statistically significant at least from the sample tested here.
References
Allison, T., Puce, A. & McCarthy, G. 2000, “Social perception from visual cues: role of the STS region”, Trends in Cognitive Science, vol. 4, no. 7, pp. 267-278.
Bach, M. 1996, “The Freiburg Visual Acuity Test-Automatic Measurement of Visual Acuity”, Optometry & Vision Science, vol. 73, no. 1, pp. 49-53.
Bach, M., Freiburg Vision Test – Manual. Available: http://www.michaelbach.de/fract/media/FrACT3_Manual.pdf [2016, 05/04].
Bartlett, J.C. & Leslie, J.E. “Ageing and memory for faces versus single views of faces”, [Online], vol. 14, no. 5, pp. 23/01/16. Available from: http://link.springer.com/article/10.3758%2FBF03197012.
Bennett, P.J., Sekuler, A.B., McIntosh, A.R. & Della-Maggiore, V. 2001, “The effects of aging on visual memory: evidence for functional reorganization of cortical networks”, Acta Psychologica, vol. 107, no. 1–3, pp. 249–273.
Bentin, S., Deouell, L.Y. & Soroker, N. 1999, “Selective visual streaming in face recognition: Evidence from developmental prosopagnosia”, Cogntivie Neuroscience, Neuroreport, vol. 10, pp. 823-827.
Bowles, D.C., McKone, E., Dawel, A., Duchaine, B., Palermo, R., Schmalzl, L., Rivolta, D., Wilson, E. & Yovel, G. 2009, “Diagnosing prosopagnosia: Effects of ageing, sex, and participant-stimulus ethnic match on the Cambridge Face Memory Test and Cambridge Face Perception Test”, Cognitive Neuropsychology, vol. 26, no. 5, pp. 423 — 455.
Bruce, C., Desimone, R. & Gross, C.G. 1981, “Visual properties of neurons in a polysensory area in superior temporal sulcus of the macaque.”, Journal of Neurophysiology, vol. 46, pp. 369-384.
Bullimore, M., Bailey, I. & Wacker, R. 1991, “Face recognition in age-related maculopathy 07/1991; 32(7):2020-9. Source: PubMed, “Investigative Ophthalmology & Visual Science, vol. 32, no. 7, pp. 2020-2021-2029.
Burton, A.M., White, D. & McNeill, A. 2010, “The Glasgow Face Matching Test”, Behavior Research Methods, vol. 42, no. 1, pp. 286-291.
Button, K.S., Ioannidis, J.P.A., Mokrysz, C., Nosek, B.A., Flint, J., Robinson, E.S.J. & Munafò, M.R. 2013, “Power failure: why small sample size undermines the reliability of neuroscience”, Nature Reviews Neuroscience, vol. 14, pp. 365-376.
Buxton, R.B., Uludag, K. & Dubowitz, D.J. 2005, “Chapter 9 – Introduction to functional magnetic resonance imaging (fMRI)” in Basic Principles of Functional MRI, pp. 250.
Carey, S. & Diamond, R. 1977, “From piecemeal to configurational representation of faces”, Science, vol. 195, pp. 312–314.
Carey, S., Diamond, R. & Woods, B. 1980, “Development of face recognition – a maturational component?”, [Online]. Available from: https://software.rc.fas.harvard.edu/lds/wp-content/uploads/2013/06/Carey-Diamond-and-Woods-1980.pdf.
Costen, N.P., Parker, D.M. & Craw, I. 1996, “Effects of high-pass and low-pass spatial filtering on face identification”, Perception and Psychophysics, vol. 58, pp. 602–612.
Crook, T.H. & Larrabee, G.J. 1992, “Changes in facial recognition memory across the adult life span”, Journal of Gerontology, vol. 47, pp. 138–141.
Daw, N.W. 2006, “Chapter 3, Development of visual capabilities” in Visual Development, Second Edition edn, Springer Science & Business Media, Inc., , pp. 35.
Diamond, R. & Carey, S. 1986, “Why Faces Are and Are Not Special: An Effect of Expertise”, Journal of Experimental Psychology, vol. 115, no. 2, pp. 107-117.
Duchaine, B., Germine, L. & Nakayama, K. 2007, “Family resemblance: Ten family members with prosopagnosia and within-class object agnosia”, Cognitive Neuropsychology, vol. 24, no. 4, pp. 419–430.
Duchaine, B. & Nakayama, K. 2006, “The Cambridge Face Memory Test: Results for neurologically intact individuals and an investigation of its validity using inverted face stimuli and prosopagnosic participants”, Neuropsychologia, vol. 44, pp. 576–585.
Duchaine, B. & Nakayama, K. 2004, “Developmental prosopagnosia and the Benton Facial Recognition Test”, Neurology, vol. 62, pp. 1219-1220.
Duchaine, B.C. & Weidenfeld, A. 2003, “An evaluation of two commonly used tests of unfamiliar face recognition”, Neuropsychologia, vol. 41, no. 6, pp. 713-720.
Duchaine, B.C. & Weidenfeld, A. 2002, “An evaluation of two commonly used tests of unfamiliar face recognition”, [Online]. Available from: http://www.faceblind.org/social_perception/papers/duchaine03neuropsychologia.
Ferris, S.H., Crook, T., Clark, E., McCarthy, M. & Rae, D. 1980, “Facial Recognition Memory Deficits in Normal Aging and Senile Dementia”, Journal of Gerontology, vol. 35, no. 5, pp. 707-714.
Fiorentini, A., Maffei, L. & Sandini, G. 1983, “The role of high spatial frequencies in face perception”. Perception, vol. 12, pp. 195–201.
Freire, A., Leeô, K. & Symons, L.A. 2000, “The face-inversion effect as a deficit in the encoding of configural information: Direct evidence”, Perception, vol. 29, pp. 159-170.
Germine, L.T., Duchaine, B.C. & Nakayama, K. 2010, “Where cognitive development and aging meet: Face learning ability peaks after age 30”, Cognition.
Glen, F.C., Crabb, D.P., Smith, N.D., Burton, R. & Garway-Heath, D.F. 2012, “Do Patients with Glaucoma Have Difficulty Recognizing Faces?”, Investigative Ophthalmology & Visual Science, vol. 53, pp. 3629-3637.
Glen, F.C., Smith, N.D. & Crabb, D.P. 2013, “Saccadic eye movements and face recognition performance in patients with central glaucomatous visual field defects”. Vision Research, vol. 82, no. 19, pp. 42–51.
Gorno-Tempini, M.L. & Price, C.J. 2001, “Identification of famous faces and buildings: a functional neuroimaging study of semantically unique items”, Brain: A Journal of Neurology, vol. 124, no. (10), pp. 2087-2097.
Gorno-Tempini, M.L. & Price, C.J. 2001, “Identification of famous faces and buildings: A functional neuroimaging study of semantically unique items”
Brain, A Journal of Neurology, vol. 124, no. (10), pp. 2087-2097.
Groen, C.C., Sarty, M. & Wu, P.Y.K. 1975, “Visual Following and Pattern discrimination of face like stimuli by newborn infants”, Paediatrics, vol. 56, no. 4, pp. 544.
Habak, C., Wilkinson, F. & Wilson, H. 2008, “Aging disrupts the neural transformations that link facial identity across views.”, Vision Research, vol. 48, pp. 9–15.
Hadjikhani, N. & Gelder, B.d. 2002, “Neural Basis of Prosopagnosia: an fMRI Study”, Human Brain Mapping, vol. 16, pp. 176-182.
Hancock, P.J.B., Bruce, V. & Burton, A.M. 2000, “Recognition of Unfamiliar Faces”. [Online]. Available from: https://dspace.stir.ac.uk/bitstream/1893/130/1/hancock-tics-2000.pdf.
Harris, A., Duchaine, B. & Nakayama, K. 2005, “Normal and Abnormal face selectivity of the M170 Response in developmental prosopagnosics”, Neuropsychologia, vol. 43, pp. 2125-2136.
Haxby, J.V., Hoffman, E.A. & Gobbini, M.I. 2010, “The distributed human neural system for face perception”, Trends in Cognitive Science, vol. 4, Chapter 6, pp. 223–233.
Hoffman, E.A. & Haxby, J.V. 2000, “Distinct representations of eye gaze and identity in the distributed human neural system for face perception”, Nature Neuroscience, vol. 3, pp. 80–84.
Horney, D.J. 2001, The Thatcher Illusion: What can it tell us about the infants’ developing abilities to distinguish between facial expressions?, University of Sussex.
Ishai, A., Leslie, G., Ungerleider, A.M. & Haxby, J.V. 2000, “The Representation of Objects in the Human Occipital and Temporal Cortex”, Journal of Cognitive Neuroscience, vol. 12, no. 2, pp. 35-51.
Johnson, M.H., Dziurawiec, S., Ellis, H. & Morton, J. 1991, “Newborns’ preferential tracking of face-like stimuli and its subsequent decline”, Cognition, vol. 40, pp. 1-19.
Kanwisher, N., McDermott, J. & Chun, M.M. 1 June 1997, “The Fusiform Face Area: A Module in Human Extrastriate Cortex Specialized for Face Perception”, The Journal of Neuroscience, vol. 17, no. (11), pp. 4302-4311.
Kanwisher, N. & Yovel, G. 2006, “The fusiform face area: a cortical region specialized for the perception of faces”, Phil. Trans. R. Soc. B, vol. 361, pp. 2109–2128.
Konar, Y., Bennett, P.J. & Sekuler, A.B. 2013, “Effects of aging on face identification and holistic face processing”, Vision Research, vol. 9, no. 88, pp. 38-46.
Lamont, A.C., Stewart-Williams, S. & Podd, J. 2005, “Face recognition and aging: Effects of target age and memory load”, Memory & Cognition, vol. 33, no. 6, pp. 1017-1024.
Lawrence, K., Bernstein, D., Pearson, R., Mandy, W., Cambell, R. & Skuse, D. 2008, “Changing abilities in recognition of unfamiliar face photographs through childhood adolescence: performance on a test of non-verbal immediate memory”, [Online],. Available from: http://www.ncbi.nlm.nih.gov/pubmed/19334303.
Lee, Y., Duchaine, B., Wilson, H.R. & Nakayama, K. 2010, “Three Cases of Developmental Prosopagnosia from one family: Detailed neuropsychological and psychophysical investigation of face processing”, Cortex, vol. 46, pp. 949-964.
Liu, J., Harris, A. & Kanwisher, N. 2010, “Perception of Face Parts and Face Configurations: An fMRI Study”, Journal of Cognitive Neuroscience, vol. 22, no. (1), pp. 203-211.
Logan, A.J., Wilkinson, F., Wilson, H.R., Gordon, G.E. & Loffler, G. 2016, “The Caledonian face test: A new test of face discrimination”, Vision Research, vol. 119, pp. 29–41.
Logan, A.J., Gordon, G.E. & Loffler, G. 2014, “Normal and impaired face perception: implications for the optometrist”, Optometry Today, pp. 49-49-53.
Lott, L.A., Haegerstrom-Portnoy, G., Schneck, M.E. & Brabyn, J.A. 2005, “Face Recognition in the Elderly”, [Online]. Available from: http://www.ncbi.nlm.nih.gov/pubmed/16276318.
Maurer, D., Le Grand, R. & Mondloch, C.J. 2002, “The many faces of configural processing”, TRENDS in Cognitive Sciences, vol. 6, no. 6, pp. 255-260.
McCulloch, D.L., Loffler, G., Colquhoun, K., Bruce, N., Dutton, G.N. & Bach, M. 2011, “The effects of visual degradation on face discrimination”, Ophthalmic and Physiological Optics, vol. 31, no. 3, pp. 240-2480.
McCulloch, D.L., Loffler, G., Colquhoun, K., Bruce, N., Dutton, G.N. & Bach, M. 2011, “The Effects of Visual Degradation on Face Discrimination”, [Online]. Available from: http://www.ncbi.nlm.nih.gov/pubmed/21410744.
McKone, E., Crookes, K. & Kanwisher, N., The Cognitive and Neural Development of Face Recognition in Humans. Available: http://web.mit.edu/bcs/nklab/media/pdfs/McKone.Crookes.Kan.revfinal.pdf [2015, 02/12].
Meadows, J.C. 1974, “The anatomical basis of prosopagnosia”, Journal of Neurology, Neurosurgery and Psychiatry, vol. 37, pp.489-501.
Nelson, C.A. 2001, “The Development and Neural Bases of Face Recognition. Infant and Child Development, Inf. Child Dev. 10: 3–18 (2001) DOI: 10.1002/icd.239″ [Online]. Available from: http://infantlab.fiu.edu/Articles/Nelson%20ICD%202001.pdf.
Pascalis, O., de Schonen, S., Morton, J., Deruelle, C. & Fabre-Grenet, M. 1995, “Mother’s Face Recognition by Neonates: A Replication and an Extension “, [Online], . Available from: http://webcom.upmf-grenoble.fr/LPNC/resources/olivier_pascalis/Pascalisetal1995.pdf.
Paukner, A., Bower, S., Simpson, E.A. & Suomi, S.J. 2013, “Sensitivity to first-order relations of facial elements in infant rhesus macaques”, Infant Child Dev, vol. 22, no. 3, pp. 320–330.
Pelli, D.G. & Bexb, P. 2013, “Measuring Contrast Sensitivity”, Vision Research, vol. 90, pp. 10–14.
Rolls, E.T. 2008, “Face processing in different brain areas and critical band masking”, [Online], vol. 2, no. 02/12, pp. 325-360. Available from: http://www.oxcns.org/papers/451_Rolls08_JNP85.pdf.
Schwaninger, A., Ryf, S. & Hofer, F. 2003, “configural information is processed differetnly in perception and recognition of faces”, [Online], vol. 43, pp. 1501-1501-1505. Available from: http://www.face-rec.org/interesting-papers/Other/SchRyfHof2003.pdf.
Sergent, J., Signoret, J.L., Bruce, V. & Rolls, E.T. 1992, “Functional and Anatomical Decomposition of Face Processing: Evidence from Prosopagnosia and PET Study of Normal Subjects”, Phil. Trans. R. Soc. B, vol. 335, pp. 55-62.
Susilo, T. & Duchaine, B. 2013, “Advances in developmental prosopagnosia research”, Current Opinion in Neurobiology, vol. 23, pp. 423–429.
Susilo, T., Germine, L. & Duchaine, B. 2013, “Face Recognition Ability Matures Late: Evidence From Individual Differences in Young Adults”, Journal of Experimental Psychology: Human Perception and Performance, vol. 39, no. 5, pp. 1212–1217.
Susilo, T., Rezlescu, C. & Duchaine, B. 2013, “The composite effect for inverted faces is reliable at large sample sizes and requires the basic face configuration”, [Online], vol. 13, pp. 26/01/2016-1–9. Available from: http://www.faceblind.org/social_perception/papers/susilo_2013_jov.pdf.
Tanaka, J.W. & Farah, M.J. “Parts and Wholes in Face Recognition. “, [Online]. Available from: http://citeseerx.ist.psu.edu/viewdoc/download?doi=10.1.1.562.4002&rep=rep1&type=pdf.
Tanaka, J.W., Kay, J.B., Grinnell, E. & Stansfield, B. 1998, “Face Recognition in Young Children: When the Whole is Greater than the Sum of Its Parts”, VISUAL COGNITION, vol. 5, no. (4), pp. 479–496.
Thompson, P. 1980, “Margaret Thatcher: A New Illusion”, vol. 9, pp. 483-484.
Tsao, D.Y., Freiwald, W.A., Tootell, R.B. & Livingstone, M.S. 2006, “A cortical region consisting entirely of face-selective cells”, Science, vol. 311, pp. 670-674.
Tsao, D.Y. & Livingstone, M.S. 2008, “Mechanisms of Face Perception”, neuroscience, vol. 31, pp. 411-437.
Vuilleumier, P., Armony, J.L., Driver, J. & Dolan, R.J. 2001, “Effects of Attention and Emotion of Face Processing in the Human Brain: An Event-Related fMRI Study”, Neuron, vol. 30, pp. 829–841.
Wang, G., Tanaka, K. & Tanifuji, M. 1996, “Optical Imaging of Functional Organization in the Monkey Inferotemporal Cortex”, Science, New series, vol. 272, no. 5268, pp. 1665-1668.
Watson, A.B. & Pelli, D.G. 1983, “QUEST: A Bayesian adaptive psychometric method”, Perception & Psychophysics, vol. 33, no. 2, pp. 113-120.
Weigelt, S., Koldewyn, K. & Kanwisher, N. 2012, “Face identity recognition in autism spectrum disorders: A review of behavioral studies”, Neuroscience and Biobehavioral Reviews, vol. 36, pp. 1060–1084.
Wilson, H.R., Loffler, G. & Wilkinson, F. 2002, “Synthetic Faces, face cubes and the geometry of face space”, Vision Research, vol. 42, pp. 2909-2923.
Yin, R.K. 1969, “Looking at Upside-Down Faces. “, Journal of Experimental Psychology, vol. 81, pp. 141-141-145.
Young, A.W., Hellawell, D. & Hay, D.C. 1987, “Configurational information in face perception”, [Online], vol. 16, no. 6, pp. 26/01/2016-747-759. Available from: http://psycnet.apa.org/psycinfo/1989-14318-001.
Appendix 1a: Information Sheet
Introduction and Study Purpose
You are invited to take part in a study about face perception. The ability to discriminate between faces is a vital skill for all individuals, to be able to differentiate between family, friends and work colleagues alike. There is evidence to suggest that the ability to do this may change as we age. The aim of the study is to gather data to help determine whether our ability to recognise faces does vary with age.
Your contribution to the study will help us to understand the face discrimination abilities of different age ranges. It is important for you to understand what participation in the study will involve. Please take time to read the following information carefully.
What will I have to do if I take part?
If you are interested in taking part, you will be asked to complete a brief and anonymous questionnaire, which will give us more information about your health and eyesight. You will also be asked to undertake a series of tests. The first involves reading letters from an eye test chart. The second asks you to read low contrast letters on a second eye test chart. The final test involves recognising differences between computer generated faces on a computer/laptop screen. You will be shown four pictures of these faces on a screen at any one point, where 3 faces will be identical but one will be different. Your task is to determine which of the 4 faces is the odd one out. The test will take approximately 10 minutes to complete.
If you are happy to participate in this test, please complete the attached consent form, and feel free to ask the researches any questions.
Do I have to take part?
No you do not have to take part. Participation in this test is completely voluntary. If you wish to stop participating at any point, do not hesitate to say.
What are the possible risks of taking part?
There are no known risks.
What are the possible benefits of taking part?
Although there will be no personal benefits, the results should help us in understanding whether a difference in face perception does exist between people of different ages.
What will happen to the information that you give?
The results we collect from these tests will be stored on a password-protected computer. At the end of the study, the computer-based data will be permanently deleted and any paper records will be shredded.
Will my taking part in this study be kept confidential?
Yes, all your information will remain confidential. No information that might identify you will be shared with anyone out with this project or included in the final project report.
What will happen to the results of the research study?
The anonymised results of the test will be analysed and will be made into a project report which will be available to a number of people including other health professionals. These anonymised results may also be presented in academic journals or as conference presentations.
What happens next?
If you decide you are interested in participating in the study after reading this information sheet, please complete a copy of the consent form.
Thank you for taking the time to read this information sheet.
Appendix 1b: Consent form
Project Title:
Face perception: development, maturation and decline?
Please Initial Box
 I confirm that I have read and understand the information sheet for the above study and
have had the opportunity to ask the researchers any questions
 I understand that my participation is voluntary and that I am free to withdraw at any time, without giving reason.

- I agree to take part in the above study
 I agree and understand that my answers will be used as part of a project report.


Name of Participant Signature Date
Name of Researcher Signature Date
Appendix 1c: Questionnaire
Project Title: Face perception: development, maturation and decline?
Part 1
1. What age are you?


 U16 1 17-25 26-59 60+
2. What sex are you?

 Male Female
3. What is your nationality?
________________________________
Part 2
4. Do you wear glasses?
________________________________
If yes, please move to number 5.
If no, please move to number 6.
5. Are your glasses for distance or near?
________________________________
6. Do you have any eye conditions that you are aware of?
________________________________
7. Any other health conditions?
_______________________________
Thank you for taking your time to fill out our questionnaire.
Appendix 1d
 |
 |
 |
 |
 |
 |
 |
 |
 |
 |
 |
 |
 |
 |
 |
 |
 |
 |
[1] The examiners are aware that a post-hoc would normally only be carried out if there was a significant difference found from the ANOVA.
Cite This Work
To export a reference to this article please select a referencing stye below:
Related Services
View all


Related Content
All TagsContent relating to: "Medicine"
The area of Medicine focuses on the healing of patients, including diagnosing and treating them, as well as the prevention of disease. Medicine is an essential science, looking to combat health issues and improve overall well-being.
Related Articles

DMCA / Removal Request
If you are the original writer of this dissertation and no longer wish to have your work published on the UKDiss.com website then please: