Reasons for Deforestation and Desertification
Info: 4188 words (17 pages) Dissertation
Published: 6th Jul 2021
AN ASSESSMENT OF THE EXTENT OF DEFORESTATION IN LAFIYA, NASARAWA STATE, NIGERIA
ABSTRACT
Desert encroachment, drought, erosion, high temperatures are few among many of the consequences of deforestation. This affects the natural ecosystems causing the extinction of vulnerable species in the environment and can facilitate the advent of ailments among human population and other large animal population alike. With Nigeria losing about 55.7% of its primary forest, it makes up for the loss of 3.5% of the world’s vegetation, approximately 350,000 – 400,000 hectare per year (Reddy et al., 2013) and contributes to the increasing rate of forest change in the world and ranks the highest rate of Vegetation lost in Africa. The application of Remote sensing techniques and Geographical information gives the platform to investigate the ongoing trend of deforestation and its diverse effect on the land surface, climatic conditions and the wellbeing of humans, large animals and small animals in different ecosystems. Sensors are mounted on satellite capitalises on heights thousands of kilometres above ground and sea level to capture images of the Earth surface and are collected via a computer-based internet network for analysis. Lafiya town located in the Nassarawa State of Nigeria was selected as the case study area considering her vegetation type (Guinea Savannah) and climatic condition. Image of the Study area was obtained from Landsat 8 OLI/TIRS CI Level1. The use of ArcGIS was deployed to process the image, and subsequently was an NDVI calculation and lastly, the final analysis was done and presented.
Keywords: Desert encroachment, Guinea Savannah, Ecosystem, Sensors, NDVI, Primary Forest.
INTRODUCTION
Deforestation is a process of a continuous decrease of vegetation over a long period of time which can result in desertification, drought and loss of ecosystems. This process is also known as forest degradation. Certain anthropological factors such as human activities have been in play over a long period of time in the issue of deforestation which in turn has resulted in negative impact and implication on the environment. Direct causes of deforestation are an agricultural expansion, wood extraction (e.g., logging or wood harvest for domestic fuel or charcoal), and infrastructure expansion such as road building and urbanization (NASA, 2017).
Deforestation has become an ongoing trend, affecting so many countries in the world today with an annual rate of 3.5% which is approximately 350,000 – 400,000 hectare per year (Reddy et al., 2013). Deforestation is a Global concern as it is a major contributor to the loss of forest land cover, extreme temperatures, climate change and global warming. Causes of deforestation vary from region to region around the world. In 2009, 2/3rd of the world forests were in 10 top countries: 1) Russia, 2) Brazil, 3) China, 4) the United States, 5) Canada, 6) Australia, 7) Congo, 8) Indonesia, 9) Peru and 10) India (America et al., 2018).
According to the Food and Agriculture Organization of the United Nations (FAO), in Africa, Nigeria rates the highest in Deforestation. As of 2005, Nigeria had the highest rate of deforestation in the world. Between 2000 and 2005 the country lost 55.7% of its primary forests, and the rate of forest change increased by 31.2% to 3.12% per annum (Orga- and Cover, 2010). In Africa vegetation have been cleared for varied reasons like timber for export. Subsistence agriculture, wood for fuel and land for grazing and land for logging.
In 2005 12.2%, the equivalent of 11,089,000 hectares (27,400,000 acres) had been forested in Nigeria. Between 1990 and 2000, Nigeria lost an average of 409,700 hectares of forest every year equal to an average annual deforestation rate of 2.38%. Between 1990 and 2005, in total Nigeria lost 35.7% of its forest cover or around 6,145,000 hectares (Orga- and Cover, 2010). Deforestation in Nigeria gains ascendancy as one of the most severe environmental issues in the nation. The northern region is mostly affected by the effects of Deforestation because of its geographical location situated close to the Sahel savannah which extends vastly and joins the deserts of Niger and Chard to the North of the equator.
Deforestation ultimately leads to the overwhelming trend of desertification. Desertification is the gradual encroachment of dried arid lands (Desert) and the effect of its significant features on what was ones richly agricultural land. The impacts of deforestation can be seen in the socio-economic strive of the country in regards to economic issues, agricultural aspects, quality of life and even conflict. Powerful mapping, image processing and surveillance techniques such as Remote sensing are required to detect the occurrence of deforestation and to monitor desertification as well as every other occurring environmental occurrence.
The Food and Agriculture Organization of the United Nations lists the requirements of sustainable forest management as the extent of forest resources, biological diversity, forest health and vitality, productive functions of forest resources, protective functions of forest resources, socio-economic functions and a legal, policy and institutional framework. Many aspects of the outline are currently not being met and will continue to have detrimental effects if not quickly addressed (Kumar et al., 2010).
The deployment of sensors fitted on satellites and the use of other Arial platforms like the aeroplane and the Unmanned Ariel Vehicles (UAV) have proven to be a capable and reliable source of data. Change detection in forest cover is indeed possible, these sensors capture satellite images of the earth surface and through the processing and analysis of remotely sensed data, land change detection and monitoring can be done for planning purposes and implementing laws to enforce mitigating measures.
Remote Sensing (RS) has been used to detect differences in land cover for many investigations ranging from Land use cover change, natural desaster management, solid mineral studies and ocean cover. It is a usefull tool in land in classification and for mapping land cover and uses with the use of different adopted techniques and data set. Landsat images in particular have served a great deal in the classification of different landscape components at a larger scale (Ozesmi and Bauer, 2002)(Butt et al., 2015).
As of late a few change recognition strategies have been produced that make utilization of remotely detected pictures, Among these Unsupervised classification or clustering, Supervised classification, PCA, Hybrid classification and Fuzzy classification are the most commonly applied techniques used in classification. There are numerous approaches to screen or recognize arrive cover change after some time. In the past researchers utilized field information and aeronautical photos to delineate over littler zones, as the extent of the zone of study gets greater, these strategies turn out to be expensive and tedious. Remote detecting by means of satellite symbolism is an amazing apparatus to think about Land Use Land Cover Classification (LULCC) on the grounds that pictures can cover substantial geographic degrees and have a high fleeting inclusion.
BACKGROUND/DESCRIPTION OF STUDY AREA
The Study Area
Lafiya town is the state capital of Nasarawa State which is centrally located in the Middle Belt region of Nigeria. The town lies between Latitude 8° 29’30” and 8°31’0” and shares borders with the Federal capital to the Northwest, Kaduna state to the North, Plateau State to the east and Kogi and Benue State to the south. Home to farmers and herdsmen, the major occupation of the towns permanent inhabitants are cattle rearing and farming with other minor important activities like cotton weaving and dying.
Nasarawa state falls under the tropical rainy climate with the distinct dry season in winter. The rainy season span a period of seven months (April – October) with an annual rainfall of about 1200 – 2000mm. the southern part records significant rainfall than the northern part. The temperature is moderate in January as a result of the harmattan influence with a very low temperature in the northern part. Temperatures range from 22.5 – 25⸰c, humidity is generally high during the rainy season, with about 95% in parts of the state and drops to about 55% during the dry season. There is notable sunshine almost all year round.
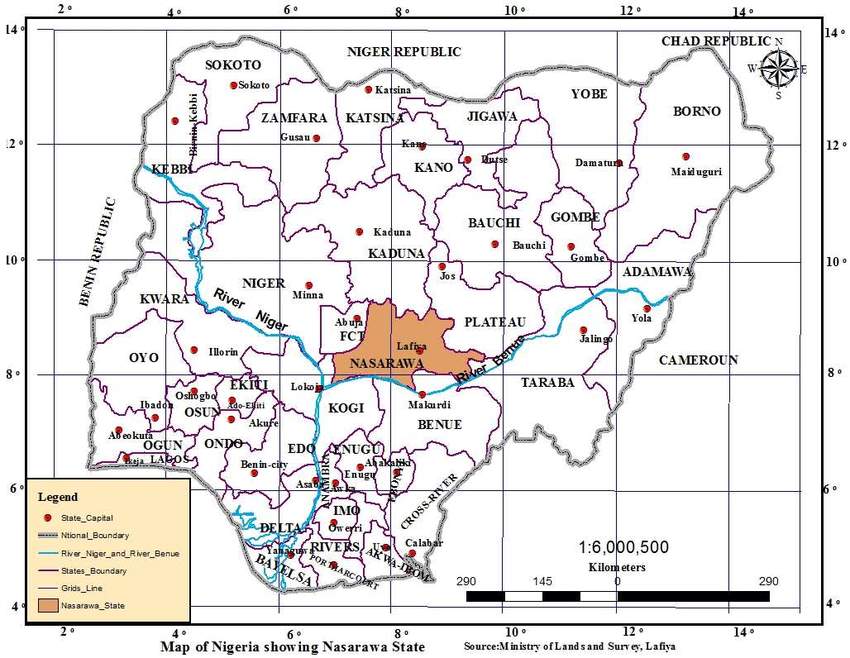
Figure 1: Map of Nigeria showing nasarawa state. source: Ministry of Land and Survey, Lafiya
Nigerian Agroecology can be classified into about eight Vegetation zones namely;
the Sahel Savana, Short Grass Savanna, Guinea Savanna, Woodland, Marginal
Savanna, Mangrove, Montane and Sudan Savana. Nassarawa State falls within the southern guinea savanna zone, which is characterized by high grasses covering vast land areas and sparsely dense trees and shrubs. Some grasses and tree species are also grown on the hilly parts of the state, trees of high economic value such as mango tree, locust bean tree, shea butter tree, banana and the citrus tree can also be found scattered across particularly the low land valley area. This vegetation zone houses several animal species in the area and it changes in density from season to season. Forest reserves are mostly allocated and developed close to the major urban cities such as Keffi, Akwanga, Wamba and Lafiya.
Clear chance of vegetation for farming, fuelwood extraction for domestic and cottage industrial uses and sawmilling has led to the development of regrowth vegetation at various levels of serial development (Morrissey, 1980). Dense forests are few and far apart. Such forests are found in lowland areas, particularly where population pressure is less on the land (Morrissey, 1980).
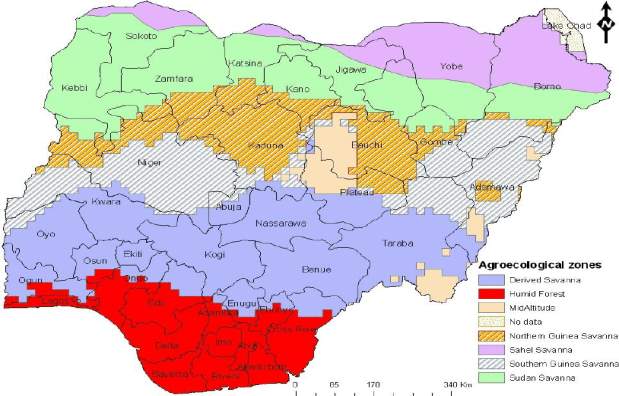
Figure 2: map of Nigeria Showing Vegetation zones of Nigeria (Alamu et al., 2013)
Aims and Objective
Research Aims
- To Examine the causes of deforestation
- To Examine the Effects of Deforestation
- To Determine the extent of deforestation in the study area
Research Objectives
The objective is to Apply Remote Sensing and GIS techniques to determine the degree of deforestation in the study area.
Data and Study Materials
The study relied significantly on the use of both primary and significantly on the use of secondary sources of data.
Primary Data
Primary data types are usually raw data, and they can be collected from journal articles, photographs, audio or video broadcast, Legal or Government documents and other documents created by organizations among the list of others. For this study literatures from other online sources where reviewed, specifically some articles from the Journal of human ecology, a journal of environmental and earth science and the journal of scientific research publishing.
Secondary Data
Secondary data types are ideal for a qualitative research. Analysis done with Secondary data are mostly focused on a quantitative approach and is significantly applied to this research investigation.
Satellite Image
Satellite Image of the study area was downloaded from Earth Explorer, United States Geological Survey (USGS). Thematic Map images for 2013 and 2017 were used. ArcMap 10.6.1 was used for the processing of data.
False composite using bands 5, 4 and 3
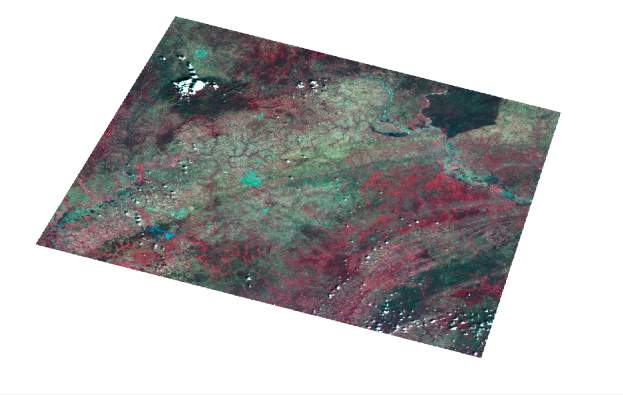
Figure 3: Lafiya 2013
False composite using bands 5, 4 and 3
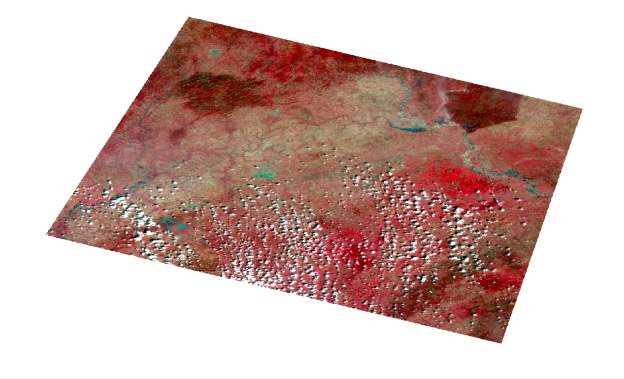
Figure 4: Lafiya 2017
Data and Materials used
The land sat 8 thematic Map was used to generate Image for the study area. The Land sat is fitted with the Operational Land Imager (OLI) sensor and the TIRS sensor two sensors but the Operational Land Imager was chosen because it can Generate Nine Bands. Band combination used is 5 Near Infrared (NIR), 4 (RED) and (GREEN). Landsat 8 has a temporal Resolution of 16 days and 30 meters Spatial Resolution. Satellite images used were for the year 2013 and 2017. The Satellite Features and Specifications are Summarized and presented in the table below.
Data Features and specs
| FEATURES | SPECIFICATIONS |
| Satellite | Landsat 8 |
| Sensor | OLI |
| Band combo | 5,4 and 3 |
| Year | 2013 and 2017 |
| Temporal Resolution | 16 days |
| Spatial Resolution | 30 Meters |
Figure 5: Data table
Methodology
Satellite Data
The study seeks to examine the degree of deforestation in Lafiya general area of Nasarawa state of Nigeria. To achieve this, satellite image produced by the land sat 8 thematic mappers was obtained from the United States Geological Survey (USGS), the earth explorer. Images of the study area for April 2013 and February 2017 Covering the time period of four years from where obtained.
False colour composite was created in the image using the spectral band combination of 5 (Near Infrared), 4 (red), 3 (Green) which is suitable for vegetation analysis because of the high reflectance property of green vegetation which also varies in vegetation types.
Flow chart
Figure 6: Flow chart
Image Pre Processing
Image Preprocessing is an important step to take before analysis. There are basically three steps in preprocessing a satellite image, they are; 1) Atmospheric correction, 2) Image Cropping and 3) Georectification or Georeferencing. The first step was not performed because of the cloud cover present and visibly seen when observing the images were very minimal and in some areas, there was no visible cloud cover is seen at all (total absence).
Following atmospheric correction, the image was cropped using Arc Map clipping tool to reduce the size of the land area and to confine study to the specific affected area. This was informed by observing the initial image in its original format. The downloaded images were originally georeferenced on download but the cropped area was georeferenced by assigning projections in (UTM, WGS 1984). This is necessary to keep together every possible information in the image.
Image Classification
Image Classification can either be Supervised or Unsupervised. For the purpose of this study, an unsupervised classification was performed because of its precision to indicate land cover types most especially where the features are not clearly defined by boundaries. The unsupervised classification works by using the spectral signatures from each pixel to determine classes and which of it to place the pixel in. However, to determine the general types of land cover in the study area, one image of the study area was selected randomly and classified into six classes to give a general idea of the types of land cover present in the area. This is shown in the image displayed below.
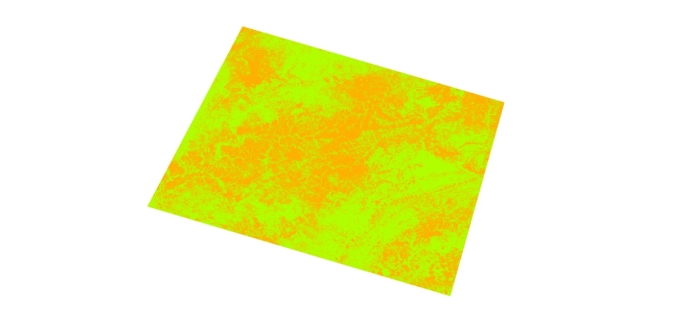
Figure 7: False colour composite of Lafiya 2013
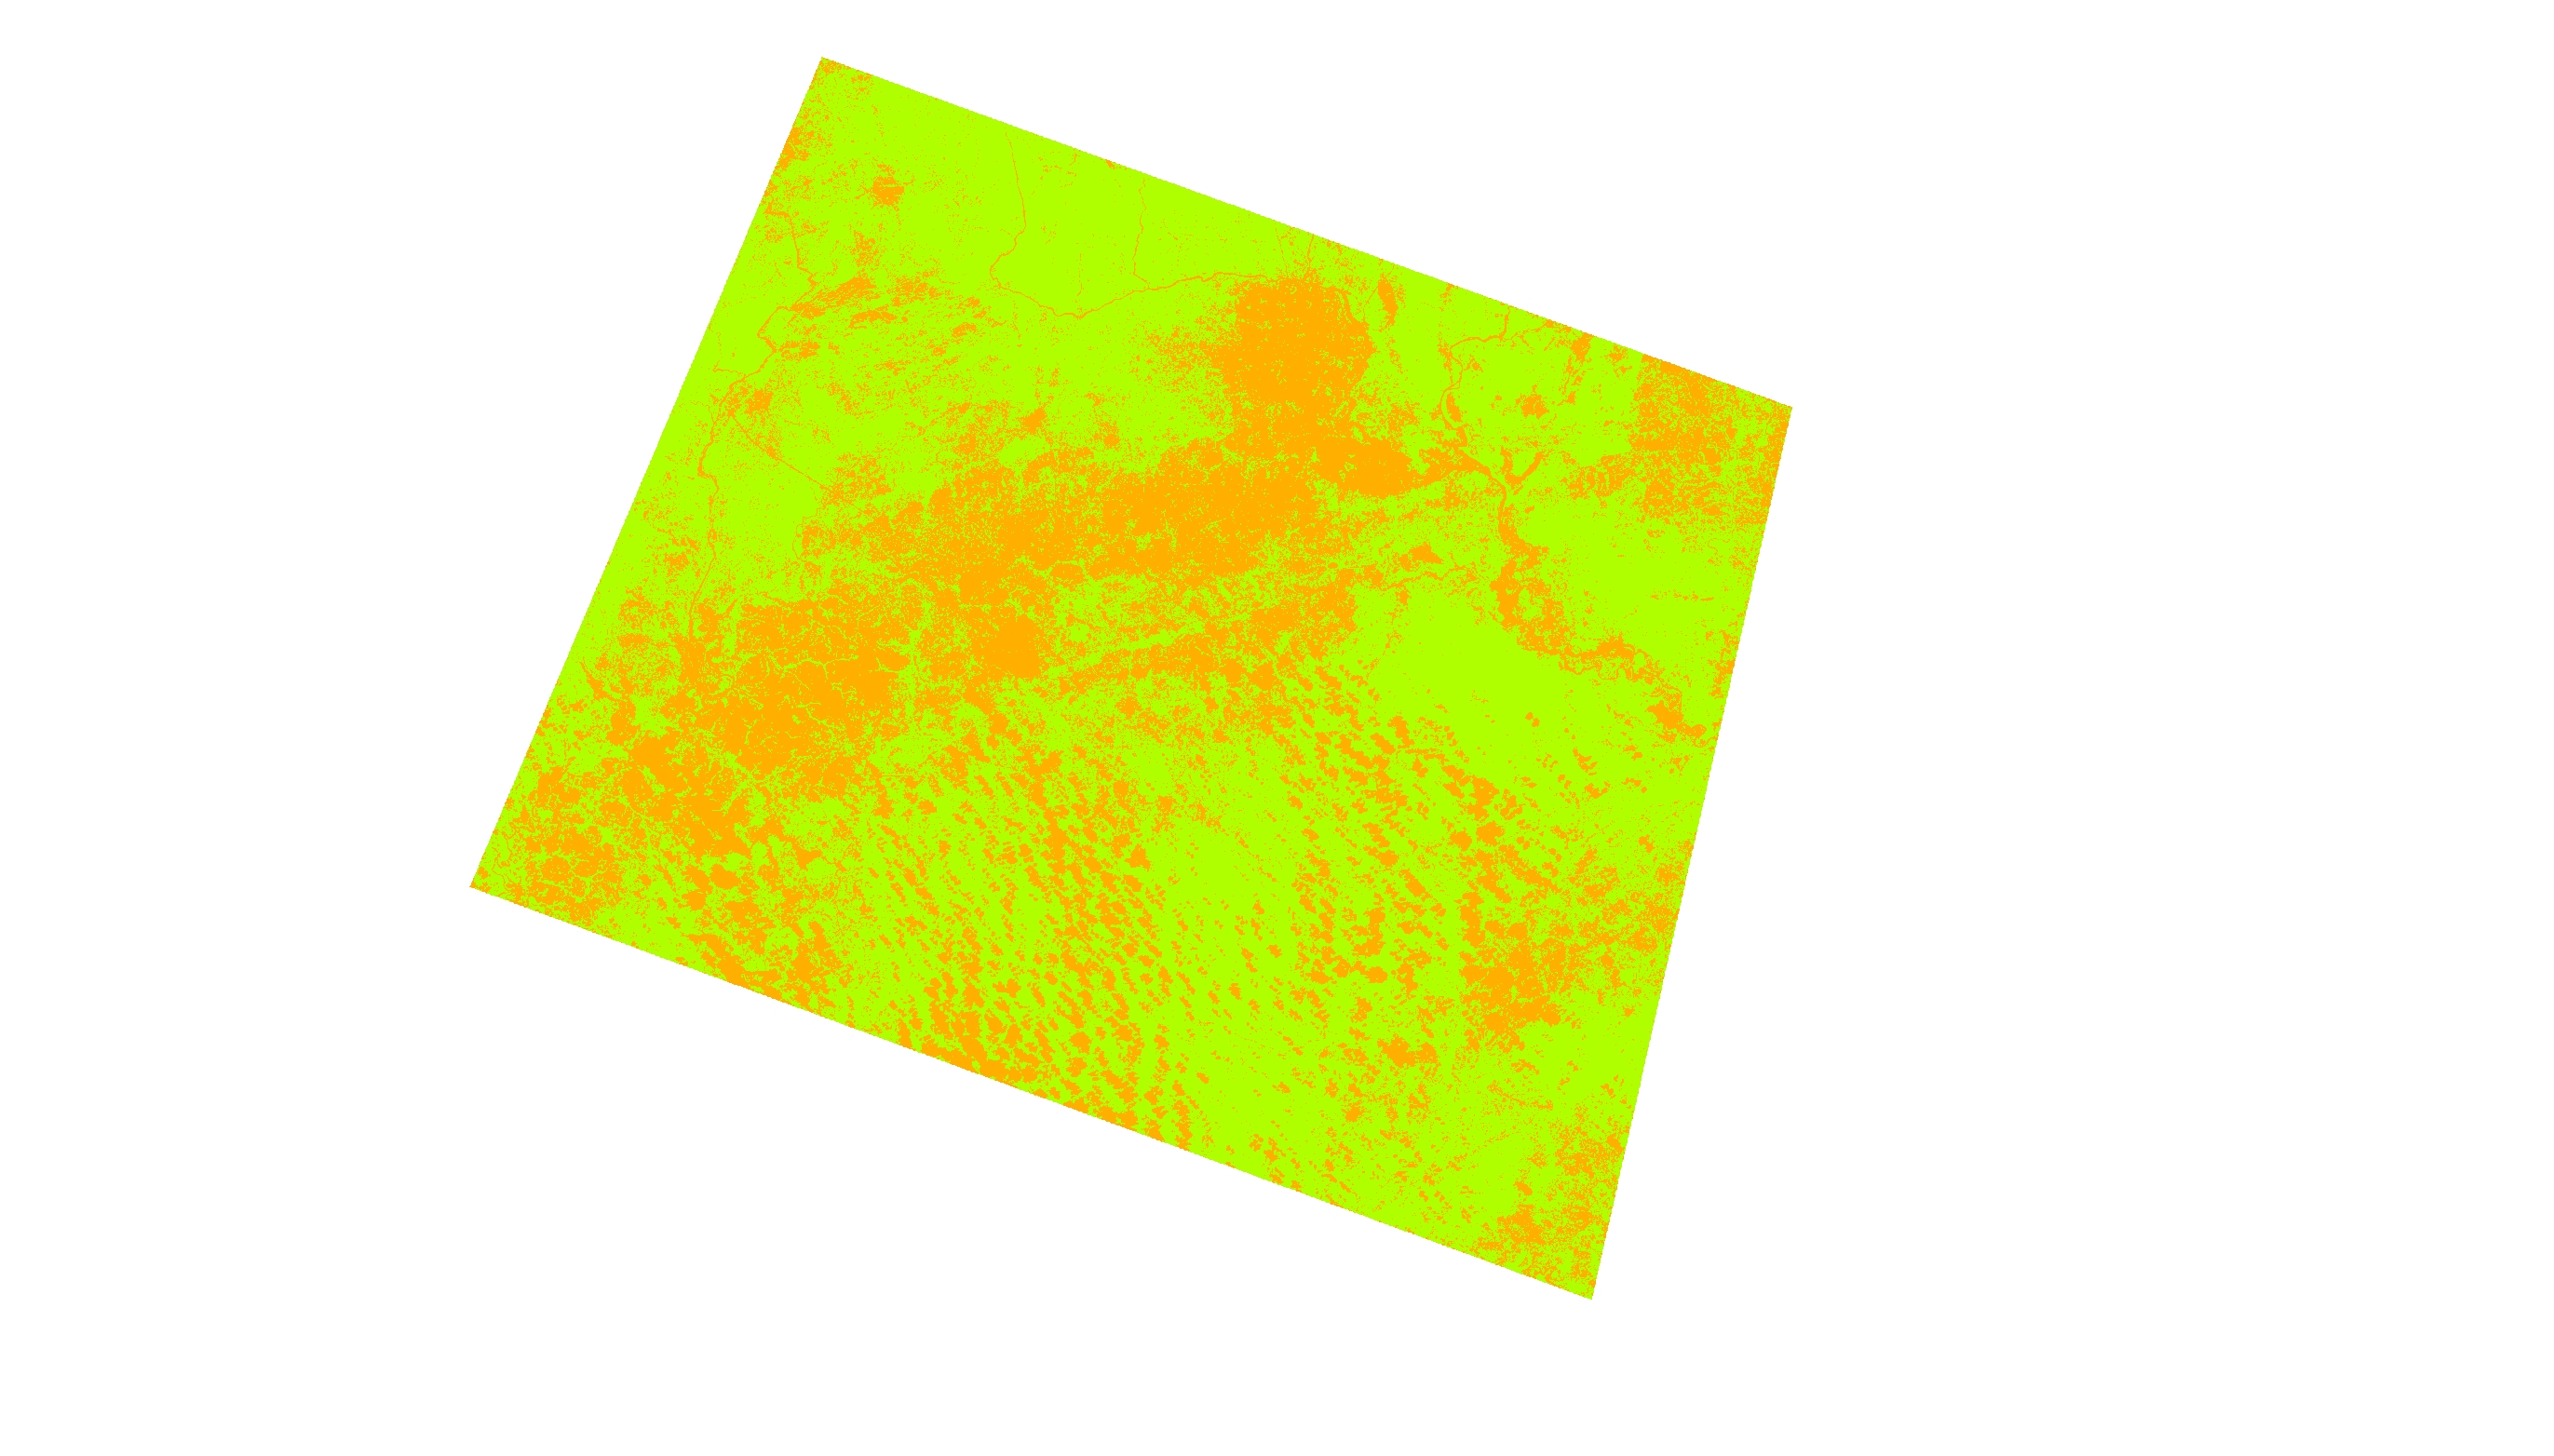
Figure 8: False colour composite of Lafiya 2013
NDVI Change Detection
The Normalize Deference Vegetation Index is a graphical indicator used to analyze measurement and assess whether target areas contain green vegetation as required. It is efficient for vegetation analysis as its function involves subtracting the values generated for an image from another image. Vegetation index reflects the approximation relation between the spectral response and vegetation cover, the essential characteristics of desertification are the lower the productivity of land and changes in vegetation index can reflect the changing process of land productivity [1]. Therefore vegetation index can be used as desertification monitoring indicators to monitor land desertification and dynamic changes.
The index is represented by;
NDVI = (Near Infrared – Red) / (Near Infrared + Red)
After classification of both images in false colour composite, a Normalize vegetation index was computed from the two multispectral image layers of Lafiya 2013 and 2017 using ArcMap image analysis tool and then a differencing was done to detect the level of change in the study area. This is achieved by deducting the values of the former image (Lafiya 2017) from the later (Lafiya 2013)
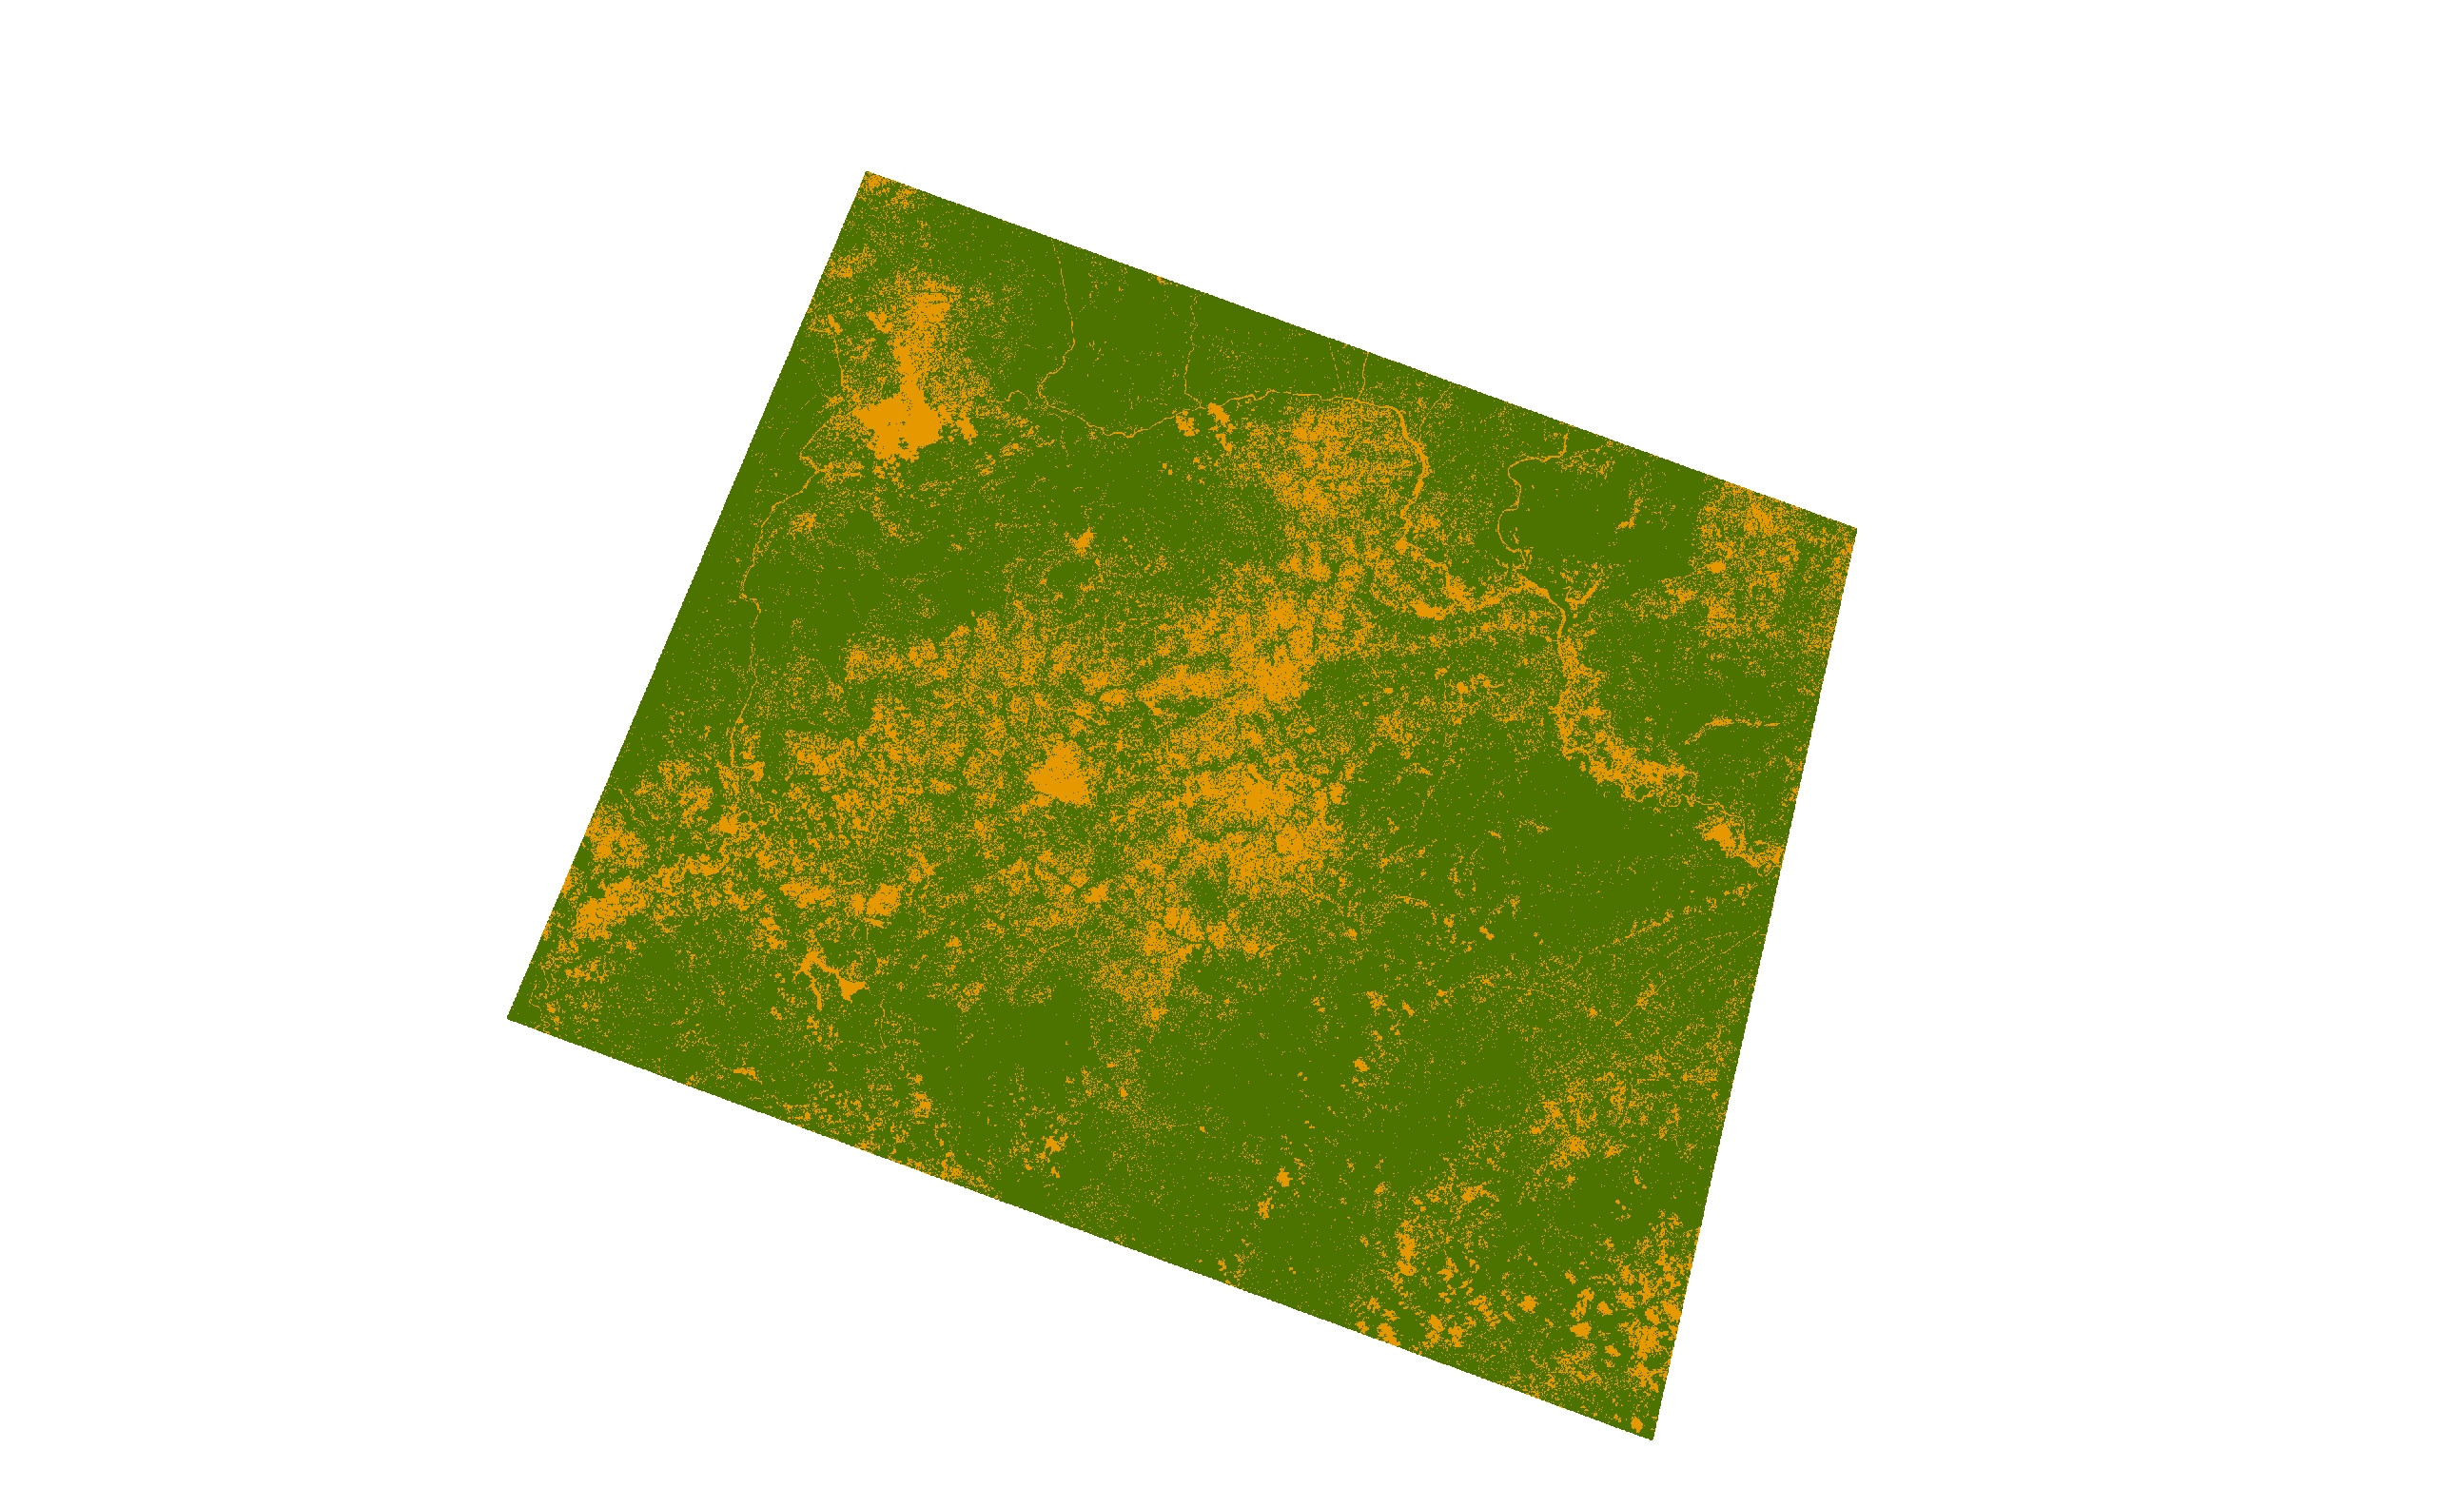
Figure 9: NDVI Lafiya, 2013
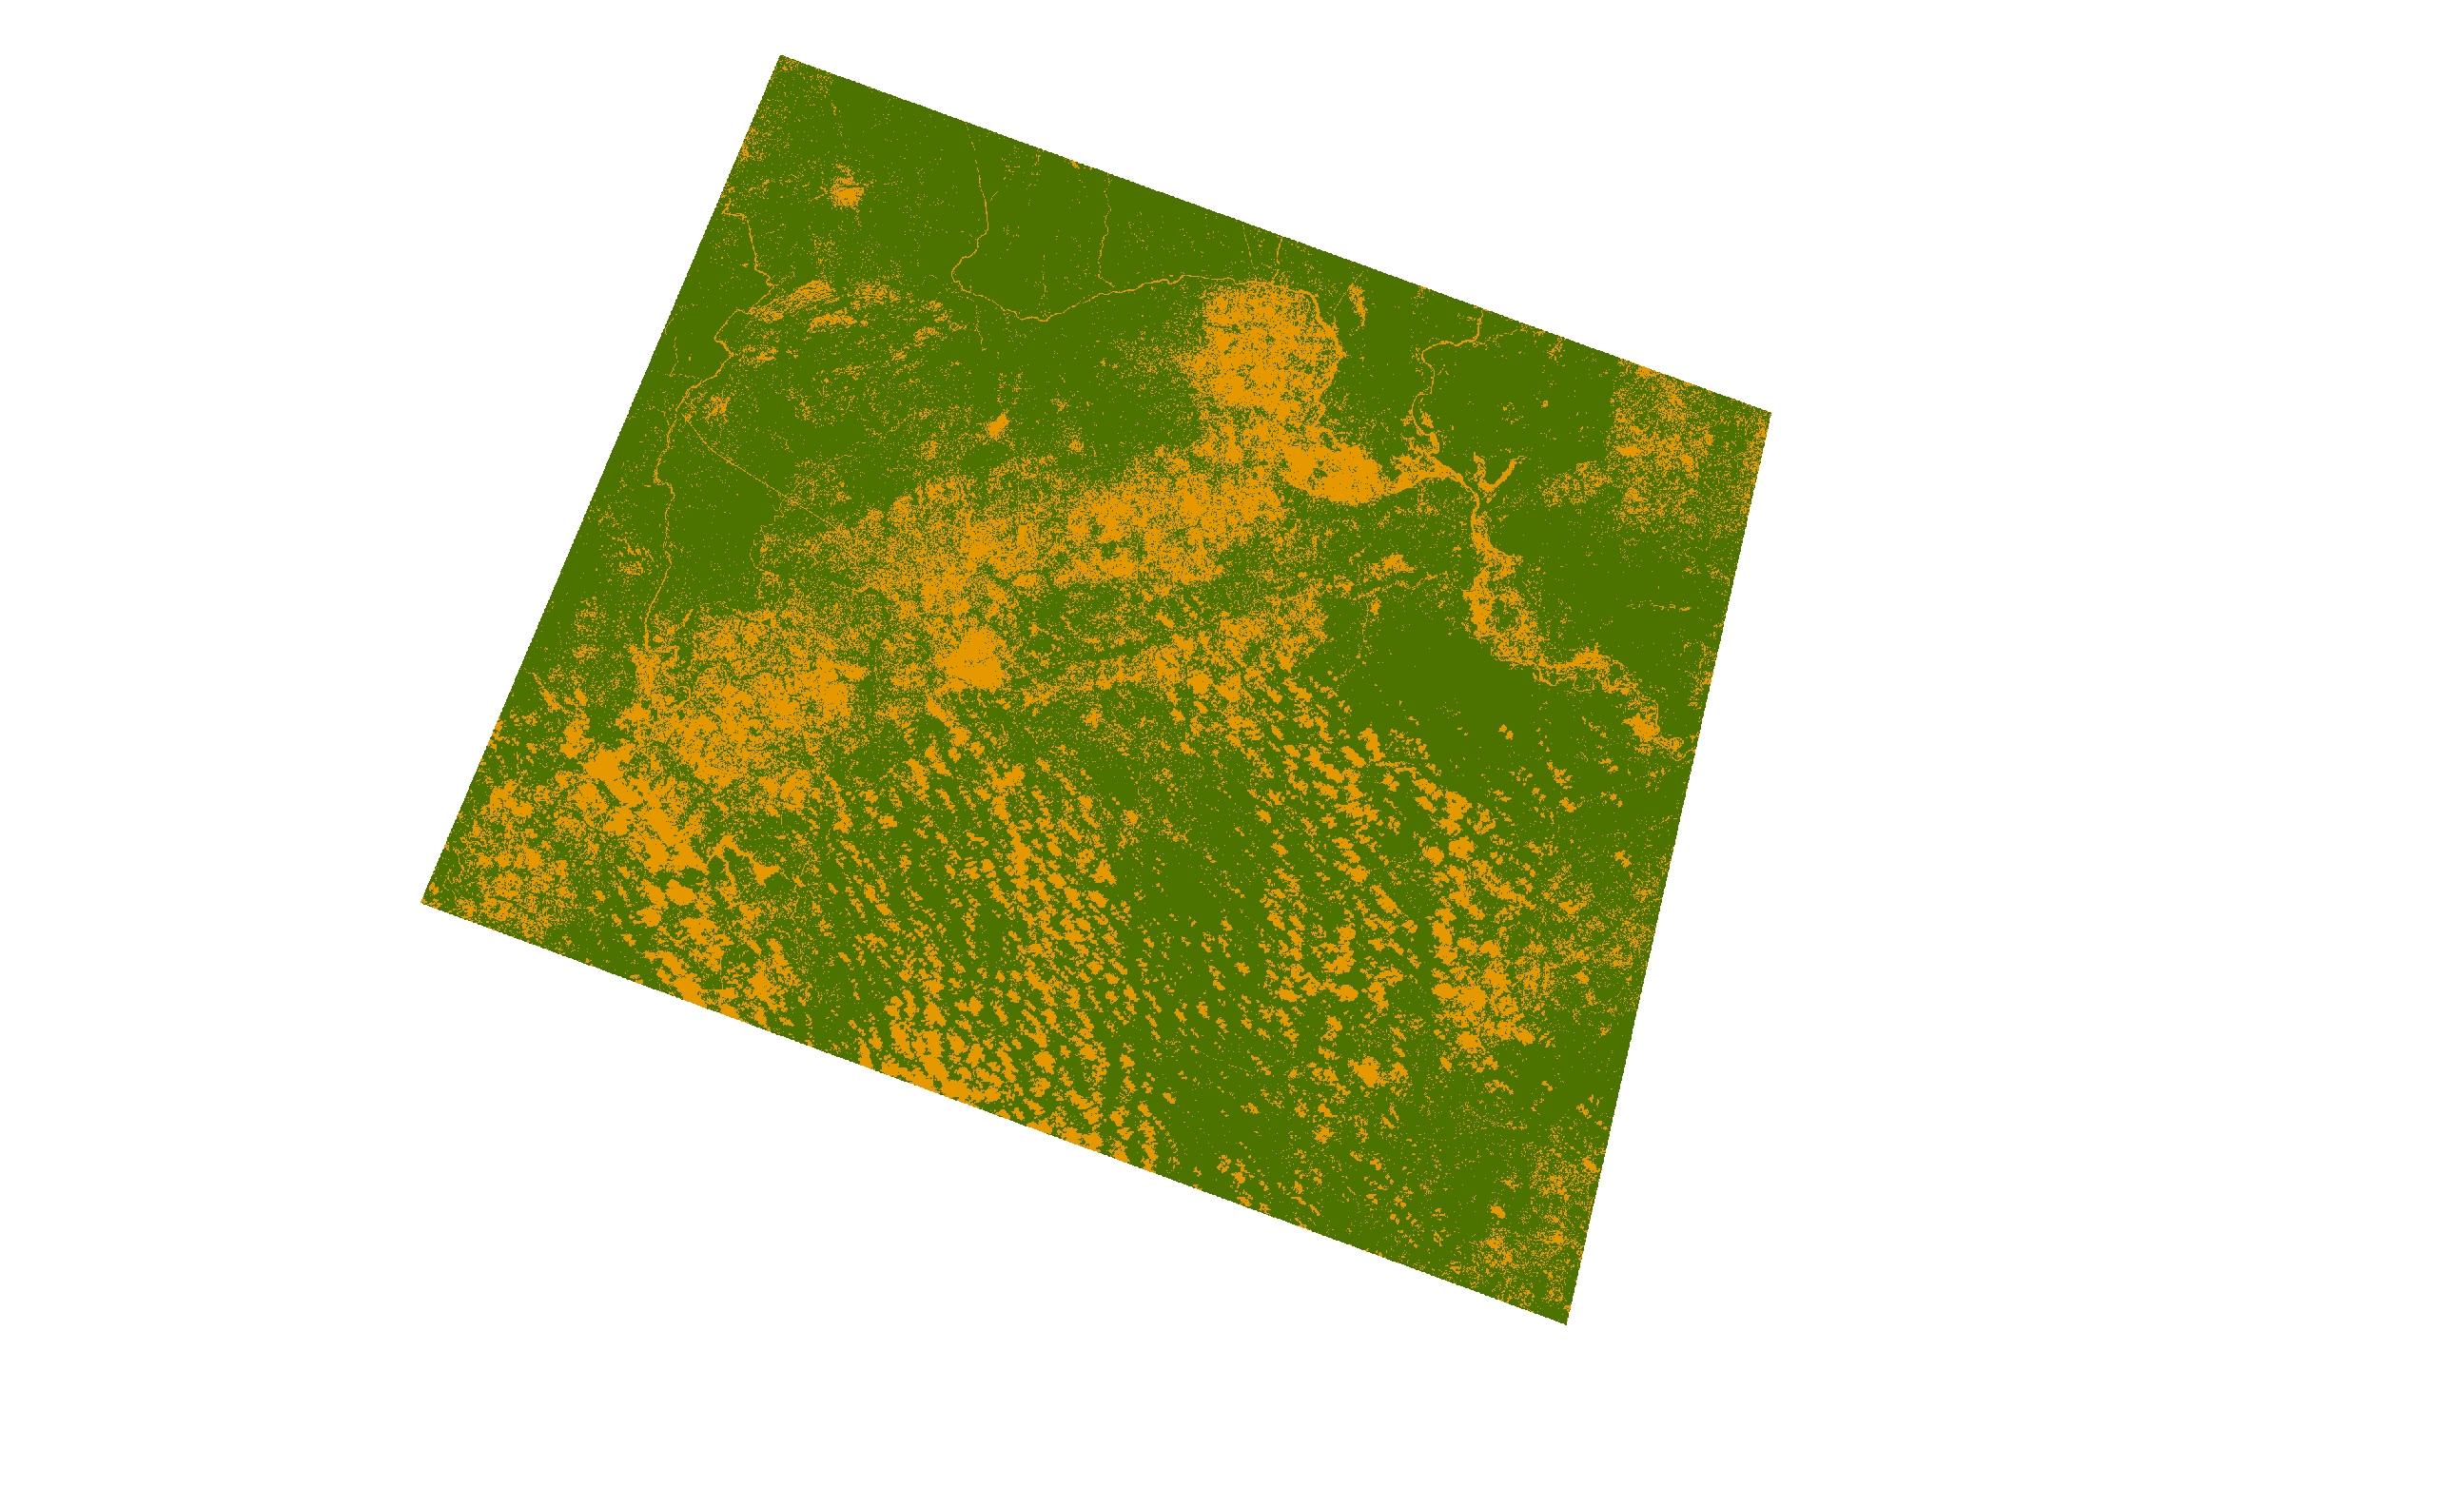
Figure 10: NDVI Lafiya, 2017
Graphs showing NDVI representation of land cover by their Values
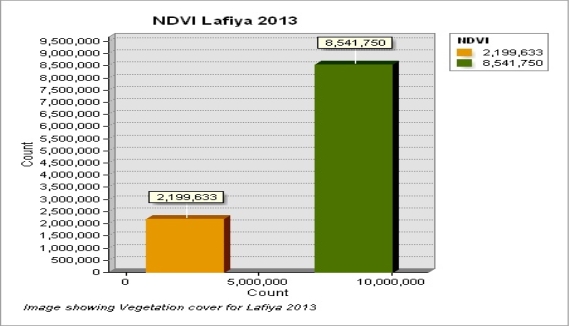
Figure 11: NDVI 2013 Graph
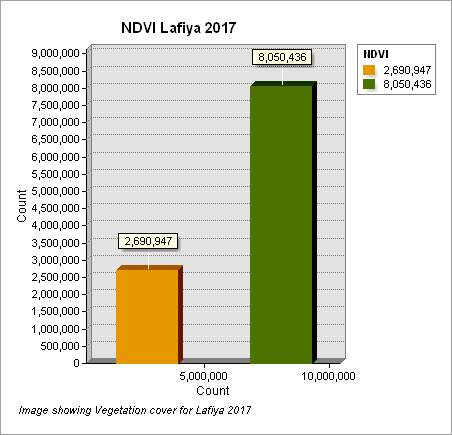
Figure 12: NDVI 2017 Graph
Analysis of Result
The images presented above was observed and there were changes detected, it shows a minimal but significant change in vegetation cover of the study area and the Normalized Difference Vegetation Index (NDVI) calculation supports this argument. The Values presented in the graphs figure 8 and figure 9 above also supports this analysis. The estimated land area is 10,741,383 meter square, in 2013 the total vegetation cover was estimated to be about 8,541,750 meter square and the nation vegetation area was 2,199,633 while in 2017, the vegetation land cover was 8,050,436 meter square and the nation vegetation land cover was estimated to be 2,690,947 meters squared. This simple vegetation difference comparison indicates that about 5.75% of vegetation cover was lost from the period of 2013 to 2017.
RECOMMENDATION
The importance of vegetation cover cannot be overemphasized, this is because vegetation, in whatever shapes and sizes they occur (Trees, shrubs and grasses) are home to microorganisms, small and large animals alike. Vegetation plays a very important role in the balance of temperature and prevention of severe natural occurrences like high-speed winds, flooding, landslides etc.. There are several measures that could and should be taken to curb Deforestation and prevent desert encroachment in Lafiya as follows:
Indigenes and dwellers of the locality should be enlightened about what Deforestation is and the possible causes and how it affects them directly. Efforts should be made towards Reforestation by planting trees as much as they are cut down simultaneously to prevent loss. Afforestation should be practised also to ensure replenishment of forest reserve this can be done by allocating designated areas for green preservation. An alternative source of energy should be explored to reduce pressure on plants and legal government enforcement should be put in place to tackle the illegal destruction of the green reserve.
CONCLUSION
This study further unveils the ongoing process of deforestation and the major factors in play that leads to deforestation and desertification of the case study area and its surrounding environment as well as other towns and communities. Certain anthropological factors such as agricultural extension, life stock ranching, logging, infrastructural expansion and overpopulation are the major contributors to the process of deforestation. Green plants are crucial to our human survival as they are the only natural source of oxygen which is needed to sustain the body respiratory system. It is eminent to conserve natural resources most especially green vegetations. This is an environmental issue that is resulting in severe consequences like climate change and global warming. With the advent of the computer age and advancement in technology, we have been blessed with all the necessary tools to investigate and create awareness of issues that could affect our well being. The use of powerful mapping and image processing tools like ArcGIS, ERDAS, QGis and ENVI to name but a few, have proven to be reliable for data analysis to provide the necessary information and to create awareness and also information derived through this platform can be used for effective decision making, disaster management and future planning Advancement The study will also examine potential mitigation measures to be adopted in other to curb the destructive effect of Deforestation.
REFERENCES
Alamu, O.T., Amao, Nwokedi, C.I., Oke, O.A. and Lawa, I.O. 2013. Diversity and nutritional status of edible insects in Nigeria: A review. International Journal of Biodiversity and Conservation. 5(4), pp.215–222.
America, N., America, C. and America, S. 2018. Deforestation by region. , pp.1–9.
Butt, A., Shabbir, R., Ahmad, S.S. and Aziz, N. 2015. Land use change mapping and analysis using Remote Sensing and GIS: A case study of Simly watershed, Islamabad, Pakistan. Egyptian Journal of Remote Sensing and Space Science. 18(2), pp.251–259.
Kumar, P., Rani, M., Pandey, P.C., Majumdar, A. and Nathawat, M.S. 2010. Monitoring of deforestation and forest degradation using remote sensing and GIS: A case study of Ranchi in Jharkhand (India). Report and opinion. 2(4), pp.55–67.
Morrissey, J. 1980. Physical setting. North. 8, pp.91–139.
NASA 2017. Causes of Deforestation: Direct Causes. Nasa., pp.1–9.
Orga-, A. and Cover, F. 2010. Deforestation in Nigeria See also. , pp.1–3.
Reddy, C.S., Jha, C.S. and Dadhwal, V.K. 2013. Assessment and monitoring of long-term forest cover changes in Odisha, India using remote sensing and GIS. Environmental Monitoring and Assessment. 185(5), pp.4399–4415.
Cite This Work
To export a reference to this article please select a referencing stye below:
Related Services
View all


Related Content
All TagsContent relating to: "Climate Change"
Climate change describes large changes in global or local weather patterns and global warming generally considered to be largely caused by an international increase in the use of fossil fuels from the mid-20th century onwards.
Related Articles

DMCA / Removal Request
If you are the original writer of this dissertation and no longer wish to have your work published on the UKDiss.com website then please: