Effects of Dietary Nitrate on Vascular Function, Platelet Reactivity and Restenosis in Stable Angina
Info: 21553 words (86 pages) Dissertation
Published: 3rd Feb 2022
ABSTRACT
Background
Primary coronary intervention (PCI) is commonly used in reducing the risk of myocardial infarction and providing relief from angina. Nevertheless, rates of secondary events and restenosis of arteries is concern that needs to be addressed. Endothelial dysfunction is thought to contribute to these complications. Modification of diet, has been proposed as a cost-effective strategy to tackle this concern. Studies have shown that nitric oxide (NO) levels in vasculature can be increased through diet, which in turn enhances endothelial function. However, this requires an intact enterosalivary circulation.
Objectives
This project aims to assess whether the enterosalivary circulation remains intact in patients with stable angina. It also aims to investigate the effects of dietary nitrate on the NO-cGMP signaling pathway, which reflects NO bioavailability.
Methods
Double-blind trial on fifty patients with stable angina, undergoing PCI. Patients received either 70ml daily of placebo juice (n=25) or beetroot juice (n=25), for 6 months. Plasma, urine and saliva samples were collected at baseline and after 6 months, and nitrite and nitrate concentrations were determined using ozone chemiluminescence. Plasma samples were also used to determine cGMP levels, using an ELISA kit.
Results
After 6 months, participants in the gamma group had a significant increase plasma cGMP (from 27.3±1.73nmol/L to 38.7±3.21nmol/L; P=0.017), nitrite (from 1.24±0.20µmol/L to 2.62±0.64µmol/L; P=0.03) and nitrate (from 25.2±3.29µmol/L to 183±31.2µmol/L; P<0.0001). There was significant increase after 6 months in the gamma group of saliva and urine concentrations of nitrite and nitrate. No significant changes were found between the baseline of the two groups or after 6 months of treatment in the delta group.
Conclusions
This study demonstrated that the entersalivary circuit remains intact throughout the 6 months of treatment, in patients with stable angina. There is a clear increase in the concentrations of nitrite, nitrate and cGMP in the gamma group postulated to be treated with nitrate. This proof-of-concept data provides evidence that dietary nitrate helps increase NO bioavailability, thus might be a promising strategy in improving endothelial function and preventing complications in patients with angina. However, further work is warranted.
CONTENTS
Click to expand Contents
Abbreviations
List of Figures and Tables
1| Introduction
1.1 Angina and the pursuit for innovative treatment
1.2 The endothelium
1.2.1 Endothelial function
1.2.2 Endothelial dysfunction in cardiovascular disease
1.3 Nitric oxide
1.3.1 The discovery of nitric oxide
1.3.2 The L-arginine-nitric oxide pathway
1.3.3 Nitric oxide synthase
1.3.4 The biological effects of nitric oxide on vasculature
1.3.5 Enterosalivary conversion of nitrate to nitric oxide
1.4 Nitric oxide and the cGMP signaling pathway
2| Hypothesis and Aims
3| Materials and Methods
3.1 Study design and subjects
3.2 Measurement of plasma [cGMP]
3.2.1 cGMP assay
3.2.2 Determination of plasma cGMP levels
3.3 Measurement of plasma, urine and saliva nitrate and nitrite levels [Ozone chemiluminescence]
3.3.1 Determination of nitrite levels
3.3.2 Determination of nitrate levels
3.4 Statistical analysis
4| Results
4.1 Effect of dietary nitrate and placebo on plasma [cGMP] in patients with angina
4.2 Effect of dietary nitrate and placebo on [NO2–] and [NO3–] in plasma samples from patients with angina
4.3 Effect of dietary nitrate and placebo on [NO2–] and [NO3–] in saliva samples from patients with angina
4.4 Effect of dietary nitrate and placebo on [NO2–] and [NO3–] in urine samples from patients with angina
5| Discussion
5.1 Effect of dietary nitrate and placebo on the enterosalivary circuit in patients with stable angina
5.2 Limitations
5.3 Future Work
6| Conclusion
7| References
8| Appendix
ABBREVIATIONS
ACh Acetylcholine
CaM Calmodulin
cGMP Cyclic Guanosine 3’,5’-Monophosphate
CHD Coronary Heart Disease
ELISA Enzyme-linked Immunosorbent Assay
eNOS Endothelial Nitric Oxide Synthase
GTP Guanosine 5’-Triphosphate (GTP) to
iNOS Inducible Nitric Oxide Synthase
NADPH Nicotinamide-Adenine Dinucleotide Phosphate
nNOS Neuronal Nitric Oxide Synthase
NO Nitric Oxide
NO2– Nitrite
NO2 Nitrogen Dioxide
NO3– Nitrate
O3 Ozone
OCT Optical Coherence Tomography
PCI Percutaneous Coronary Intervention
ROS Reactive Oxygen Species
sGC Soluble Guanylate Cyclase
XOR Xanthine Oxidoreductase
LIST OF TABLES AND FIGURES
| Table 1 | List of the atheroprotective effects of the endothelium | 8 |
| Table 2 | Dilutions and volumes injected of the different sample types injected into the
purge vessel to measure nitrite levels |
22 |
| Table 3 | Dilutions and volumes injected of the different sample types injected into the
purge vessel to measure NOx levels |
25 |
| Figure 1 | Illustrates how the endothelium controls vasomotor tone based on different stimuli | 8 |
| Figure 2 | Illustrates the central role endothelial dysfunction has on promoting the
development of cardiovascular disease |
9 |
| Figure 3 | Results from meta-analysis studies demonstrating the increased risk of
cardiovascular disease as a result of endothelial dysfunction |
10 |
| Figure 4 | Production of nitric oxide by endothelial nitric oxide synthase | 12 |
| Figure 5 | Illustrates the outcome of dietary nitrate | 13 |
| Figure 6 | Synthesis, metabolism and function of cGMP | 14 |
| Figure 7 | List of the inclusion and exclusion criteria for the participants in the NITRATE-OCT study | 16 |
| Figure 8 | Summary of the study design | 18 |
| Figure 9 | Principle of the cGMP competitive enzymeimmunoassay system | 19 |
| Figure 10 | Typical standard curve generated from known standards | 20 |
| Figure 11 | Setup of the ozone chemiluminescence used in the measurement of nitrite
concentrations in filtered plasma, urine and saliva samples |
23 |
| Figure 12 | Generation of the NaNO2 calibration curve | 24 |
| Figure 13 | NaNO2 Calibration curve | 24 |
| Figure 14 | Setup of the ozone chemiluminescence used in the measurement of nitrate
concentrations in the filtered plasma, urine and saliva samples |
26 |
| Figure 15 | Generation of the NaNO3 calibration curve | 27 |
| Figure 16 | NaNO3 Calibration curve | 27 |
| Figure 17 | Plasma [cGMP] of the gamma and delta group, at baseline and after 6 months of treatment. | 29 |
| Figure 18 | Change in plasma [cGMP] from baseline of the gamma group and delta group | 29 |
| Figure 19 | Plasma (A) [NO2–] and (B) [NO3–] of the gamma and delta group, at baseline and after 6 months of treatment. | 30 |
| Figure 20 | Change in plasma (A) [NO2–] and (B) [NO3–] from baseline of the gamma and delta
group |
31 |
| Figure 21 | Saliva (A) [NO2–] and (B) [NO3–] of the gamma and delta group, at baseline and after
6 months of treatment |
32 |
| Figure 22 | Change in saliva (A) [NO2–] and (B) [NO3–] from baseline of the gamma and delta
group |
32 |
| Figure 23 | Urine (A) [NO2–] and (B) [NO3–] of the gamma and delta group, at baseline and after
6 months of treatment |
33 |
| Figure 24 | Change in urine (A) [NO2–] and (B) [NO3–] from baseline of the gamma and placebo
group |
34 |
1| INTRODUCTION
1.1 Angina and the pursuit for innovative treatment
Coronary heart disease (CHD) is the most common cause of death worldwide; which is commonly presented as chronic stable angina pectoris. CHD is responsible for more than 70,000 deaths per year in the UK. It is also estimated that 2.3 million people in the UK are now living with CHD; of which approximately 2 million suffer from angina (Bhatnagar et al., 2015). Angina results from the constriction of arteries, mainly due to atherosclerosis. Initially it is stable angina, where substernal chest discomfort arises upon exertion and is relieved by rest and nitroglycerine (Murrell, 1879). However, if left untreated, this can progress into unstable angina where the pain arises even at rest.
The aim in the treatment of angina is to relief pain and reduce disease progression. This helps reduce the risk of future myocardial infarction or death. The primary treatment method used for coronary revascularisation is percutaneous coronary intervention (PCI). The rapid increase in the use of PCI is a result of the improved techniques used for balloon angioplasty as well as coronary stenting. Previous randomised controlled trials have shown a reduction in the PCI complications following the introduction of coronary stents (Altmann et al., 1996). This includes decreased rates of restenosis, hospitalisation and emergency surgery and improved angiographic results (Popma, 2002). Nevertheless, in practice, complications such as coronary restenosis after stenting remains as an unresolved clinical and economic burden (Clark et al., 2005). Drug-eluting stents seem to be more cost effective and reduce restenosis rate more than bare metal stents (Mohan and Dhall, 2010). In simple lesions, the expected restenosis rates are less than 5% within the first year. In complex lesions, rates of restenosis reached 10%; with documented repeat revascularisation of up to 17% at 5 years (Teirstein, 2010).
Another complication that arises as a result of PCI, is early stent thrombosis. This this a rare but serious complication, occurring at a rate of 0.75 to 2% within 30 days after stenting. This is due to the damage of the endothelial integrity as a result of vascular injury. The endothelial damage causes an inflammatory response, increasing the proliferation and recruitment of smooth muscle cells, leading to platelet reactivity and intimal hyperplasia (Bonello et al., 2011).
Collectively, these factors exemplify the importance of the endothelial function and demonstrate how its damage could lead to the pathophysiology of stent-associated vascular complications, which includes restenosis (Munk et al., 2011). Therefore, these findings highlight a significant need for the discovery of new treatments that would help in reducing the rates of restenosis even further. Focussing on new treatment tactics that adjust major but modifiable risk factors, such as diet, is also of great benefit as it can also be used as a preventative strategy as well.
1.2 The endothelium
1.2.1 Endothelial Function
Anatomically, the endothelium can be defined as simple squamous epithelium found in the inner cellular lining of the blood and lymphatic vessels (Florey, 1966). Endothelial cells develop from the mesoderm by the differentiation of hemangioblasts (Aird, 2007). It has various physiological functions such as in immunity, blood cell trafficking, permeability and vasomotor homeostasis, as summarized in Table 1. Thus, plays an important role in minimising the risk of plaque formation.
| Favourable effects of a Healthy Endothelium |
| Promotion of vasodilation |
| Antioxidant effects |
| Antiinflammatory effects |
| Inhibition of leukocyte adhesion and migration |
| Inhibition of smooth muscle cell proliferation and migration |
| Inhibition of platelet aggregation and adhesion |
| Anticoagulant effects |
| Profibrinolytic effects |
Table 1: List of the atheroprotective effects of the endothelium (Adapted from Bonetti et al 2002).
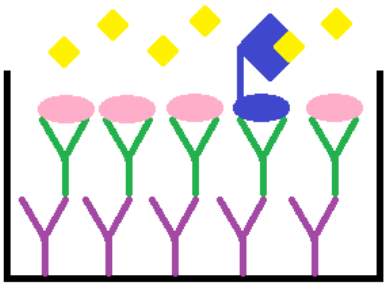
Figure 1: Illustrates how the endothelium controls vasomotor tone based on different stimuli (Redrawn and adapted from Tousoulis, 2005).
The endothelium has an important role in controlling cardiovascular tone via the release of autocrine and paracrine molecules. As shown in Figure 1, a healthy endothelium is characterised by the balance between the secretion of molecules that cause vasodilation such as nitric oxide (NO) and those that cause vasoconstriction such as endothelin.
1.2.2 Endothelial dysfunction in cardiovascular disease
Endothelial dysfunction is the deleterious modification of endothelial physiology defined by the decrease in availability of vasodilators, particularly NO. This leads to an imbalance between the substances that cause vasodilation and vasoconstriction, shown in Figure 1 (Lerman and Burnett, 1992). A reduction in the bioavailability of NO is a result of risk factors such as hypertension, smoking, and genetic predisposition, as illustrated in Figure 2.
Figure 2: Illustrates the central role endothelial dysfunction has on promoting the development of cardiovascular disease.
Traditional (smoking, hypertension), non-traditional (homocysteine, inflammation), local (shear stress) and genetic risk factors all contribute to an atherogenic vascular state (Redrawn and adapted from Bonetti et al 2002).
Moreover, endothelial dysfunction involves a state of activation, where the endothelium has a proliferative, proinflammatory and procoagulatory milieu; promoting the remodelling of vessels and vascular stiffness (Kinlay and Ganz, 1997). This characterizes the early stages in the development of atherosclerosis and progression of plaque formation, ultimately leading to vascular complications (Epstein and Ross, 1999). Endothlial dysfunction causes increased oxidative stress which activates NF-kB, promoting inflammation (Peng et al., 1995).
This results in an increased expression of adhesion molecules such as P-selectin that activate platelets and promote their aggregation (Lip et al., 1995). Therefore, as demonstrated by the results in Figure 3,endothelial dysfunction can be used as a marker of adverse cardiovascular outcome as clearly there is a link between endothelial dysfunction and atherosclerosis (Hadi et al., 2005). As first described by Ludmer and colleages, endothelial function in coronary arteries can be evaluated by quantifying their vasomotor response to acetylcholine (Ach) using coronary angiography. Ach caused vasoconstriction, reflecting endothelial dysfunction, in patients with angiographic signs of atherosclerosis (Ludmer et al., 1986).
Moreover, other techniques that assess endothelial function include flow-mediated dilatation, where the brachial artery is used as it is easily accessible. It can be used in risk stratifying patients at high risk of cardiovascular events. However, currently there are no non-invasive and standardised techniques that can be used in clinics to assess endothelial function (Ganz and Vita, 2003).
Figure 3: Results from meta-analysis studies demonstrating the increased risk of cardiovascular disease as a result of endothelial dysfunction.(A) Association between coronary or peripheral endothelial dysfunction and the risk of adverse cardiovascular event, (B) Results from individual studies with different number of patients and duration of follow up, all highlighting the increased risk (Reproduced, with permission from Lerman and Zeiher, 2005).
1.3 Nitric Oxide
1.3.1 The discovery of nitric oxide
In 1980, Furchgott and Zawadzki confirmed that the presence of intact endothelium is important, for acetylcholine (Ach) to induce relaxation in isolated rabbit aorta. If the endothelium is denuded or damaged, the blood vessel no longer relaxes, however it still responds to nitroglycerin. This is because Ach acts directly on the underlying smooth muscles causing vasoconstriction. This highlighted the importance of the endothelium in the Ach-induced vasorelaxation, which occurs via a messenger, initially labelled as “endothelium-derived relaxing factor” (Furchgott and Zawadzki, 1980). This sparked the interest of researchers to identify EDRF. In 1986, Ignarro and Furchgott independently proposed that NO has the same biological properties as EDRF (Ignarro et al., 1988; Furchgott, 1988). This finding was then confirmed in the following year (Ignarro et al., 1987, Palmer et al., 1987)
1.3.2 The L-arginine-nitric oxide pathway
NO generated by the endothelium is made from the guanidine-nitrogen atoms of the amino-acid L-arginine. This reaction is catalysed by the endothelial isoform of NO synthase and generates the byproduct L-citrulline (Schmidt et al., 1988; Palmer et al., 1988). NO has a short half-life of 10-60s (Knowles and Moncada, 1992); as it gets oxidised to nitrite then to nitrate by oxygenated haemoglobin and superoxide anions; which then gets excreted into the urine (Wennmalm et al., 1992; Moncada and Higgs, 1993). The synthesis of NO from L-arginine involves cofactors such as NADPH, tetrahydrobiopterin, oxygen and calmodulin (Bredt and Snyder, 1990; Moncada and Higgs, 1995).
1.3.3 Nitric oxide synthase
Three NO synthase isoforms have been identified: neuronal (nNOS), inducible (iNOS) and endothelial (eNOS) isoforms (Forstermann et al., 1994). They all have roles in the regulation of vascular tone. Endothelial NO synthase (eNOS) is located in invaginations in the cell membrane called calveolae (Smart et al., 1996). The activity of eNOS is blocked by caveolin-1 which is found bound to calmodulin (Garcia-Cardena et al., 1997). As seen in Figure 4, certain stimuli causes the release of calcium from intracellular stores. Examples of these stimuli include shear stress, bradykinin, substance P, acetylcholine and adenosine 5’-triphosphate (Furchgott and Vanhoutte, 1989). This promotes calcium binding to calmodulin, which releases caveolin-1 and activates eNOS, thus catalysing the production of NO.
Figure 4: Production of nitric oxide by endothelial nitric oxide synthase (Redrawn and adapted from Davignon and Ganz, 2004).
1.3.4 The biological effects of nitric oxide on vasculature
The vascular tone is maintained due to an equilibrium between NO which is a potent vasodilator and vasoconstrictors and effects of the sympathetic nervous system. Additionally, NO has various favourable antiatherogenic properties. This includes the cGMP-dependent down-regulation of P-selectin on endothelial cells and platelets, which inhibits leukocyte-endothelial cell interactions and platelet aggregation (Ahluwalia et al., 2004). NO also inhibits vascular smooth muscle proliferation and migration (Sarkar et al., 1996). It also attenuates cytokine-induced activation of the endothelium, thus diminishes the expression of adhesion molecules such as VCAM-1 (De Caterina et al., 1995; Kubes et al., 1991); inhibits the production of superoxide anion (Clancy et al., 1992) and decreases low-density lipoprotein oxidation (Hogg et al., 1993).
Moreover, NO helps reduce blood pressure through its vasodilating properties and has been shown to protect against endothelial ischaemia-reperfusion injury (Webb et al., 2008; Duranski et al., 2005). Moreover, it was found that nitrite has a similar vasoprotective role to NO. In healthy volunteers, nitrite causes vasodilation in the brachial artery that was dose-dependant. This suggests that nitrite is also vital for cardiovascular homeostasis and is vasoprotective (Cosby et al., 2003).
1.3.5 Enterosalivary conversion of nitrate to nitric oxide
NO is not solely generated through the oxidation of L-arginine by nitric oxide synthase. In certain conditions, such as low oxygen and pH, nitrate (NO3-) is reduced to nitrite (NO2-) which generates NO (Gladwin et al., 2005). Nitrate and nitrite tissue concentrations can be increased through diet, particularly from green leafy vegetables like lettuce and beetroot (Lundberg et al., 2009). As shown in Figure 5, dietary nitrate is absorbed from the upper gastrointestinal tract into circulation and concentrated by 2-fold (Kapil et al., 2010).
However, approximately 75% of nitrate ingested is excreted in the urine, with highest excretion at around 6 hours after ingestion (Pannala et al., 2003). The remaining 25% of nitrate is concentrated by the salivary glands by up to 20-fold. Facultative lingual bacteria then convert nitrate to nitrite via the enzyme nitrate reductase. Nitrite produced into the saliva is then swallowed and is transported into the stomach (Tannenbaum et al., 1976). The acidic conditions of the stomach further reduces nitrite to NO (Benjamin et al., 1994). Under hypoxic conditions, xanthine oxidoreductase expressed on the surface of red blood cells and vessels exhibit nitrate reducing capability (Webb et al., 2008). Deoxygenated haemoglobin and myoglobin also have nitrite reducing capacity (Gladwin et al., 2005).
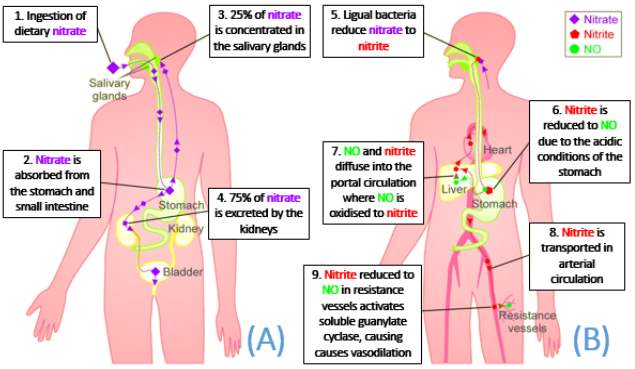
Figure 5: Illustrates the outcome of dietary nitrate. (A) Nitrate absorbed enters the enterosalivary circulation and is concentrated by the salivary gland; whilst the rest is excreted. (B) Lingual bacterial express nitrate reductase which convert nitrate to nitrite. Nitrite is then reduced to NO due to the low pH levels in the stomach. NO then enters systemic circulation where it imposes its vasoprotective effects (Adapted from Webb et al., 2008).
1.4 Nitric Oxide and the cGMP signalling pathway
NO and cyclic guanosine 3’,5’-monophosphate (cGMP) are signal molecules found in most tisses and are important in regulating various processes, such as control of vascular tone and platelet activity (Murad, 1999). As illustrated in Figure 6, NO derived from the endothelium diffuses across the endothelium into vascular smooth muscle cells. It then binds to the prosthetic heme group in the beta subunit of soluble guanylate cyclase (sGC). This catalyses the conversion of guanosine 5’-triphosphate (GTP) to cyclic guanosine 3’,5’-monophosphate (cGMP) (Arnold et al., 1977).
The increase in intracellular cGMP levels causes vasodilation; by activating potassium channels which causes hyperpolarisation and inhibiting calcium channels which decreases intracellular calcium levels. It also inhibits the activity of myosin light chain kinase, which thus causing smooth muscle relaxation (Denninger and Marletta, 1999). Therefore, the measurement of cGMP levels in plasma is a useful in studies of NO-cGMP signal transduction and reflects the levels of NO in the blood (Southam, 2001).
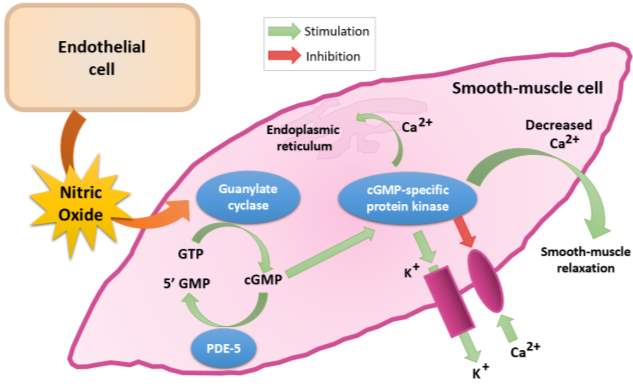
Figure 6: Synthesis, metabolism and function of cGMP (Redrawn and adapted from Fazio, 2004).
2| HYPOTHESIS AND AIMS
Hypothesis
In patients with stable angina, increasing the levels of nitrate in the plasma through diet (beetroot juice) along with conventional therapy has been proposed to enhance vascular function of patients undergoing percutaneous coronary intervention.
Aims
The aims of this project is to assess whether the enterosalivary circuit of patients with stable angina remains intact, despite evidence of endothelial dysfunction. The nitric oxide/cGMP signaling pathway was also assessed to provide evidence of NO activity in patients with angina.
Outcome measures
- Determination of cyclic guanosine monophosphate levels in blood samples at baseline and after 6 months of dietary nitrate or placebo treatment
- Determination of nitrite and nitrate levels in saliva, blood, urine and plasma using ozone chemiluminescence at baseline and after 6 months of treatment
3| MATERIALS AND METHODS
3.1 Study design and subjects
This project was part of the NITRATE-OCT trial (NCT02529189) which aimed at assessing the effects inorganic nitrate has on vascular functions in patients with stable angina undergoing PCI. It attained an ethical approval from the NRES Committee (15/LO/0555). Participants will be recruited from the Barts Heart Centre in St Bartholomew’s Hospital and King George Hospital. They were then screened for the inclusion and exclusion criteria as listed in Figure 7.
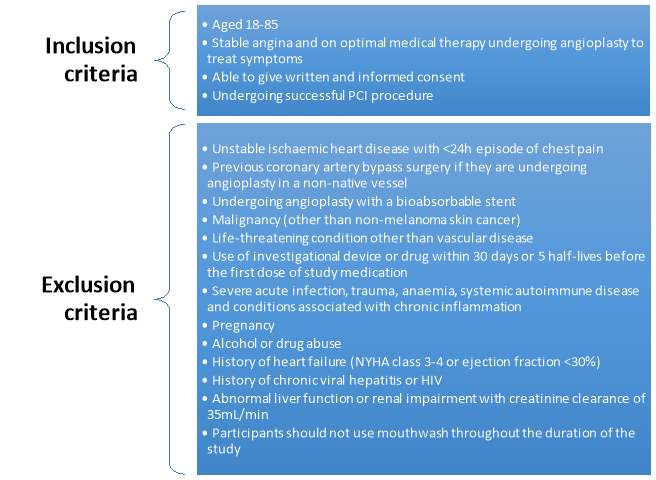
Figure 7: List of the inclusion and exclusion criteria for the participants in the NITRATE-OCT study (Rathod et al., 2016).
246 patients are to be recruited for the NITRATE-OCT study. As the recruitment for this study is still on-going, only 50 participants have been included in this project. Patients will be classified based on whether they will be receiving bare metal stent or drug eluting stent, to avoid any confounding effects on the restenosis rates. The assignment of treatment for volunteers in the dietary nitrate and placebo group will be kept blinded until the end of the study. As it is still ongoing, the two groups have been labelled as “gamma” and delta” and conclusions as to which group was assigned which treatment will determined based on the results. On visit 2, patients have baseline measurements taken as mentioned in Figure 8, which includes a flow mediated dilation and blood test to determine levels of NO and platelet reactivity. Another blood test is taken at visit 3 which is at 6 months (before angiogram and OCT) and at visit 5 at 12 months.
Blood samples were collected into EDTA-containing vacutainers (BD Bioscience), which inhibits coagulation, using 19-gauge butterfly needle inserted into antecubital vein. They were then immediately centrifuged at 1300xg at 4oC for 10 minutes. Supernatant was then aspirated and snap frozen at -80 oC pending measurement of nitrite and nitrate concentration. Blood samples were also collected into phosphodiesterase inhibitor 3‐isobutyl‐1-methylxanthine containing tubes (100µmol/L; Sigma-Aldrich). They were then centrifuged, supernatant aspirated and snap frozen at -80 oC to determine the levels of cGMP. Saliva and urine samples were collected into sterile tubes and aliquots taken. Saliva samples were centrifuged (14000xg, 4oC for 10min). Urine and saliva samples were snap frozen at -80 oC pending ozone chemiluminescence analysis.
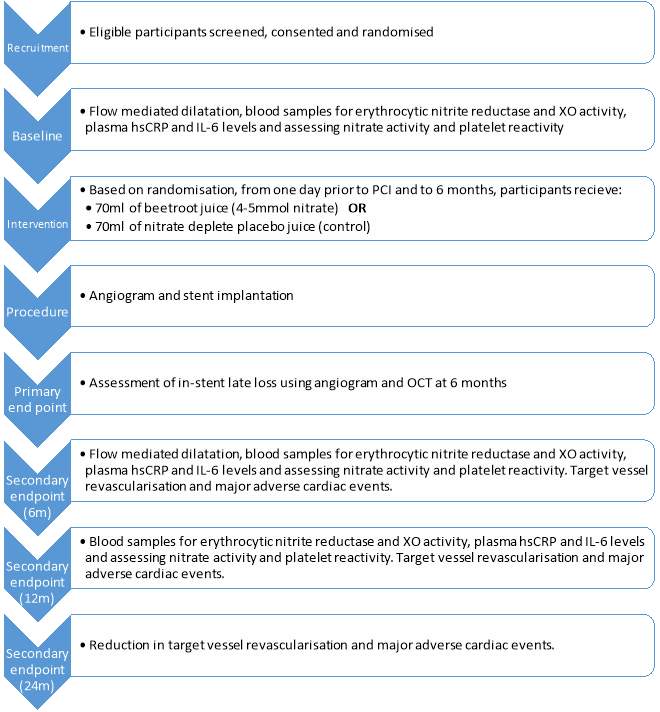
Figure 8: Summary of the study design (Rathod et al., 2016).
3.2 Measurement of plasma [cGMP]
For the majority of the physiological functions that occurs due to NO, cGMP plays an important role as a second messenger. Therefore, by determining the levels of cGMP in plasma samples collected at visit 2, baseline values can be established, which theoretically should be similar in both groups. cGMP levels measured at the second time point (6months) can then be compared to the baseline values. Thus, any changes in these levels would correlate with changes vascular function.
3.2.1 cGMP assay
Competitive enzymeimmunoassay is a biochemical test used in determining the concentration of specific macromolecules in a sample. In this highly specific and sensitive assay, the antigen in the sample competes for a limited antigen binding site on the anti-cGMP antibody, as demonstrated in Figure 9. The unlabelled cGMP from the unknown sample or standard competes with fixed quantities of labelled horse raddish peroxidase conjugated cGMP. Thus, the samples with high levels of cGMP result in higher levels of unlabelled cGMP being bound to the anti-cGMP antibody, compared with the conjugated cGMP. The TMB substrate added will then only bind to the labelled cGMP, developing a blue colour. Therefore, there is an inverse correlation between the intensity of the blue colour formed, after the addition of the chromogenic substrate, and the concentration of unlabelled cGMP in the sample or standard. This relationship can be used to plot a standard curve and extrapolate unknown cGMP concentrations from samples.


Tetramethylbenzidine (TMB) substrate
cGMP- Horse raddish peroxidase conjugate
Unlabelled cGMP
Rabbit anti-cGMP antibody
Donkey anti-Rabbit IgG coated microplate
Figure 9: Principle of the cGMP competitive enzymeimmunoassay system.
3.2.2 Determination of plasma cGMP levels
The ELISA kit (cGMP enzymeimmunoassay Biotrak system RPN226) was used to measure plasma cGMP levels and protocol followed was from the data sheet (GE Healthcare, Little Chalfont, UK). A 1:2 dilution of acetylation standards were prepared. The unknown plasma samples where then diluted 1:20 with assay buffer (25µl plasma and 475ul assay buffer). 50µl of acetylating reagent (1 volume of acetic anhydride to 2 volumes of triethylamine) was added to each of the diluted plasma samples and standards and vortexed immediately. 100µl of antiserum was dispensed into all wells in a 96-well plate except blank and non-specific binding (NSB). 50µl of all the standards and unknown samples where dispensed into their appropriate wells, in duplicates. 150µl of assay buffer was dispensed into the NSB well. The plate was then covered, gently mixed and incubated at 4oC for 2hr.
After incubation, 100µl of diluted conjugate was added into all wells except blank. The plate was then covered again and incubated at 4oC for 1hr. The plate was then washed with wash buffer and 200ul of enzyme substrate was added to all wells. The plate was incubated for 30 minutes at room temperature. Using a Dynex MRX microplate reader (Dynex Technologies, UK), the plate was read at λ=450nm after the addition of 100ul 1M of sulphuric acid into all wells. As shown in Figure 10, the standard curve was then plotted and the concentration of cGMP of unknown samples was calculated (Appendix 1).
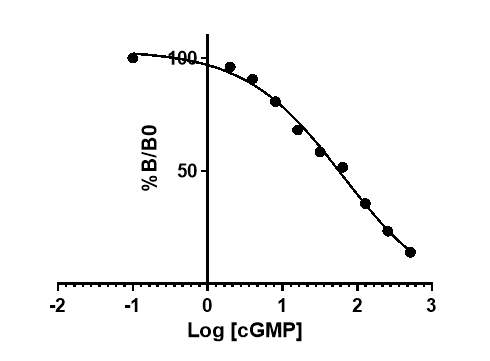
Figure 10: Typical standard curve generated from known standards.
3.3 Measurement of nitrate and nitrite levels in plasma, saliva and urine samples [Ozone chemiluminescence]
Determination of the plasma nitrite levels can be used to reflect the activity of eNOS, which in turn can be used as a prognostic marker for adverse cardiovascular events. Therefore, the development of ozone-based chemiluminescence assays is of great benefit as it is a highly sensitive and reproducible method of quantifying nanomolar quantities of NO and NO related species in biological fluids.
The carrier gas, nitrogen, is bubbled through the sample where NO production is occurring. This then passed on to the reaction cell and is quantified using the NO analyser, Sievers Nitric Oxide Analyser 280. In the reaction cell, NO reacts with ozone (O3), which generates nitrogen dioxide (NO2.) that is in an excited state (1). When the excited state nitrogen dioxide relaxes back to the ground state (NO2), it emits a photon of a specific wavelength (2). The emitted light then goes through a filter and is intensified in a photomultiplier tube and quantified in the analyser. The intensity of the light emitted correlates to the amount of NO present initially in the reaction. Thus, using appropriate reducing agents nitrate and nitrite species can be reduced to NO and quantified.
NO + O3 NO2. + O2 (1)
NO2. NO2 + hv (2)
3.3.1 Determination of nitrite levels
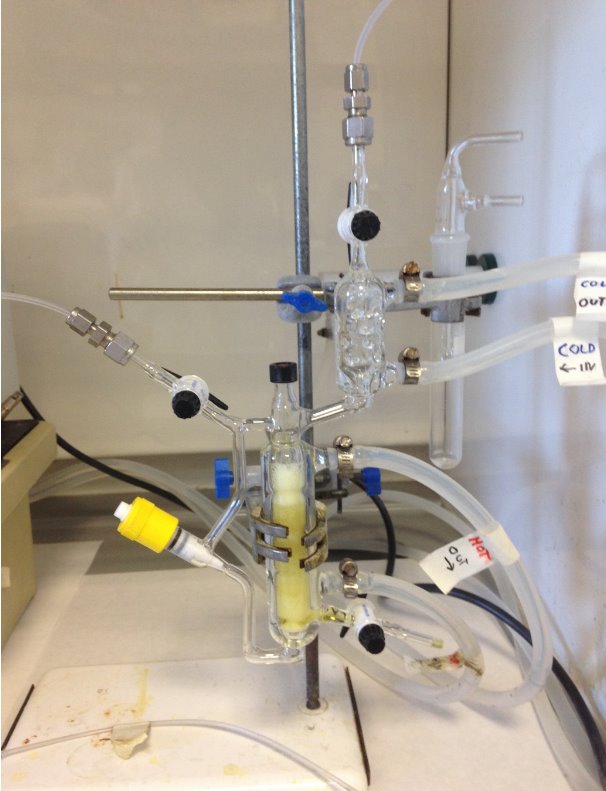
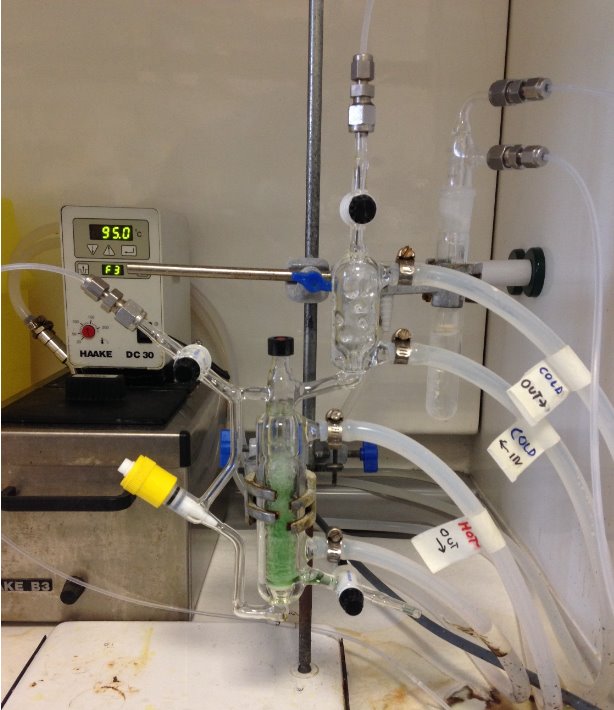
NO can be formed via the reduction of nitrite. When NO is then reacted with O3, NO2. is formed which can be quantified based on the intensity of light signal released when the excited species returns to ground state. The reducing agent used to measure nitrite levels in samples is a solution of 1% potassium iodide (KI, Sigma Aldrich, UK) mixed in glacial acetic acid (C2H4O2, AnalaR NORMAPUR, VWR, UK). 10ml of this reducing agent was injected into the purge chamber and bubbled with nitrogen for 20 minutes to eliminate any oxygen present in the vessel and for the baseline to stabilize, before standard and sample injections (Figure 11).
Calibration curve using known standards of sodium nitrite was constructed every day. This was done by dissolving 0.069g of sodium nitrite (NaNO2, Sigma Aldrich) in 1L of MQ water, which forms 1mM of stock solution. The stock solution was used to prepare dilutions of 10µl, 1µl and 0.1µl. Three MQ water sample 25µl were injected first to ensure a baseline reading with no peak. The nitrite standards were then run in order from the most diluted 0.1µl followed by 1µl and 10µl. Volumes of 20µl, 40µl and 50µl were used for each of the dilutions and a sodium nitrite calibration curve was created, as shown in Figure 12 and 13. Table 2, summarizes the dilutions of each of the samples as well as volume injected. Samples were injected in duplicates to obtain mean concentrations for each sample. Results of control standards and each sample that was run are summarized in Appendix 2 and 3. After the injection of the sample, the nitrite molecules available react with the reducing agent to form NO (3).
I– + NO2– + 2H+ NO + ½ I2 + H2O (3)
| Sample | Dilution | Volume |
| Plasma | No Dilution | 25µl |
| Urine | No Dilution | 30µl |
| Saliva | 1:100 | 10µl |
Table 2: Dilutions and volumes injected of the different sample types injected into the purge vessel to measure nitrite levels.


To Nitric Oxide Analyser
Outlet Stopcock
From N2 Gas Supply
Injection Port
Condenser
Inlet Stopcock
Reducing Agent
Needle Valve
Frit
Drain Stopcock
Figure 11: Setup of the ozone chemiluminescence used in the measurement of nitrite concentrations in filtered plasma, urine and saliva samples.
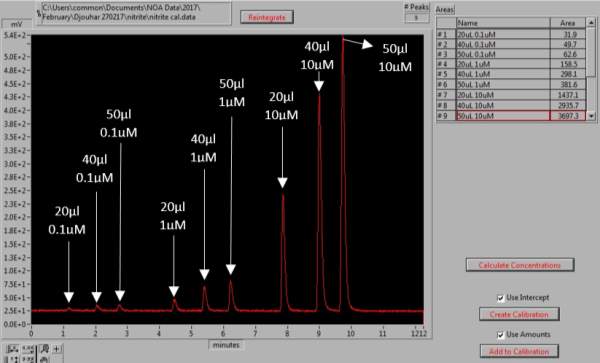
Figure 12: Generation of the NaNO2 calibration curve. The peaks represent the different volumes and concentrations of NaNO2 standards, for which the area under the each peak is determined.
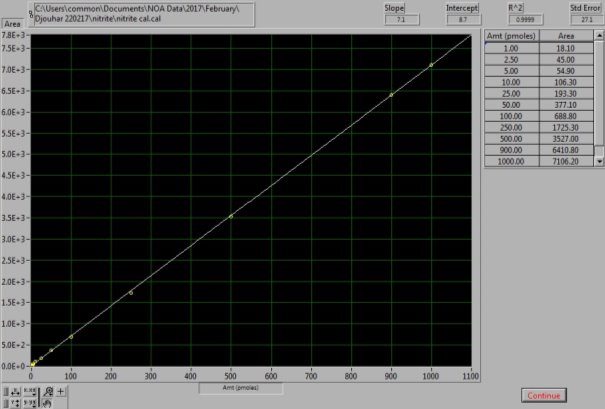
Figure 13: NaNO2 Calibration curve. The calibration curve was generated from known NaNO2 standard solutions.
3.3.2 Determination of nitrate levels
The conditions and set up of the chemiluminescence is slightly different when assessing nitrate levels in samples. The reducing agent used is a 0.1M solution of vanadium chloride (VCl3, Sigma Aldrich, UK) dissolved in 1M hydrochloric acid (HCl, Sigma Aldrich, UK). 6ml of this reducing agent is dispensed into the purge vessel at 95oC and nitrogen is bubbled through. This reducing agent stronger than the one used for the nitrite setup, as it reduces both nitrite and nitrate molecules present in a sample, which is collectively known as NOx. A gas bubbler filled with 8ml of 1M sodium hydroxide (NaOH, Sigma Aldrich, UK). This was connected between the purge vessel and NO analyser (NOA 280A, Sievers), to prevent the HCl vapour from damaging the analyser (Figure 14).
0.085g of sodium nitrate (NaNO3, Sigma Aldrich, UK) was dissolved in 1L of MQ water to prepare 1mM of stock solution. The stock solution was used to prepare the dilutions of 100µM, 10µM and 1µM. For the NOx calibration curve to be created the following injections of standards were made: 20µl, 40µl and 50µl of the 1µM, 20µl, 40µl, 50µl and 70µl of the 10µM and 10µl of the 100µM dilution; as shown in Figures 15 and 16. Vanadium reacts with the nitrate available in the sample to form NO (4). As this setup determines the NOx levels in samples, by subtracting the NO2– , levels obtained from the previous step, from the NOx levels, the amount of NO3– in each sample can be calculated (5).
2NO3– + 3V3 + 2H2O 2NO + 3VO2 + 4H+ (4)
[NOx]– [NO2–] = [NO3–] (5)
Table 3, summarizes the dilutions of each of the samples as well as volume injected. Samples were injected in duplicates to obtain mean concentrations for each sample.
| Sample | Dilution | Volume |
| Plasma | 1:10 | 10µl |
| Urine | 1:100 | 20µl |
| Saliva | 1:100 | 10µl |
Table 3: Dilutions and volumes injected of the different sample types injected into the purge vessel to measure NOx levels.


From N2 Gas Supply
Outlet Stopcock
Condenser
Water Bath
Sodium Hydroxide Tap
Injection Port
Inlet Stopcock
Reducing Agent
Needle Valve
To Nitric Oxide Analyser
Frit
Drain Stopcock
Figure 14: Setup of the ozone chemiluminescence used in the measurement of nitrate concentrations in the filtered plasma, urine and saliva samples.
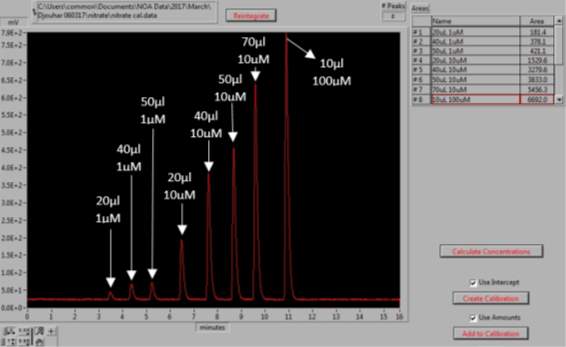
Figure 15: Generation of the NaNO3 calibration curve. The peaks represent the different volumes and concentrations of NaNO3 standards, for which the area under the each peak is determined.
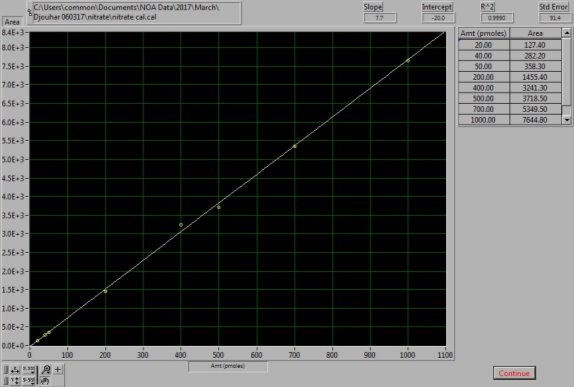
Figure 16: NaNO3 Calibration curve. The calibration curve was generated from known NaNO3 standard solutions.
3.4 Statistical analysis
For statistical comparisons of the plasma [cGMP], paired t-test was applied to compare baseline with the 6 month timepoint within each group. Unpaired t-test was applied to compare differences in 6 months concentrations compared to baseline between the gamma and delta groups. Similarly, for the analysis of nitrite and nitrate levels in plasma, saliva and urine samples; paired t-test was used for within group comparisons and unpaired t-test was used for the comparison of the differences of in 6 months concentration compared to baseline between groups. P-values were all two-tailed and statistical significance was set at P<0.05. All the data analysis and graph generation were performed using GraphPad PrismTM software version 7 and data were expressed as mean ± SEM.
4| RESULTS
4.1 Effect of dietary nitrate and placebo on plasma [cGMP] in patients with angina
There was no significant difference in the baseline cGMP concentration between the two groups (gamma: 27.3±1.73nmol/L; placebo: 29.4±2.21nmol/L; P=0.45). In the gamma group, after being treated for 6 months, plasma [cGMP] was significantly increased from 27.3±1.73nmol/L to 38.7±3.21nmol/L (P=0.017), an increase of 41.8% (Figure 17). However, there was no significant difference measured in the [cGMP] of the delta group (29.4±2.21nmol/L vs 28.7±2.27nmol/L; P=0.15). As demonstrated in Figure 18, the change overall in plasma [cGMP] from baseline was significantly different between the two groups (gamma: 11.7±3.36nmol/L; delta: -0.56±3.36nmol/L; P=0.003).
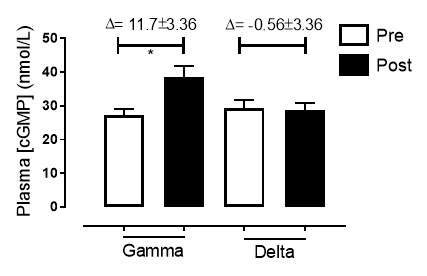
Figure 17: Plasma [cGMP] of the gamma and delta group, at baseline and after 6 months of treatment.The treatment was with either dietary nitrate (nitrate-rich juice 70 mL daily) or placebo (nitrate-depleted juice 70 mL daily). Data expressed as mean ± SEM. n=25 in the gamma group; n=25 in the delta group. Statistical analysis was performed using paired t-test. *P=0.017. Pre indicates baseline measurement preintervention; post indicates postintervention measurement at 6 months.
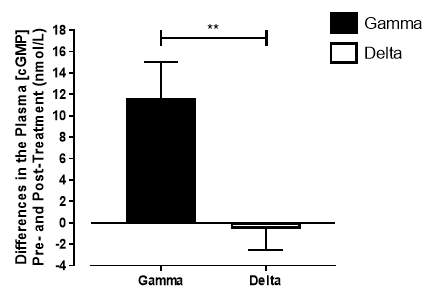
Figure 18: Change in plasma [cGMP] from baseline of the gamma group and delta group. Data expressed as mean ± SEM. n=25 in the gamma group; n=25 in the delta group. Statistical analysis was performed using unpaired t-test. **P=0.003.
4.2 Effect of dietary nitrate and placebo on [NO2–] and [NO3–] in plasma samples from patients with angina
There was no significant difference in the baseline plasma [NO2–]concentration between the two groups (gamma: 1.24±0.20µmol/L; delta: 1.45±0.17µmol/L; P=0.44). After 6 months of treatment, plasma [NO2–] in the gamma group was significantly increased from 1.24±0.20µmol/L to 2.62±0.64µmol/L (P=0.03), an increase of approximately 2-fold (Figure 19A). However, there was no significant difference measured in the [NO2–] of the delta group (1.45±0.17µmol/L vs 1.12±0.17µmol/L; P=0.78). As demonstrated in Figure 20A, the change overall in plasma [NO2–] from baseline was significantly different between the two groups (gamma: 1.38±0.60µmol/L; delta: -0.33±0.19µmol/L; P<0.01).
Similarly, there was no significant difference in the baseline plasma [NO3–]concentration between the two groups (gamma: 25.2±3.29µmol/L; delta: 33.5±7.44µmol/L; P=0.32). After 6 months of treatment, plasma [NO3–] in the gamma group was significantly increased from 25.2±3.29µmol/L to 183±31.2µmol/L (P<0.0001), an increase of approximately 7.3-fold (Figure 19B). However, there was no significant difference measured in the [NO3–] of the delta group (33.5±7.44µmol/L vs 53.54±7.95µmol/L; P=0.07). As demonstrated in Figure 20B, the change overall in plasma [NO2–] from baseline was significantly different between the two groups (gamma: 158±31.2µmol/L; delta:21.3±10.1µmol/L; P<0.0001).
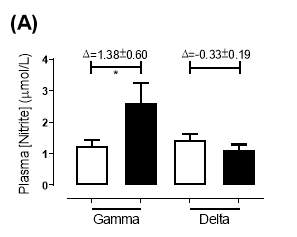
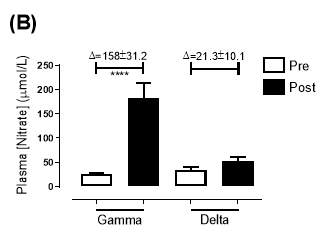
Figure 19: Plasma (A) [NO2–] and (B) [NO3–] of the gamma and delta group, at baseline and after 6 months of treatment. The treatment was with either dietary nitrate (nitrate-rich juice 70 mL daily) or placebo (nitrate-depleted juice 70 mL daily), in patients with stable angina. Data expressed as mean ± SEM. n=25 in the gamma group; n=25 in the delta group. Statistical analysis was performed using paired t-test. *P=0.03; ****P<0.0001. Pre indicates baseline measurement preintervention; post indicates postintervention measurement at 6 months.
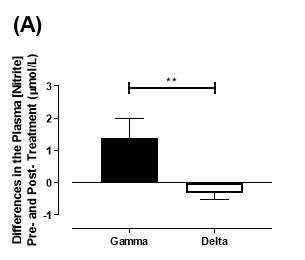
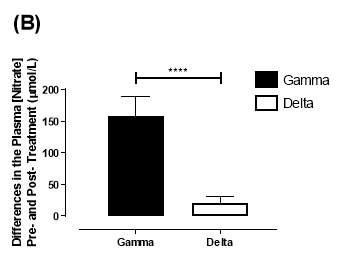
Figure 20: Change in plasma (A) [NO2–] and (B) [NO3–] from baseline of the gamma and delta group.Data expressed as mean ± SEM. n=25 in the gamma group; n=25 in the delta group. Statistical analysis performed was unpaired t-test. **P<0.01; ****P<0.0001.
4.3 Effect of dietary nitrate and placebo on [NO2–] and [NO3–] in saliva samples from patients with angina
There was no significant difference in the baseline saliva [NO2–]concentration between the two groups (gamma: 493±142µmol/L; delta: 704±155µmol/L; P=0.32). After 6 months of treatment, saliva [NO2–] in the gamma group was significantly increased from 493±142µmol/L to 1368±268µmol/L (P<0.01), an increase of approximately 2.8-fold (Figure 21A). However, there was no significant difference measured in the [NO2–] of the delta group (704±155µmol/L vs 465±100µmol/L; P=0.78). As demonstrated in Figure 22A, the change overall in saliva [NO2–] from baseline was significantly different between the two groups (gamma: 876±291µmol/L; delta: -247±145µmol/L; P=0.001).
Similarly, there was no significant difference in the baseline saliva [NO3–]concentration between the two groups (gamma: 644±134µmol/L; delta: 1433±439µmol/L; P=0.09). After 6 months, saliva [NO3–] in the gamma group was significantly increased from 644±134µmol/L to 3059±644µmol/L (P<0.01), an increase of approximately 4.8-fold (Figure 21B). However, there was no significant difference measured in the [NO3–] of the delta group (1433±439µmol/L vs 957±252µmol/L; P=0.11). As demonstrated in Figure 22B, the change overall in saliva [NO2–] from baseline was significantly different between the two groups (gamma: 2415±665µmol/L; delta: -514±295µmol/L; P=0.0002).
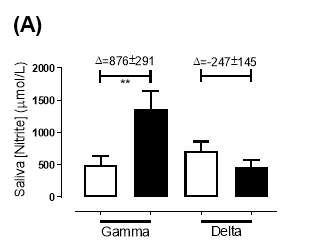
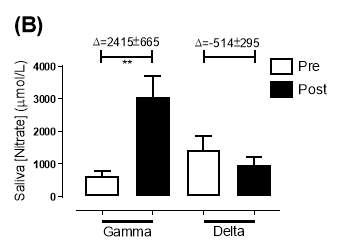
Figure 21: Saliva (A) [NO2–] and (B) [NO3–] of the gamma and delta group, at baseline and after 6 months of treatment. The treatment was with either dietary nitrate (nitrate-rich juice 70 mL daily) or placebo (nitrate-depleted juice 70 mL daily), in patients with stable angina. Data expressed as mean ± SEM. n=25 in the gamma group; n=25 in the delta group. Statistical analysis was performed using paired t-test. **P<0.01. Pre indicates baseline measurement preintervention; post indicates postintervention measurement at 6 months.
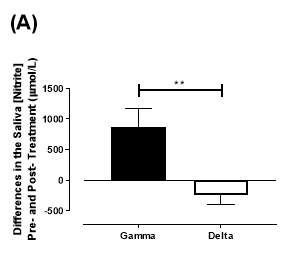
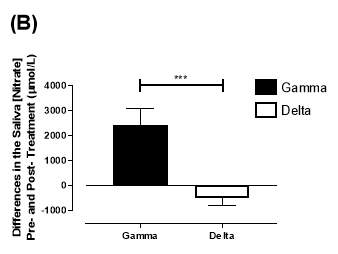
Figure 22: Change in saliva (A) [NO2–] and (B) [NO3–] from baseline of the gamma and delta group. Data expressed as mean ± SEM. n=25 in the gamma group; n=25 in the delta group. Statistical analysis performed was unpaired t-test. **P=0.001; ***P=0.0002.
4.4 Effect of dietary nitrate and placebo on [NO2–] and [NO3–] in urine samples from patients with angina
There was no significant difference in the baseline urine [NO2–]concentration between the two groups (gamma: 0.31±0.06µmol/L; delta: 0.30±0.05µmol/L; P=0.32). After 6 months of treatment, urine [NO2–] in the gamma group was significantly increased from 0.31±0.06µmol/L to 0.90±0.20µmol/L (P=0.01), an increase of approximately 3-fold (Figure 23A). However, there was no significant difference measured in the [NO2–] of the delta group (0.30±0.05µmol/L vs 0.36±0.05µmol/L; P=0.07). As demonstrated in Figure 24A, the change overall in urine [NO2–] from baseline was significantly different between the two groups (gamma: 0.58±0.19µmol/L; delta:0.07±0.05µmol/L; P=0.01).
Similarly, there was no significant difference in the baseline urine [NO3–]concentration between the two groups (gamma: 1097±189µmol/L; delta: 1049±168µmol/L; P=0.85). After 6 months, urine [NO3–] in the gamma group was significantly increased from 1097±189µmol/L to 4019±830µmol/L (P=0.002), an increase of approximately 3.7-fold (Figure 23B). However, there was no significant difference measured in the [NO3–] of the delta group (1049±168µmol/L vs 1236±208µmol/L; P=0.51). As demonstrated in Figure 24B, the change overall in urine [NO2–] from baseline was significantly different between the two groups (gamma: 2806±788µmol/L; delta: 264±216µmol/L; P=0.002).
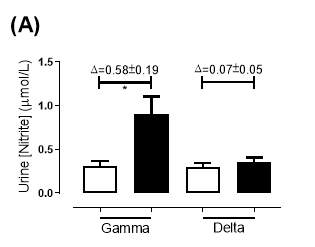
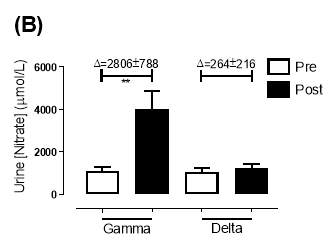
Figure 23: Urine (A) [NO2–] and (B) [NO3–] of the gamma and delta group, at baseline and after 6 months of treatment. The treatment was with either dietary nitrate (nitrate-rich juice 70 mL daily) or placebo (nitrate-depleted juice 70 mL daily), in patients with stable angina. Data expressed as mean ± SEM. n=25 in the gamma group; n=25 in the delta group. Statistical analysis was performed using paired t-test. *P=0.01, **P=0.002. Pre indicates baseline measurement preintervention; post indicates postintervention measurement at 6 months.
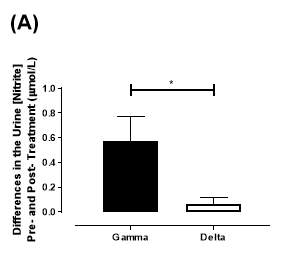
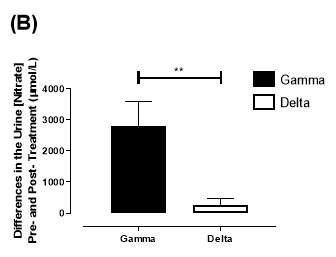
Figure 24: Change in urine (A) [NO2–] and (B) [NO3–] from baseline of the gamma and placebo group. Data expressed as mean ± SEM. n=25 in the gamma group; n=25 in the delta group. Statistical analysis performed was unpaired t-test. *P=0.01; **P=0.002.
5| DISCUSSION
It has been proven that dietary nitrates have positive effects on the vascular function; including reduction of blood pressure, leukocyte aggregation and platelet reactivity as well as improvement of endothelial dysfunction and exercise performance (Kapil et al., 2015; Velmurugan et al., 2016). Given the importance of NO in vascular function, there are comprehensive theoretical hypothesis why enhancing NO bioavailability might prove to be an effective strategy in improving vascular function, platelet reactivity and restenosis in patients with stable angina after PCI.
5.1 Effect of dietary nitrate and placebo on the enterosalivary circuit in patients with stable angina
As the NITRATE-OCT study is still ongoing, the treatment given to each group remains blinded, which helps avoid bias in analysis. The groups have been labelled gamma and delta. However, based on the results in Figures 17, 19, 21, 23, it is clear that there is a significant increase in the concentrations of cGMP, nitrite and nitrate after 6months of treatment in the gamma group. There was no significant increase in those measures in the delta group. Therefore, it would be reasonable to conclude that the patients in the gamma group received daily dietary nitrate treatment whilst the patients in the delta group received placebo. The rest of the findings from the results will be based on this assumption.
After the discovery of the nitrate-nitrite-NO pathway, which relies on an intact enterosalivary circuit highlighted novel strategies of disease prevention through the supplementation of dietary nitrate. Results from this project have shown that once daily ingestion of 70ml of nitrate rich beet-root juice does infact increase the conversion of nitrate to NO in patients with stable angina. This highlights that the enterosalivary circuit remains intact in these patients. Thus, could be targeted to help enhance endothelial function.
Providing 4-5mmol daily of dietary nitrate for 6 months increased plasma concentrations by 7.3-fold, (Figure 19B). This was a similar peak fold increase compare to previous studies (Velmurugan et al., 2016). The increase from baseline nitrite plasma concentration after 6 months was of approximately 2-folds (Figure 19A). Nitrite concentrations seem to increase at a lower fold compared to nitrate, highlighting the fact that this step relies on the bioconversion of nitrate to nitrite by oral bacteria (Kapil et al., 2013). Inorganic nitrates from the diet is extracted from the blood after absorption by the salivary glands and enters the saliva. Nitrate is reduced into nitrite by the commensal bacteria and is secrete into saliva. The levels of nitrate and nitrite in the saliva of patients with stable angina increased by 4.8-fold and 2.8-fold respectively (Figure 21). This finding was in line with the results seen in healthy volunteers who were administered once daily doses of nitrate supplementation (Velmurugan et al., 2013). This further confirms the fact the enterosalivary circuit is intact in patients with stable angina and remains functional over the 6 months of once daily nitrate-treatment. In addition, the ratio nitrite to nitrate in the saliva sample of healthy volunteers is 0.3 (Hyde et al., 2014).
In this project, the nitrite:nitrate after 6 months was 0.45. This perhaps suggests that there is a progressive augmentation in the reduction of nitrate with the increased uptake of inorganic nitrate for a long duration. The majority of the nitrate molecules that accumulate in the circulation is excreted by the urine and can be quantified. In this study, the nitrate group had an increase, in urine nitrate and nitrite concentrations, compared to baseline of approximately 3.7-fold and 3-fold. These ratios are also similar to previous studies on healthy volunteers (Bahra et al., 2012).
Inorganic nitrate has been considered as a prodrug for the production of nitrite. Additionally, there are advantages to the use of nitrate over nitrite for treatment. For instance, nitrate has a longer half-life in plasma of about 6h, whereas the half-life of nitrite is 20-40min (Hunault et al., 2009). Plasma nitrate concentration in plasma rapidly peaks around 3 hours after ingestion. However, nitrite levels increase slowly reaching a peak after 6 hours and this level remains raised at 24h. Thus, this proposed dietary approach can prove to be a cost-effective strategy in the reducing the rates of adverse effects in patients with stable angina and can also improve treatment compliance of patients, although additional investigation is warranted.
When comparing the concentrations of nitrite and nitrate particularly in plasma, between the patients with stable angina and healthy volunteers, interesting findings were seen. The mean baseline plasma nitrite concentrations for the nitrate group was 1.24µmol/L, which is about 4 times higher than the baseline levels measured in healthy volunteers (Bahra et al., 2012). As the plasma levels of nitrite is a reliable indicator NO production, this raised level suggests that in the patients with angina the NO levels were elevated even before the treatment with dietary nitrate (Lauer et al., 2001). This result is consistent with the theory that perhaps endothelial dysfunction in patients with angina arises due to an enhanced inflammatory response that has led to oxidative stress. This can cause a widespread expression of iNOS in multiple tissues, which is not normally expressed in blood vessels but can be rapidly induced in response to inflammation and cytokine production. Hence, this increases the bioavailability of NO, as reflected by the high nitrite baseline levels. A related point to consider is that, the NO produced by iNOS is not region specific, hence the increased and widespread production of NO reacts with superoxide and produces higher levels of peroxynitrite. This contributes to further deterioration of the endothelial dysfunction despite the paradoxical high levels of nitrite that would be expected after treatment (Shah, 2000).
Another aspect of this is the possible involvement of xanthine oxidoreductase (XOR) which is a source of reactive oxygen species (ROS) but also has nitrite reductase activity. The activity of XOR becomes upregulated in conditions like CHD where is increased oxidative stress and reduced activity of eNOS. As shown in previous studies, XOR expression and activity is increased following dietary nitrate supplementation; thus increases the production of nitrite and NO with a concurrent reduction in ROS generation. XOR works by either generating NO directly from the reduction of nitrite or by catalysing the reaction at the molybdenum site where nitrite accepts electrons. Hence, less electrons are donated to oxygen so less ROS is produced that can scavenge NO, leading to an increased bioavailability of NO (Peleli et al., 2016). This could also be an explanation for the increased nitrite levels observed. This also highlighted the fact that NO produced by XOR after nitrate supplementation would be generated specifically to the area of ischaemia and endothelial dysfunction to help improve vascular haemostasis, as opposed to the NO generated by iNOS that is widespread.
Finally, the plasma concentrations of cGMP increased by 41.8% after nitrate treatment, which reflects an increase in the NO bioavailability (Figure 17). The elevation in cGMP levels occurs around 3-24 hours after nitrate ingestion. The mean cGMP at baseline of the gamma and delta group was 27.3nmol/L and 29.4nmol/L respectively. This was higher than the values recorded in previous studies, but was consistent with the higher plasma nitrite measured in this study (Velmurugan et al., 2016). This could be due to the fact the in the management of angina, organic nitrates such as isosorbide mononitrate and nitroglycerin are commonly used. These drugs are NO donors, which result in a stimulated production of cGMP that cause vasodilation, thus relieving symptoms of chest pain (Cohn and Rittinghausen, 1985).
5.2 Limitations
This study was powered for a sample size of 246 but because of time constraints and patient recruitment is still ongoing, the results of only 50 participants were included in this project. Therefore, the results of this project need to be considered with caution and to avoid Type 2 error, more samples need to be analyzed. Also, as the study remains blinded, the bases of the discussion was on the assumption that the gamma group is the nitrate treated group which will only be confirmed at the end of the trial.
5.3 Future Work
Even though a significant difference has been shown between the two groups, it is important to complete the measurements of [cGMP], [NO2–] and [NO3–] to ensure accurate interpretation of the trends. As the nitrite:nitrate ratio found in this study was higher than previous studies it would be interesting to analyse the oral microbiota from saliva samples. In addition, analyse the results of flow-mediated dilation to assess whether there is an actual improvement in endothelial function after nitrate-treatment. It will also be interesting to analyse inflammatory markers, such as C reactive protein and interleukin-6, and XOR activity using specific assays (ELISA), to confirm or contradict the hypothesis of the benefits of nitrate treatment. Lastly, an assessment of reductions in platelet aggregation by measuring P-selectin levels and in-stent late loss by angiography and OCT are warranted.
6| CONCLUSION
This study demonstrated that the entersalivary circuit remains intact throughout the 6 months of treatment, in patients with stable angina. There is a clear increase in the concentrations of nitrite, nitrate and cGMP in the group postulated to be treated with nitrate. The increase in cGMP levels after treatment in the gamma group reflected increased NO bioavailability. Moreover, the raised levels of baseline plasma cGMP and nitrite has been attributed to the use of isosorbide mononitrate and upregulation of iNOS and XOR activity. Further work needs to complete to categorically explain the mechanisms involved with dietary nitrate treatment. Thus, this will provide further evidence of the benefits of inorganic nitrate and specifically with the aim of improving endothelial function and reducing rates of restenosis in patients with stable angina. The use of dietary nitrate might be a promising strategy for the secondary prevention of complications in patients with stable angina and undergoing PCI.
7| REFERENCES
Ahluwalia, A., Foster, P., Scotland, R., McLean, P., Mathur, A., Perretti, M., Moncada, S. and Hobbs, A. (2004). Antiinflammatory activity of soluble guanylate cyclase: cGMP-dependent down-regulation of P-selectin expression and leukocyte recruitment. Proceedings of the National Academy of Sciences, 101(5), pp.1386-1391.
Aird, W. (2007). Phenotypic Heterogeneity of the Endothelium: I. Structure, Function, and Mechanisms. Circulation Research, 100(2), pp.158-173.
Altmann, D., Racz, M., Battleman, D., Bergman, G., Spokojny, A., Hannan, E. and Sanborn, T. (1996). Reduction in angioplasty complications after the introduction of coronary stents: Results from a consecutive series of 2242 patients. American Heart Journal, 132(3), pp.503-507.
Arnold, W., Mittal, C., Katsuki, S. and Murad, F. (1977). Nitric oxide activates guanylate cyclase and increases guanosine 3′:5′-cyclic monophosphate levels in various tissue preparations. Proceedings of the National Academy of Sciences, 74(8), pp.3203-3207.
Bahra, M., Kapil, V., Pearl, V., Ghosh, S. and Ahluwalia, A. (2012). Inorganic nitrate ingestion improves vascular compliance but does not alter flow-mediated dilatation in healthy volunteers. Nitric Oxide, 26(4), pp.197-202.
Benjamin, N., O’Driscoll, F., Dougall, H., Duncan, C., Smith, L., Golden, M. and McKenzie, H. (1994). Stomach NO synthesis. Nature, 368(6471), pp.502-502.
Bhatnagar, P., Wickramasinghe, K., Williams, J., Rayner, M. and Townsend, N. (2015). The epidemiology of cardiovascular disease in the UK 2014. Heart, 101(15), pp.1182-1189.
Bonello, L., Sabatier, F., Camoin-Jau, L., Paganelli, F. and Dignat-George, F. (2011). Platelets and endothelium: Two key players in percutaneous coronary intervention. Archives of Cardiovascular Diseases, 104(12), pp.601-603.
Bonetti, P., Lerman, L. and Lerman, A. (2002). Endothelial Dysfunction: A Marker of Atherosclerotic Risk. Arteriosclerosis, Thrombosis, and Vascular Biology, 23(2), pp.168-175.
Bredt, D. and Snyder, S. (1990). Isolation of nitric oxide synthetase, a calmodulin-requiring enzyme. Proceedings of the National Academy of Sciences, 87(2), pp.682-685.
Clancy, R., Leszczynska-Piziak, J. and Abramson, S. (1992). Nitric oxide, an endothelial cell relaxation factor, inhibits neutrophil superoxide anion production via a direct action on the NADPH oxidase. Journal of Clinical Investigation, 90(3), pp.1116-1121.
Clark, M., Bakhai, A., Pelletier, E. and Cohen, D. (2005). Clinical and Economic Effects of Coronary Restenosis After Percutaneous Coronary Intervention in a Managed Care Population. Managed Care, 14(4), pp.42-51.
Cohn, J. and Rittinghausen, R. (1985). Mononitrates. 1st ed. Berlin [u.a.]: Springer, p.55.
Cosby, K., Partovi, K., Crawford, J., Patel, R., Reiter, C., Martyr, S., Yang, B., Waclawiw, M., Zalos, G., Xu, X., Huang, K., Shields, H., Kim-Shapiro, D., Schechter, A., Cannon, R. and Gladwin, M. (2003). Nitrite reduction to nitric oxide by deoxyhemoglobin vasodilates the human circulation. Nature Medicine, 9(12), pp.1498-1505.
Davignon, J. and Ganz, P. (2004). Role of Endothelial Dysfunction in Atherosclerosis. Circulation, 109(suppl III), pp.III-27-III-32.
De Caterina, R., Libby, P., Peng, H., Thannickal, V., Rajavashisth, T., Gimbrone, M., Shin, W. and Liao, J. (1995). Nitric oxide decreases cytokine-induced endothelial activation. Nitric oxide selectively reduces endothelial expression of adhesion molecules and proinflammatory cytokines. Journal of Clinical Investigation, 96(1), pp.60-68.
Denninger, J. and Marletta, M. (1999). Guanylate cyclase and the NO/cGMP signaling pathway. Biochimica et Biophysica Acta, 1411(2-3), pp.334-350.
Duranski, M., Greer, J., Dejam, A., Jaganmohan, S., Hogg, N., Langston, W., Patel, R., Yet, S., Wang, X., Kevil, C., Gladwin, M. and Lefer, D. (2005). Cytoprotective effects of nitrite during in vivo ischemia-reperfusion of the heart and liver. Journal of Clinical Investigation, 115(5), pp.1232-1240.
Epstein, F. and Ross, R. (1999). Atherosclerosis — An Inflammatory Disease. New England Journal of Medicine, 340(2), pp.115-126.
Fazio, L. (2004). Erectile dysfunction: management update. Canadian Medical Association Journal, 170(9), pp.1429-1437.
Florey, L. (1966). The endothelial cell. BMJ, 2(5512), pp.487-490.
Forstermann, U., Closs, E., Pollock, J., Nakane, M., Schwarz, P., Gath, I. and Kleinert, H. (1994). Nitric oxide synthase isozymes. Characterization, purification, molecular cloning, and functions. Hypertension, 23(6), pp.1121-1131.
Furchgott, R. and Vanhoutte, P. (1989). Endothelium-derived relaxing and contracting factors. European Journal of Pharmacology, 3(9), pp.2007-2018.
Furchgott, R. and Zawadzki, J. (1980). The obligatory role of endothelial cells in the relaxation of arterial smooth muscle by acetylcholine. Nature, 288(5789), pp.373-376.
Furchgott, R.F. (1988). Studies on relaxation of rabbit aorta by sodium nitrite: the basis for the proposal that the acid-activatable inhibitory factor from retractor penis is inorganic nitrite and the endothelium-derived relaxing factor in nitric oxide. In: Vasodilatation: Vascular Smooth Muscle, Peptides, Autonomic Nerves and Endothelium, ed. Vanhoutte, P.M., pp.401– 14. New York: Raven.
Ganz, P. and Vita, J. (2003). Testing Endothelial Vasomotor Function: Nitric Oxide, a Multipotent Molecule. Circulation, 108(17), pp.2049-2053.
Garcia-Cardena, G., Martasek, P., Masters, B., Skidd, P., Couet, J., Li, S., Lisanti, M. and Sessa, W. (1997). Dissecting the Interaction between Nitric Oxide Synthase (NOS) and Caveolin: FUNCTIONAL SIGNIFICANCE OF THE NOS CAVEOLIN BINDING DOMAININ VIVO. Journal of Biological Chemistry, 272(41), pp.25437-25440.
Gladwin, M., Schechter, A., Kim-Shapiro, D., Patel, R., Hogg, N., Shiva, S., Cannon, R., Kelm, M., Wink, D., Espey, M., Oldfield, E., Pluta, R., Freeman, B., Lancaster, J., Feelisch, M. and Lundberg, J. (2005). The emerging biology of the nitrite anion. Nature Chemical Biology, 1(6), pp.308-314.
Hadi, H., Carr, C. and Al Suwaidi, J. (2005). Endothelial dysfunction: cardiovascular risk factors, therapy, and outcome. Vascular Health and Risk Management, 1(3), pp.183-198.
Hogg, N., Kalyanaraman, B., Joseph, J., Struck, A. and Parthasarathy, S. (1993). Inhibition of low-density lipoprotein oxidation by nitric oxide Potential role in atherogenesis. FEBS Letters, 334(2), pp.170-174.
Hunault, C., van Velzen, A., Sips, A., Schothorst, R. and Meulenbelt, J. (2009). Bioavailability of sodium nitrite from an aqueous solution in healthy adults. Toxicology Letters, 190(1), pp.48-53.
Hyde, E., Andrade, F., Vaksman, Z., Parthasarathy, K., Jiang, H., Parthasarathy, D., Torregrossa, A., Tribble, G., Kaplan, H., Petrosino, J. and Bryan, N. (2014). Metagenomic Analysis of Nitrate-Reducing Bacteria in the Oral Cavity: Implications for Nitric Oxide Homeostasis. PLoS ONE, 9(3), p.e88645.
Ignarro, L., Buga, G., Wood, K., Byrns, R. and Chaudhuri, G. (1987). Endothelium-derived relaxing factor produced and released from artery and vein is nitric oxide. Proceedings of the National Academy of Sciences, 84(24), pp.9265-9269.
Ignarro, L.J., Byrns, R.E. & Wood, K.S. (1988). Biochemical and pharmacological properties of endothelium-derived relaxing factor and its similarity to nitric oxide redical. In Vasodilatation: Vascular Smooth Muscle, Peptides, Autonomic Nerves and Endothelium, ed. Vanhoutte, P.M., pp.401–14. New York: Raven.
Kapil, V., Haydar, S., Pearl, V., Lundberg, J., Weitzberg, E. and Ahluwalia, A. (2013). Physiological role for nitrate-reducing oral bacteria in blood pressure control. Free Radical Biology and Medicine, 55, pp.93-100.
Kapil, V., Khambata, R., Robertson, A., Caulfield, M. and Ahluwalia, A. (2015). Dietary Nitrate Provides Sustained Blood Pressure Lowering in Hypertensive Patients: A Randomized, Phase 2, Double-Blind, Placebo-Controlled Study. Hypertension, 65(2), pp.320-327.
Kapil, V., Webb, A. and Ahluwalia, A. (2010). Inorganic nitrate and the cardiovascular system. Heart, 96(21), pp.1703-1709.
Kinlay, S. and Ganz, P. (1997). Role of Endothelial Dysfunction in Coronary Artery Disease and Implications for Therapy. The American Journal of Cardiology, 80(9), pp.11I-16I.
Knowles, R. and Moncada, S. (1992). Nitric oxide as a signal in blood vessels. Trends in Biochemical Sciences, 17(10), pp.399-402.
Kubes, P., Suzuki, M. and Granger, D. (1991). Nitric oxide: an endogenous modulator of leukocyte adhesion. Proceedings of the National Academy of Sciences, 88(11), pp.4651-4655.
Lauer, T., Preik, M., Rassaf, T., Strauer, B., Deussen, A., Feelisch, M. and Kelm, M. (2001). Plasma nitrite rather than nitrate reflects regional endothelial nitric oxide synthase activity but lacks intrinsic vasodilator action. Proceedings of the National Academy of Sciences, 98(22), pp.12814-12819.
Lerman, A. and Burnett, J. (1992). Intact and altered endothelium in regulation of vasomotion. Circulation, 86(6 Suppl), pp.III12-III19.
Lerman, A. and Zeiher, A. (2005). Endothelial Function: Cardiac Events. Circulation, 111(3), pp.363-368.
Lip, G., Blann, A., Zarifis, J., Beevers, M., Lip, P. and Beevers, D. (1995). Soluble adhesion molecule P-selectin and endothelial dysfunction in essential hypertension. Journal of Hypertension, 13(12), pp.1674-1678.
Ludmer, P., Selwyn, A., Shook, T., Wayne, R., Mudge, G., Alexander, R. and Ganz, P. (1986). Paradoxical Vasoconstriction Induced by Acetylcholine in Atherosclerotic Coronary Arteries. New England Journal of Medicine, 315(17), pp.1046-1051.
Lundberg, J., Gladwin, M., Ahluwalia, A., Benjamin, N., Bryan, N., Butler, A., Cabrales, P., Fago, A., Feelisch, M., Ford, P., Freeman, B., Frenneaux, M., Friedman, J., Kelm, M., Kevil, C., Kim-Shapiro, D., Kozlov, A., Lancaster, J., Lefer, D., McColl, K., McCurry, K., Patel, R., Petersson, J., Rassaf, T., Reutov, V., Richter-Addo, G., Schechter, A., Shiva, S., Tsuchiya, K., van Faassen, E., Webb, A., Zuckerbraun, B., Zweier, J. and Weitzberg, E. (2009). Nitrate and nitrite in biology, nutrition and therapeutics. Nature Chemical Biology, 5(12), pp.865-869.
Mohan, S. and Dhall, A. (2010). A comparative study of restenosis rates in bare metal and drug-eluting stents. International Journal of Angiology, 19(2), pp.e66-e72.
Moncada, S. and Higgs, A. (1993). The L-Arginine-Nitric Oxide Pathway. New England Journal of Medicine, 329(27), pp.2002-2012.
Moncada, S. and Higgs, E. (1995). Molecular mechanisms and therapeutic strategies related to nitric oxide. FASEB J, 9(13), pp.1319-1330.
Munk, P., Butt, N. and Larsen, A. (2011). Endothelial dysfunction predicts clinical restenosis after percutaneous coronary intervention. Scandinavian Cardiovascular Journal, 45(3), pp.139-145.
Murad, F. (1999). Discovery of Some of the Biological Effects of Nitric Oxide and Its Role in Cell Signaling (Nobel Lecture). Angewandte Chemie International Edition, 38(13-14), pp.1856-1868.
Murrell, W. (1879). Nitro-glycerine as a remedy for angina pectoris. The Lancet, 113(2894), pp.225-227.
Palmer, R., Ashton, D. and Moncada, S. (1988). Vascular endothelial cells synthesize nitric oxide from L-arginine. Nature, 333(6174), pp.664-666.
Palmer, R., Ferrige, A. and Moncada, S. (1987). Nitric oxide release accounts for the biological activity of endothelium-derived relaxing factor. Nature, 327(6122), pp.524-526.
Pannala, A., Mani, A., Spencer, J., Skinner, V., Bruckdorfer, K., Moore, K. and Rice-Evans, C. (2003). The effect of dietary nitrate on salivary, plasma, and urinary nitrate metabolism in humans. Free Radical Biology and Medicine, 34(5), pp.576-584.
Peleli, M., Zollbrecht, C., Montenegro, M., Hezel, M., Zhong, J., Persson, E., Holmdahl, R., Weitzberg, E., Lundberg, J. and Carlström, M. (2016). Enhanced XOR activity in eNOS-deficient mice. Free Radical Biology and Medicine, 99, pp.472-484.
Peng, H., Libby, P. and Liao, J. (1995). Induction and Stabilization of I B by Nitric Oxide Mediates Inhibition of NF- B. Journal of Biological Chemistry, 270(23), pp.14214-14219.
Popma, J. (2002). A Decade of Improvement in the Clinical Outcomes of Percutaneous Coronary Intervention for Multivessel Coronary Artery Disease. Circulation, 106(13), pp.1592-1594.
Rathod, K., Jones, D., Van-Eijl, T., Tsang, H., Warren, H., Hamshere, S., Kapil, V., Jain, A., Deaner, A., Poulter, N., Caulfield, M., Mathur, A. and Ahluwalia, A. (2016). Randomised, double-blind, placebo-controlled study investigating the effects of inorganic nitrate on vascular function, platelet reactivity and restenosis in stable angina: protocol of the NITRATE-OCT study. BMJ Open, 6(12), p.e012728.
Sarkar, R., Meinberg, E., Stanley, J., Gordon, D. and Clinton Webb, R. (1996). Nitric Oxide Reversibly Inhibits the Migration of Cultured Vascular Smooth Muscle Cells. Circulation Research, 78(2), pp.225-230.
Schmidt, H., Nau, H., Wittfoht, W., Gerlach, J., Prescher, K., Klein, M., Niroomand, F. and Böhme, E. (1988). Arginine is a physiological precursor of endothelium-derived nitric oxide. European Journal of Pharmacology, 154(2), pp.213-216.
Shah, A. (2000). Inducible nitric oxide synthase and cardiovascular disease. Cardiovascular Research, 45(1), pp.148-155.
Smart, E., Shaul, P., Robinson, L., German, Z., Yuhanna, I., Ying, Y., Anderson, R. and Michel, T. (1996). Acylation Targets Endothelial Nitric-oxide Synthase to Plasmalemmal Caveolae. Journal of Biological Chemistry, 271(11), pp.6518-6522.
Southam, E. (2001). Measurement of cGMP and Soluble Guanylyl Cyclase Activity. Current Protocols in Toxicology.
Tannenbaum, S., Weisman, M. and Fett, D. (1976). The effect of nitrate intake on nitrite formation in human saliva. Food and Cosmetics Toxicology, 14(6), pp.549-552.
Teirstein, P. (2010). Drug-Eluting Stent Restenosis: An Uncommon Yet Pervasive Problem. Circulation, 122(1), pp.5-7.
Tousoulis, D. (2005). Evaluating endothelial function in humans: a guide to invasive and non-invasive techniques. Heart, 91(4), pp.553-558.
Velmurugan, S., Gan, J., Rathod, K., Khambata, R., Ghosh, S., Hartley, A., Van Eijl, S., Sagi-Kiss, V., Chowdhury, T., Curtis, M., Kuhnle, G., Wade, W. and Ahluwalia, A. (2016). Dietary nitrate improves vascular function in patients with hypercholesterolemia: a randomized, double-blind, placebo-controlled study. American Journal of Clinical Nutrition, 103(1), pp.25-38.
Velmurugan, S., Kapil, V., Ghosh, S., Davies, S., McKnight, A., Aboud, Z., Khambata, R., Webb, A., Poole, A. and Ahluwalia, A. (2013). Antiplatelet effects of dietary nitrate in healthy volunteers: Involvement of cGMP and influence of sex. Free Radical Biology and Medicine, 65, pp.1521-1532.
Webb, A., Milsom, A., Rathod, K., Chu, W., Qureshi, S., Lovell, M., Lecomte, F., Perrett, D., Raimondo, C., Khoshbin, E., Ahmed, Z., Uppal, R., Benjamin, N., Hobbs, A. and Ahluwalia, A. (2008). Mechanisms Underlying Erythrocyte and Endothelial Nitrite Reduction to Nitric Oxide in Hypoxia: Role for Xanthine Oxidoreductase and Endothelial Nitric Oxide Synthase. Circulation Research, 103(9), pp.957-964.
Webb, A., Patel, N., Loukogeorgakis, S., Okorie, M., Aboud, Z., Misra, S., Rashid, R., Miall, P., Deanfield, J., Benjamin, N., MacAllister, R., Hobbs, A. and Ahluwalia, A. (2008). Acute Blood Pressure Lowering, Vasoprotective, and Antiplatelet Properties of Dietary Nitrate via Bioconversion to Nitrite. Hypertension, 51(3), pp.784-790.
Wennmalm, A., Benthin, G. and Petersson, A. (1992). Dependence of the metabolism of nitric oxide (NO) in healthy human whole blood on the oxygenation of its red cell haemoglobin. British Journal of Pharmacology, 106(3), pp.507-508.
8| APPENDIX
Appendix 1 – cGMP results
| Sample | Reading 1 (OD) | Reading 2 (OD) | Mean (OD) | %B/Bo | Log cGMP (fmol/well) | cGMP (fmol/well) | Undiluted cGMP (fmol/ml) | cGMP (nmol/L) |
| 1 | 1.925 | 2.031 | 1.978 | 53.4 | 1.53 | 33.52 | 13408 | 13.41 |
| 2 | 1.787 | 1.798 | 1.793 | 46.3 | 1.66 | 45.32 | 18128 | 18.13 |
| 3 | 1.866 | 1.893 | 1.88 | 49.6 | 1.60 | 39.37 | 15748 | 15.75 |
| 4 | 1.871 | 1.907 | 1.889 | 50 | 1.59 | 38.7 | 15480 | 15.48 |
| 5 | 1.716 | 1.712 | 1.714 | 43.4 | 1.71 | 51.42 | 20568 | 20.57 |
| 6 | 1.579 | 1.62 | 1.6 | 39 | 1.8 | 62.67 | 25068 | 25.07 |
| 7 | 2.005 | 2.006 | 2.006 | 54.4 | 1.51 | 32.13 | 12852 | 12.85 |
| 8 | 1.765 | 1.924 | 1.845 | 48.3 | 1.62 | 41.6 | 16640 | 16.64 |
| 9 | 1.838 | 1.827 | 1.833 | 47.9 | 1.63 | 42.32 | 16928 | 16.93 |
| 10 | 1.588 | 1.581 | 1.585 | 38.4 | 1.81 | 64.43 | 25772 | 25.77 |
| 11 | 1.992 | 2.04 | 2.016 | 54.8 | 1.5 | 31.59 | 12636 | 12.64 |
| 12 | 2.091 | 2.156 | 2.124 | 58.9 | 1.42 | 26.53 | 10612 | 10.61 |
| 13 | 2.062 | 2.098 | 2.08 | 57.3 | 1.45 | 28.41 | 11364 | 11.36 |
| 14 | 2.078 | 2.139 | 2.109 | 58.3 | 1.43 | 27.23 | 10892 | 10.89 |
| 15 | 2.132 | 2.104 | 2.118 | 58.7 | 1.43 | 26.76 | 10704 | 10.70 |
| 16 | 2.182 | 2.185 | 2.184 | 61.2 | 1.38 | 24.02 | 9608 | 9.61 |
| 17 | 1.915 | 1.981 | 1.948 | 52.3 | 1.55 | 35.11 | 14044 | 14.04 |
| 18 | 2.104 | 2.012 | 2.058 | 56.4 | 1.47 | 29.52 | 11808 | 11.81 |
| 19 | 1.17 | 1.382 | 1.276 | 33.6 | 2.14 | 139.61 | 55844 | 55.84 |
| 20 | 1.112 | 1.65 | 1.381 | 36.8 | 2.07 | 116.44 | 46576 | 46.58 |
| 21 | 1.559 | 1.569 | 1.564 | 37.7 | 1.82 | 66.58 | 26632 | 26.63 |
| 22 | 1.588 | 1.552 | 1.57 | 37.9 | 1.82 | 65.96 | 26384 | 26.38 |
| 23 | 1.687 | 1.808 | 1.748 | 47.8 | 1.88 | 75.73 | 30292 | 30.29 |
| 24 | 1.649 | 1.703 | 1.676 | 45.7 | 1.92 | 83.93 | 33572 | 33.57 |
| 25 | 1.54 | 1.615 | 1.578 | 42.9 | 1.98 | 96.58 | 38632 | 38.63 |
| 26 | 1.458 | 1.526 | 1.492 | 40.4 | 2.04 | 109.95 | 43980 | 43.98 |
| 27 | 1.669 | 1.675 | 1.672 | 45.6 | 1.93 | 84.34 | 33736 | 33.74 |
| 28 | 1.689 | 1.664 | 1.677 | 45.7 | 1.92 | 83.93 | 33572 | 33.57 |
| 29 | 1.957 | 1.916 | 1.937 | 53.2 | 1.77 | 58.51 | 23404 | 23.40 |
| 30 | 2.007 | 1.98 | 1.994 | 54.9 | 1.73 | 53.99 | 21596 | 21.60 |
| 31 | 1.556 | 1.5 | 1.528 | 41.5 | 2.02 | 103.8 | 41520 | 41.52 |
| 32 | 1.532 | 1.538 | 1.535 | 41.7 | 2.01 | 102.72 | 41088 | 41.09 |
| 33 | 1.715 | 1.725 | 1.72 | 47 | 1.9 | 78.74 | 31496 | 31.50 |
| 34 | 1.833 | 1.864 | 1.849 | 50.7 | 1.82 | 65.88 | 26352 | 26.35 |
| 35 | 1.807 | 1.701 | 1.754 | 48 | 1.88 | 75 | 30000 | 30.00 |
| Sample | Reading 1 (OD) | Reading 2 (OD) | Mean (OD) | %B/Bo | Log cGMP (fmol/well) | cGMP (fmol/well) | Undiluted cGMP (fmol/ml) | cGMP (nmol/L) |
| 36 | 1.647 | 1.64 | 1.644 | 44.8 | 1.94 | 87.76 | 35104 | 35.10 |
| 37 | 1.841 | 1.789 | 1.815 | 49.7 | 1.84 | 69.1 | 27640 | 27.64 |
| 38 | 1.716 | 1.669 | 1.693 | 46.2 | 1.91 | 81.89 | 32756 | 32.76 |
| 39 | 1.778 | 1.826 | 1.802 | 49.3 | 1.85 | 70.44 | 28176 | 28.18 |
| 40 | 1.87 | 1.824 | 1.847 | 50.6 | 1.82 | 66.19 | 26476 | 26.48 |
| 41 | 1.612 | 1.565 | 1.589 | 43.2 | 1.98 | 95.12 | 38048 | 38.05 |
| 42 | 1.72 | 1.681 | 1.701 | 46.4 | 1.91 | 81.08 | 32432 | 32.43 |
| 43 | 1.735 | 1.7 | 1.718 | 46.9 | 1.9 | 79.12 | 31648 | 31.65 |
| 44 | 1.75 | 1.536 | 1.643 | 44.8 | 1.94 | 87.76 | 35104 | 35.10 |
| 45 | 1.478 | 1.427 | 1.453 | 39.3 | 2.07 | 116.6 | 46640 | 46.64 |
| 46 | 1.434 | 1.473 | 1.454 | 39.3 | 2.07 | 116.6 | 46640 | 46.64 |
| 47 | 1.833 | 1.943 | 1.888 | 51.8 | 1.8 | 62.52 | 25008 | 25.01 |
| 48 | 1.478 | 1.509 | 1.494 | 40.5 | 2.04 | 109.38 | 43752 | 43.75 |
| 49 | 1.769 | 1.738 | 1.754 | 47.9 | 1.88 | 75.36 | 30144 | 30.14 |
| 50 | 1.94 | 1.885 | 1.913 | 52.5 | 1.78 | 60.48 | 24192 | 24.19 |
| 51 | 1.233 | 1.817 | 1.525 | 41.2 | 1.96 | 91.33 | 36532 | 36.53 |
| 52 | 1.394 | 1.488 | 1.441 | 38.6 | 2.02 | 105.35 | 42140 | 42.14 |
| 53 | 1.946 | 1.976 | 1.961 | 54.3 | 1.65 | 44.97 | 17988 | 17.99 |
| 54 | 1.267 | 2.025 | 1.646 | 44.8 | 1.88 | 75.13 | 30052 | 30.05 |
| 55 | 1.45 | 1.584 | 1.517 | 40.9 | 1.97 | 92.84 | 37136 | 37.14 |
| 56 | 1.454 | 1.546 | 1.5 | 40.4 | 1.98 | 95.41 | 38164 | 38.16 |
| 57 | 1.595 | 1.614 | 1.605 | 43.6 | 1.9 | 80.16 | 32064 | 32.06 |
| 58 | 1.909 | 1.812 | 1.861 | 51.3 | 1.72 | 52.92 | 21168 | 21.17 |
| 59 | 1.661 | 1.596 | 1.629 | 44.3 | 1.89 | 77.18 | 30872 | 30.87 |
| 60 | 1.554 | 1.471 | 1.513 | 40.8 | 1.97 | 93.34 | 37336 | 37.34 |
| 61 | 1.71 | 1.659 | 1.685 | 46 | 1.85 | 70.42 | 28168 | 28.17 |
| 62 | 1.811 | 1.557 | 1.684 | 46 | 1.85 | 70.42 | 28168 | 28.17 |
| 63 | 1.691 | 1.583 | 1.637 | 44.5 | 1.88 | 76.35 | 30540 | 30.54 |
| 64 | 1.617 | 1.607 | 1.612 | 43.8 | 1.9 | 79.3 | 31720 | 31.72 |
| 65 | 1.625 | 1.563 | 1.594 | 43.2 | 1.91 | 81.92 | 32768 | 32.77 |
| 66 | 1.498 | 1.417 | 1.458 | 39.1 | 2.01 | 102.48 | 40992 | 40.99 |
| 67 | 1.663 | 1.757 | 1.71 | 46.8 | 1.83 | 67.45 | 26980 | 26.98 |
| 68 | 1.665 | 1.748 | 1.707 | 46.6 | 1.83 | 68.18 | 27272 | 27.27 |
| 69 | 1.656 | 1.725 | 1.691 | 46.2 | 1.84 | 69.67 | 27868 | 27.87 |
| 70 | 1.707 | 1.796 | 1.752 | 48 | 1.8 | 63.23 | 25292 | 25.29 |
| 71 | 1.959 | 1.974 | 1.967 | 54.5 | 1.65 | 44.48 | 17792 | 17.79 |
| 72 | 1.154 | 1.248 | 1.201 | 31.4 | 2.2 | 158.67 | 63468 | 63.47 |
| 73 | 1.884 | 1.845 | 1.865 | 51.4 | 1.72 | 52.64 | 21056 | 21.06 |
| 74 | 1.398 | 1.326 | 1.362 | 36.2 | 2.08 | 120.43 | 48172 | 48.17 |
| 75 | 2.04 | 1.986 | 2.013 | 55.9 | 1.61 | 41.19 | 16476 | 16.48 |
| Sample | Reading 1 (OD) | Reading 2 (OD) | Mean (OD) | %B/Bo | Log cGMP (fmol/well) | cGMP (fmol/well) | Undiluted cGMP (fmol/ml) | cGMP (nmol/L) |
| 76 | 1.26 | 1.387 | 1.324 | 35.1 | 2.11 | 128.15 | 51260 | 51.26 |
| 77 | 1.654 | 1.613 | 1.634 | 44.4 | 1.89 | 76.77 | 30708 | 30.71 |
| 78 | 1.378 | 1.253 | 1.316 | 34.8 | 2.12 | 130.35 | 52140 | 52.14 |
| 79 | 1.309 | 1.242 | 1.276 | 33.6 | 2.14 | 139.61 | 55844 | 55.84 |
| 80 | 1.456 | 1.311 | 1.384 | 36.9 | 2.06 | 115.79 | 46316 | 46.32 |
| 81 | 1.65 | 1.612 | 1.631 | 44.4 | 1.89 | 76.77 | 30708 | 30.71 |
| 82 | 1.749 | 1.687 | 1.718 | 47 | 1.82 | 66.73 | 26692 | 26.69 |
| 83 | 1.973 | 1.976 | 1.975 | 53.7 | 1.72 | 52.66 | 21064 | 21.06 |
| 84 | 1.784 | 1.779 | 1.782 | 48.2 | 1.82 | 66.51 | 26604 | 26.60 |
| 85 | 1.829 | 1.814 | 1.822 | 49.4 | 1.8 | 63.16 | 25264 | 25.26 |
| 86 | 1.602 | 1.649 | 1.626 | 43.8 | 1.91 | 80.86 | 32344 | 32.34 |
| 87 | 1.516 | 1.516 | 1.516 | 40.6 | 1.97 | 93.97 | 37588 | 37.59 |
| 88 | 1.595 | 1.536 | 1.566 | 42 | 1.94 | 87.9 | 35160 | 35.16 |
| 89 | 1.774 | 1.766 | 1.77 | 47.9 | 1.83 | 67.38 | 26952 | 26.95 |
| 90 | 1.181 | 1.192 | 1.187 | 31.2 | 2.2 | 157.18 | 62872 | 62.87 |
| 91 | 1.938 | 1.828 | 1.883 | 51.1 | 1.77 | 58.74 | 23496 | 23.50 |
| 92 | 1.881 | 1.543 | 1.712 | 46.2 | 1.86 | 72.59 | 29036 | 29.04 |
| 93 | 1.565 | 1.341 | 1.453 | 38.8 | 2.01 | 102.68 | 41072 | 41.07 |
| 94 | 1.782 | 1.715 | 1.749 | 47.3 | 1.84 | 69.16 | 27664 | 27.66 |
| 95 | 1.87 | 1.815 | 1.843 | 50 | 1.79 | 61.56 | 24624 | 24.62 |
| 96 | 1.775 | 1.522 | 1.649 | 44.4 | 1.9 | 78.69 | 31476 | 31.48 |
| 97 | 1.306 | 1.503 | 1.405 | 37.4 | 2.04 | 110.3 | 44120 | 44.12 |
| 98 | 1.636 | 1.603 | 1.62 | 43.6 | 1.91 | 81.61 | 32644 | 32.64 |
| 99 | 1.608 | 1.576 | 1.592 | 42.8 | 1.93 | 84.68 | 33872 | 33.87 |
| 100 | 1.737 | 1.745 | 1.741 | 47.1 | 1.84 | 69.77 | 27908 | 27.91 |
Appendix 1: Individual results obtained from the cGMP assay
Appendix 2 – Results of the control standards obtained from chemiluminescence
| Measured nitrite concentration (µmol/L) | Measured NOx concentration (µmol/L) |
| 1.01 | 10.65 |
| 0.99 | 10.14 |
| 1.1 | 9.84 |
| 0.95 | 9.32 |
| 0.93 | 10.01 |
| 1.05 | 9.95 |
| 1.1 | 9.8 |
| 1.03 | 9.99 |
| 1 | 10.03 |
| 1.04 | 10.01 |
| 1.03 | 10.06 |
| 1.03 | 10.07 |
| 0.95 | 9.54 |
| 0.99 | 10.07 |
| 0.97 | 9.83 |
| 1.01 | 9.89 |
| 1.05 | 9.8 |
| 1 | 10.07 |
| Average: 1.01µmol/L | Average: 9.95µmol/L |
| Inaccuracy: 1.28% | Inaccuracy: -0.52% |
| Standard Deviation: 0.05µmol/L | Standard Deviation: 0.27µmol/L |
| Coefficient of Variation: 4.64% | Coefficient of Variation: 2.71% |
Appendix 2: Results of the control standards measured each day chemiluminescence was run. Excepted concentrations were 1µmol/L of nitrite and 10µmol/L of NOx.
Appendix 3 – Ozone chemiluminescence results
| Sample | Plasma | Saliva | Urine | |||
| NITRATE [uM] | NITRITE [uM] | NITRATE [uM] | NITRITE [uM] | NITRATE [uM] | NITRITE [uM] | |
| 1 | 64.1 | 1 | 1222 | 503 | 3943.4 | 0.2 |
| 2 | 165.1 | 1.3 | 3725.5 | 2579 | 9461.1 | 1.9 |
| 3 | 37.4 | 0.9 | 905.5 | 136 | 1823.4 | 0.1 |
| 4 | 25.9 | 0.3 | 225 | 55.5 | 560.3 | 0.2 |
| 5 | 68.3 | 0.4 | 2193.5 | 417.5 | 1168.14 | 0.36 |
| 6 | 35.6 | 0.3 | 338 | 205 | 1225.04 | 0.46 |
| 7 | 27.2 | 0.1 | 805 | 139 | 887.425 | 0.075 |
| 8 | 305.8 | 0.6 | 295 | 175.5 | 1219.33 | 0.17 |
| 9 | 36.1 | 0.7 | 418 | 37 | 348.375 | 0.125 |
| 10 | 32.5 | 0.3 | 7496.5 | 2880 | 8245.075 | 1.425 |
| 11 | 20.1 | 0.8 | 329 | 355 | 2334.24 | 0.26 |
| 12 | 16.6 | 1.171 | 642.5 | 159.5 | 2521.245 | 0.255 |
| 13 | 22.6 | 1.22 | 841 | 296 | 1454.82 | 0.18 |
| 14 | 361 | 2.4 | 383.5 | 99.5 | 1264.85 | 0.15 |
| 15 | 21.2 | 0.91 | 660 | 153 | 1100.29 | 0.21 |
| 16 | 41 | 0.94 | 7236.5 | 1731 | 14186.86 | 2.64 |
| 17 | 16.5 | 1.07 | 2034.5 | 1248 | 634.715 | 0.285 |
| 18 | 159.9 | 1.05 | 1703 | 524.5 | 203.325 | 0.175 |
| 19 | 19.8 | 1.18 | 695 | 339.5 | 1346.865 | 0.135 |
| 20 | 20.6 | 0.76 | 10677 | 2275.5 | 2747.12 | 1.38 |
| 21 | 15.5 | 1.09 | 989 | 198.5 | 194.975 | 0.025 |
| 22 | 110.6 | 0.86 | 488.5 | 193.5 | 525.43 | 0.07 |
| 23 | 17.6 | 1.57 | 102.5 | 230 | 419.9 | 0.1 |
| 24 | 185.2 | 0.83 | 1396.5 | 1231.5 | 2974.955 | 0.545 |
| 25 | 8.7 | 3.54 | 593.5 | 302.5 | 993.36 | 0.14 |
| 26 | 19.5 | 2.34 | 10016 | 2580.5 | 2983.905 | 0.595 |
| 27 | 30.1 | 4.92 | 588 | 73.5 | 600.455 | 0.045 |
| 28 | 120.5 | 7.18 | 383.5 | 170 | 697.89 | 0.11 |
| 29 | 31.5 | 1.85 | 935.5 | 590 | 1028.615 | 0.385 |
| 30 | 42.8 | 3.37 | 1953.5 | 962.5 | 695.465 | 0.535 |
| 31 | 10.1 | 1.14 | 942.5 | 1470 | 684.725 | 0.275 |
| 32 | 22.3 | 1.31 | 2288 | 1349 | 538.74 | 0.26 |
| 33 | 29.9 | 1.27 | 286.5 | 175.5 | 972.43 | 0.07 |
| 34 | 66.6 | 2.99 | 188.5 | 97 | 1067.045 | 0.455 |
| 35 | 22.3 | 1.3 | 670.5 | 291 | 401.405 | 0.095 |
| 36 | 17.9 | 3.89 | 341.5 | 71.5 | 883.835 | 0.165 |
| 37 | 30.1 | 2.99 | 217.5 | 29.5 | 720.875 | 0.125 |
| 38 | 72.6 | 1.85 | 761 | 151.5 | 736.9 | 0.1 |
| 39 | 70.7 | 0.64 | 458 | 221 | 526.445 | 0.055 |
| 40 | 130.7 | 2.1 | 343.5 | 106 | 354.32 | 0.18 |
| 41 | 38.8 | 2.48 | 3272.5 | 3578 | 120.64 | 0.36 |
| Sample | Plasma | Saliva | Urine | |||
| NITRATE [uM] | NITRITE [uM] | NITRATE [uM] | NITRITE [uM] | NITRATE [uM] | NITRITE [uM] | |
| 43 | 38 | 0.65 | 249 | 521 | 494.9 | 0.1 |
| 44 | 683.7 | 1.14 | 6841.5 | 2933 | 2381.965 | 5.035 |
| 45 | 20.4 | 0.79 | 975 | 876 | 218.305 | 0.195 |
| 46 | 64.9 | 0.88 | 2000 | 1859.5 | 438.8 | 0.2 |
| 47 | 37.4 | 0.96 | 209 | 131 | 523.455 | 0.045 |
| 48 | 99.8 | 1.54 | 209.5 | 143.5 | 797.92 | 0.58 |
| 49 | 33.6 | 0.91 | 1171.5 | 266.5 | 996.755 | 0.245 |
| 50 | 352.4 | 0.97 | 5753 | 527 | 2229.475 | 0.525 |
| 51 | 28.2 | 1.04 | 491 | 165.5 | 362.32 | 0.18 |
| 52 | 80.2 | 6.03 | 177.5 | 202 | 608.735 | 0.265 |
| 53 | 21.1 | 2.14 | 1450.5 | 778 | 1003.91 | 0.09 |
| 54 | 21.7 | 2.63 | 1143.5 | 658 | 286.92 | 0.08 |
| 55 | 23.7 | 2.28 | 68.5 | 1249.5 | 672.855 | 0.145 |
| 56 | 38.7 | 3.87 | 592.5 | 750.5 | 578.245 | 0.255 |
| 57 | 14.3 | 1.32 | 421.5 | 277 | 1913.845 | 0.155 |
| 58 | 26.5 | 3.34 | 459 | 196.5 | 826.755 | 0.245 |
| 59 | 42.7 | 0.82 | 356 | 312 | 3212.63 | 0.37 |
| 60 | 42.6 | 3.69 | 289 | 92 | 1839.845 | 0.155 |
| 61 | 20 | 8.85 | 1409.5 | 1341 | 491.93 | 0.07 |
| 62 | 25.8 | 0.96 | 594.5 | 533.5 | 2641.445 | 0.555 |
| 63 | 23.2 | 3.06 | 392.5 | 225 | 2410.96 | 0.54 |
| 64 | 232.6 | 5.27 | 1240.5 | 962.5 | 13350.63 | 0.365 |
| 65 | 63.7 | 6.58 | 6878.5 | 118 | 3692.52 | 0.48 |
| 66 | 52.2 | 3.85 | 1285.5 | 95.5 | 1516.87 | 0.13 |
| 67 | 203.3 | 2.99 | 9671.5 | 8143 | N/A | N/A |
| 68 | 105 | 4.5 | 6052.5 | 3648.5 | 2697.455 | 1.045 |
| 69 | 39.4 | 0.63 | 302.5 | 100.5 | 1445.715 | 0.285 |
| 70 | 62.7 | 2.28 | 368 | 93 | N/A | N/A |
| 71 | 19.5 | 0.56 | 776 | 1474.5 | 1371.205 | 0.295 |
| 72 | 301.2 | 1.07 | 796 | 5596.5 | 864.835 | 0.165 |
| 73 | 40.4 | 1.13 | 394.5 | 197.5 | 1208.9 | 266.1 |
| 74 | 27.5 | 6.41 | 2333 | 2195 | 3221.93 | 0.57 |
| 75 | 12.1 | 0.79 | 381.5 | 444 | 572.39 | 0.11 |
| 76 | 77.2 | 4.21 | 592 | 211.5 | 4209.105 | 0.395 |
| 77 | 18.8 | 1.84 | 2416.5 | 618.5 | 1586.8 | 0.2 |
| 78 | 38.7 | 0.93 | 941 | 203 | 1399.775 | 0.225 |
| 79 | 38.5 | 1.59 | 194.5 | 252 | 175.78 | 0.22 |
| 80 | 19.7 | 1.04 | 164 | 255.5 | 432.87 | 0.63 |
| 81 | 15.4 | 1.2 | 105 | 410.5 | N/A | N/A |
| 82 | 64.9 | 0.54 | 5078 | 2628 | 941.415 | 1.085 |
| 83 | 13.9 | 1.84 | 173 | 448.5 | 1490.3 | 0.2 |
| 84 | 230.6 | 0.58 | 4115.5 | 476.5 | 3827.55 | 0.45 |
| Sample | Plasma | Saliva | Urine | |||
| NITRATE [uM] | NITRITE [uM] | NITRATE [uM] | NITRITE [uM] | NITRATE [uM] | NITRITE [uM] | |
| 85 | 10.5 | 1.98 | 532.5 | 2782 | 635.275 | 0.225 |
| 86 | 44.8 | 0.84 | N/A | N/A | 1606.7 | 0.3 |
| 87 | 12.7 | 1.08 | 135.5 | 112.5 | 185.44 | 0.56 |
| 88 | 74.7 | 1.61 | 233 | 215 | 1337.945 | 1.055 |
| 89 | 8.4 | 0.8 | 676 | 704 | 843.24 | 0.26 |
| 90 | 37.1 | 0.39 | 556 | 465 | 3290.505 | 0.495 |
| 91 | 16.9 | 1.73 | 121.5 | 265.5 | 1354.885 | 0.615 |
| 92 | 5.3 | 1.48 | 1984 | 1339 | 917.615 | 0.385 |
| 93 | 24.1 | 1.07 | 1465.5 | 883 | 503.235 | 0.265 |
| 94 | 169.2 | 15.07 | 218 | 1364 | 1014.63 | 0.87 |
| 95 | 2.2 | 1.13 | 1009.5 | 687.5 | 2093.68 | 0.32 |
| 96 | 192.3 | 0.47 | 330.5 | 39.5 | 4884.435 | 0.565 |
| 97 | 4.8 | 0.59 | 108 | 151 | 299.27 | 0.23 |
| 98 | 165.8 | 0.36 | 1623 | 1366.5 | 6861.6 | 0.4 |
| 99 | 5.3 | 0.18 | 210.5 | 436.5 | 825 | 0.5 |
| 100 | 437.8 | 0.34 | 1441.5 | 1035 | 414.23 | 0.27 |
Appendix 3: Individual results obtained from the ozone chemiluminescence.
Cite This Work
To export a reference to this article please select a referencing stye below:
Related Services
View all


Related Content
All TagsContent relating to: "Nutrition"
Related Articles
DMCA / Removal Request
If you are the original writer of this dissertation and no longer wish to have your work published on the UKDiss.com website then please: