The Effects of 3-ABA on Human THP-1 Cells Treated with Etoposide
Info: 7655 words (31 pages) Dissertation
Published: 25th Feb 2022
Tagged: Biomedical Science
1. ABSTRACT
AML represents the most frequent malignant myeloid disorder in adults and the continuous increase in its incidence rate within the UK makes it even more important to find a cure for this disease. Seeing as AML is a disorder caused by the uncontrolled proliferation of haematopoietic cells, the principal focus of research is expressed by finding a way to slow off, or even completely stop this growth. Therefore, the effects of Topo II and PARP inhibitors are being tested on leukemic cell lines, seeing as they have the ability to disrupt the repair systems within DNA and promote DNA supercoiling. This study will test the effects of 3-ABA and Etoposide onto the human monocytic THP-1 cell line, both individually and in combination. The hypothesis of this project is that the drugs are more effective when applied together, rather than individually.
TABLE OF CONTENTS
Click to expand Table of Contents
2. INTRODUCTION
2.1 ACUTE MYELOID LEUKAEMIA (AML)
2.1.1 AML STATISTICS
2.1.2 AML THERAPIES
2.2 ROLE OF POLY(ADP-RIBOSYL)ATION IN DNA DAMAGE AND APOPTOSIS
2.2.1 PARYLATION IN DNA DAMAGE AND APOPTOSIS
2.2.2 DNA DAMAGE AND APOPTOTSIS: GENERAL ASPECTS
2.2.3 POLY(ADP-RIBOSE) POLYMERASES (PARPS)
2.2.4 THE PARYLATION REACTION
2.2.5 PARYLATION INHIBITORS AND THEIR USE IN CANCER THERAPY
2.2.6 ROLE OF TOPOISOMERASE II IN NUCLEAR PROCESSES
2.2.7 TOPOISOMERASE II INHIBITORS AND THEIR USE IN CANCER THERAPY
2.3 THP-1 CELLS AS A CELLULAR MODEL FOR AML
2.4 AIMS AND OBJECTIVES OF THE PROJECT
3. MATERIALS AND METHODS
3.1 PASSAGING CELLS IN SUSPENSION
3.2 CELL COUNTING
3.3 TRYPAN BLUE DYE STAINING
3.4 THE TOPOISOMERASE II DRUG ADDITION
3.5 THE PARP INHIBITOR ADDITION
3.6 COMBINATORIAL DRUG EXPERIMENTS
3.7 GROWTH CURVE AND DOUBLING TIME CALCULATIONS
3.8 STATISTICAL ANALYSIS
4. RESULTS
4.1 OPTIMISATION OF THE SEEDING DENSITIES OF THP-1 CELLS
4.2 TESTING THE TOXICITY OF DMSO
4.3 OPTIMISATION OF ETOPOSIDE CONCENTRATION
4.4 OPTIMISATION OF 3-ABA CONCENTRATION
4.5 THE COMBINED EFFECTS OF ETOPOSIDE AND 3-ABA
5. DISCUSSION
6. REFERENCES
ABBREVIATIONS
3-ABA – 3-Aminobenzamide
ADP – Adenosine Diphosphate
ADPr – Adenosine Diphosphate Ribose
AML – Acute Myeloid Leukemia
ATP – Adenosine Triphosphate
CD – Catalytic Domain
DDR – DNA Damage Response
DMSO – Dimethyl Sulfoxide
DSBR – Double Strand Breaks
IFN-γ – Interferon γ (Gamma)
MHC – Major Histocompatibility Complex
NAD+ – Nicotinamide Adenine Dinucleotide
NAM – Nicotinamide
PAR – Poly (ADP-ribose)
PARP – Poly (ADP-ribose) polymerase
Topo – Topoisomerase
2. INTRODUCTION
2.1 Acute myeloid leukaemia
AML represents the most frequent malignant myeloid disorder in adults and it is a heterogeneous clonal disorder of hematopoietic progenitor cells (Estey and Döhner, 2006). It is defined by an increase in the number of myeloid cells in the bone marrow and an arrest in their maturation, generally resulting in hematopoietic insufficiency (granulocytopenia, thrombocytopenia, or anaemia), with or without leucocytosis (Lowenberg, Downing and Burnett, 1999).
2.1.1 AML statistics
Due to it being an acute disease, it means that the leukaemia can develop rather fast. Granulocytes are being produced too quickly by the bone marrow; hence they grow and divide at a way faster rate than they normally would (Cancerresearchuk.org, 2018). The cancerous cells build up in the blood and bone marrow and they can eventually spread to other parts of the body, such as the spleen or lymph nodes (Cancerresearchuk.org, 2018).
In the UK there are around 3100 new cases of AML every year, which means about 8 new cases every day. 1 in 200 men and 1 in 255 women will be diagnosed with AML during their lifetime, and the incidence rates for AML in the UK are highest in people aged 85 to 89 (Cancer Research UK, 2018). As for mortality, AML counts for 2% of all cancer deaths in the UK, with around 2500 deaths in the UK in 2014, meaning around 7 deaths each day (Cancer Research UK, 2018).
2.1.2 AML therapies
Most cases of AML are treated with two chemotherapy phases: Remission Induction (often referred to as just Induction) and Consolidation (post-remission therapy) (Cancer.org, 2018). As AML has a very quick progression, it is crucial that the treatment will start as soon as possible following the diagnostic.
Occasionally, before chemo, patients have to undergo another type of treatment in order for chemo to have a chance of working (Cancer.org, 2018). When some people are diagnosed, they have unusually large numbers of leukemic cells in their blood, causing them problems with normal circulation. This is called leukostasis (Cancer.org, 2018). Because it can take chemo a few days to lower the number of leukaemia cells in the blood, sometimes Leukapheresis is used before, and it represents the procedure of passing the patient’s blood through a special machine that removes white blood cells and returns the rest of the blood to the patient and although this treatment lowers the blood counts right away, it is only effective for a short time and it is mostly used in order to give chemo a better chance of working (Cancer.org, 2018).
Induction represents the initial part of the treatment, which aims to eliminate as many leukaemia cells as possible, and the intensity of the treatment is determined while taking into consideration the patient’s age and health (Cancer.org, 2018). Induction is responsible for the destruction of most of the normal bone marrow cells as well as leukaemia cells. At this stage, most people develop very low blood counts, which may make them very ill; therefore, most patients need antibiotics and blood product transfusion (Cancer.org, 2018). However, blood counts stay low for a few weeks, time that the patients usually spend in the hospital. Furthermore, over the next weeks, new blood cells are to be produced by the normal bone marrow cells. Remission induction does not destroy all the leukaemia cells, so without a treatment plan, it is highly likely that the leukaemia will return within several months (Cancer.org, 2018).
If remission is achieved, the Induction stage is considered successful. Any further treatment given aims at destroying any remaining leukaemia cells and preventing a relapse. Consolidation represents post-remission therapies.
During recent years, there have been developed new drugs that target certain parts of cancer cells and they work differently than standard chemotherapy drugs (Cancer.org, 2018). They can be used either on their own when chemo is not working, or along with chemo in order to aid it work better. Such drugs are Midostaurin, Enasidenib, or Gemtuzumab ozogamicin (Cancer.org, 2018).
2.2 Role of poly(ADP-ribosyl)ation (PARylation) in DNA damage and apoptosis
2.2.1 (PARylation) in DNA damage and apoptosis
Adenosine diphosphate (ADP)-ribosylation represents a post-translational modification which is primarily catalysed by poly (ADP ribose) polymerases (or PARPs) (Wei and Yu, 2016). It involves the addition of an ADP unit to a target protein and it preferentially occurs on lysine or glutamate residues (Sousa et al., 2012). PARPs are responsible for numerous cellular processes, such as DNA damage response (DDR), chromatin remodelling, transcriptional regulation etc (Sousa et al., 2012).
Immediately following DNA damage there are cellular responses in which numerous actions are being taken in order to either repair the DNA lesions or induce apoptosis, or programmed cell death (Sousa et al., 2012).
Despite the fact that the neither member of the PARP family possesses DNA enzymatic activity, PARP activity has been linked to DNA repair. This statement is founded on 3 main observations: (i) DNA damage is the main activator of PAR synthesys, (ii) the inhibition of PARPs 1-3 makes cells sensitive to DNA-damaging agents, and (iii) there have been reports of PARPs 1-3 physically and/or functionally interacting with various DNA repair proteins (Wei and Yu, 2016).
Sometimes, the DNA damage levels are too high for the cellular repair capacity, and when this happens, programmed cell death is activated in order to avoid cells acquiring mutations that may lead to carcinogenesis (Sousa et al., 2012). Due to PARylation being a DNA damage-dependent enzymatic activity, extensive DNA damage is accompanied by large-scale PAR polymer synthesis. Nonetheless, excessive PAR production can lead to a unique form of caspase-independent cell death, called parthanatos (Sousa et al., 2012). This type of cell death is identified with fast PARP-1 activation, early PARP accumulation, mitochondrial depolarization, loss of cellular NAD and ATP and late caspase activation (Sousa et al., 2012).
2.2.2 DNA damage and apoptosis: general aspects
In order for the DNA to maintain genome integrity, it undergoes continuous repairs (Wang, 2001). DNA damage may result either from errors in replication or recombination, or from the action of endogenous reactive oxygen species (Norbury and Zhivotovsky, 2004). When DNA lesions happen, unicellular organisms respond to them by activating cell cycle checkpoint and repair mechanisms, whereas multicellular organisms have the additional possibility of triggering programmed cell death, or apoptosis (Norbury and Zhivotovsky, 2004).
2.2.3 Poly(ADP-ribose) polymerases
PARP represents a family of proteins involved in a number of cellular processes, such as DNA repair, genomic stability, and apoptosis (Amé, Spenlehauer and de Murcia, 2004).
PARP-like genes have been identified in both prokaryotes and eukaryotes. The PARP family have a variety of structural domains, have a large set of functions and localize to diverse cellular compartments (Sousa et al., 2012)).
2.2.4 The PARylation reaction
The PARylation process implies the addition of an ADP-ribose unit (ADPr) to a target protein, preferentially at a lysine or glutamate residue (Sousa et al., 2012).
Through the attachment of an ADPr, the function of the target protein is altered through not only steric, but also electrostatic effects (Sousa et al., 2012). The PARylation reaction can be either mono- or poly ADP-ribosylation, the latter happening when more than just one ADPr unit is added to the target protein (Sousa et al., 2012).
The catalysis of the ADPr units implicates the hydrolysis of NAD+, the release of nicotinamide (NAM) and a proton (H+), and the transfer of either single or consecutive ADPr units to acceptor proteins (Sousa et al., 2012). The PARylation reaction can be observed in Figure 1.
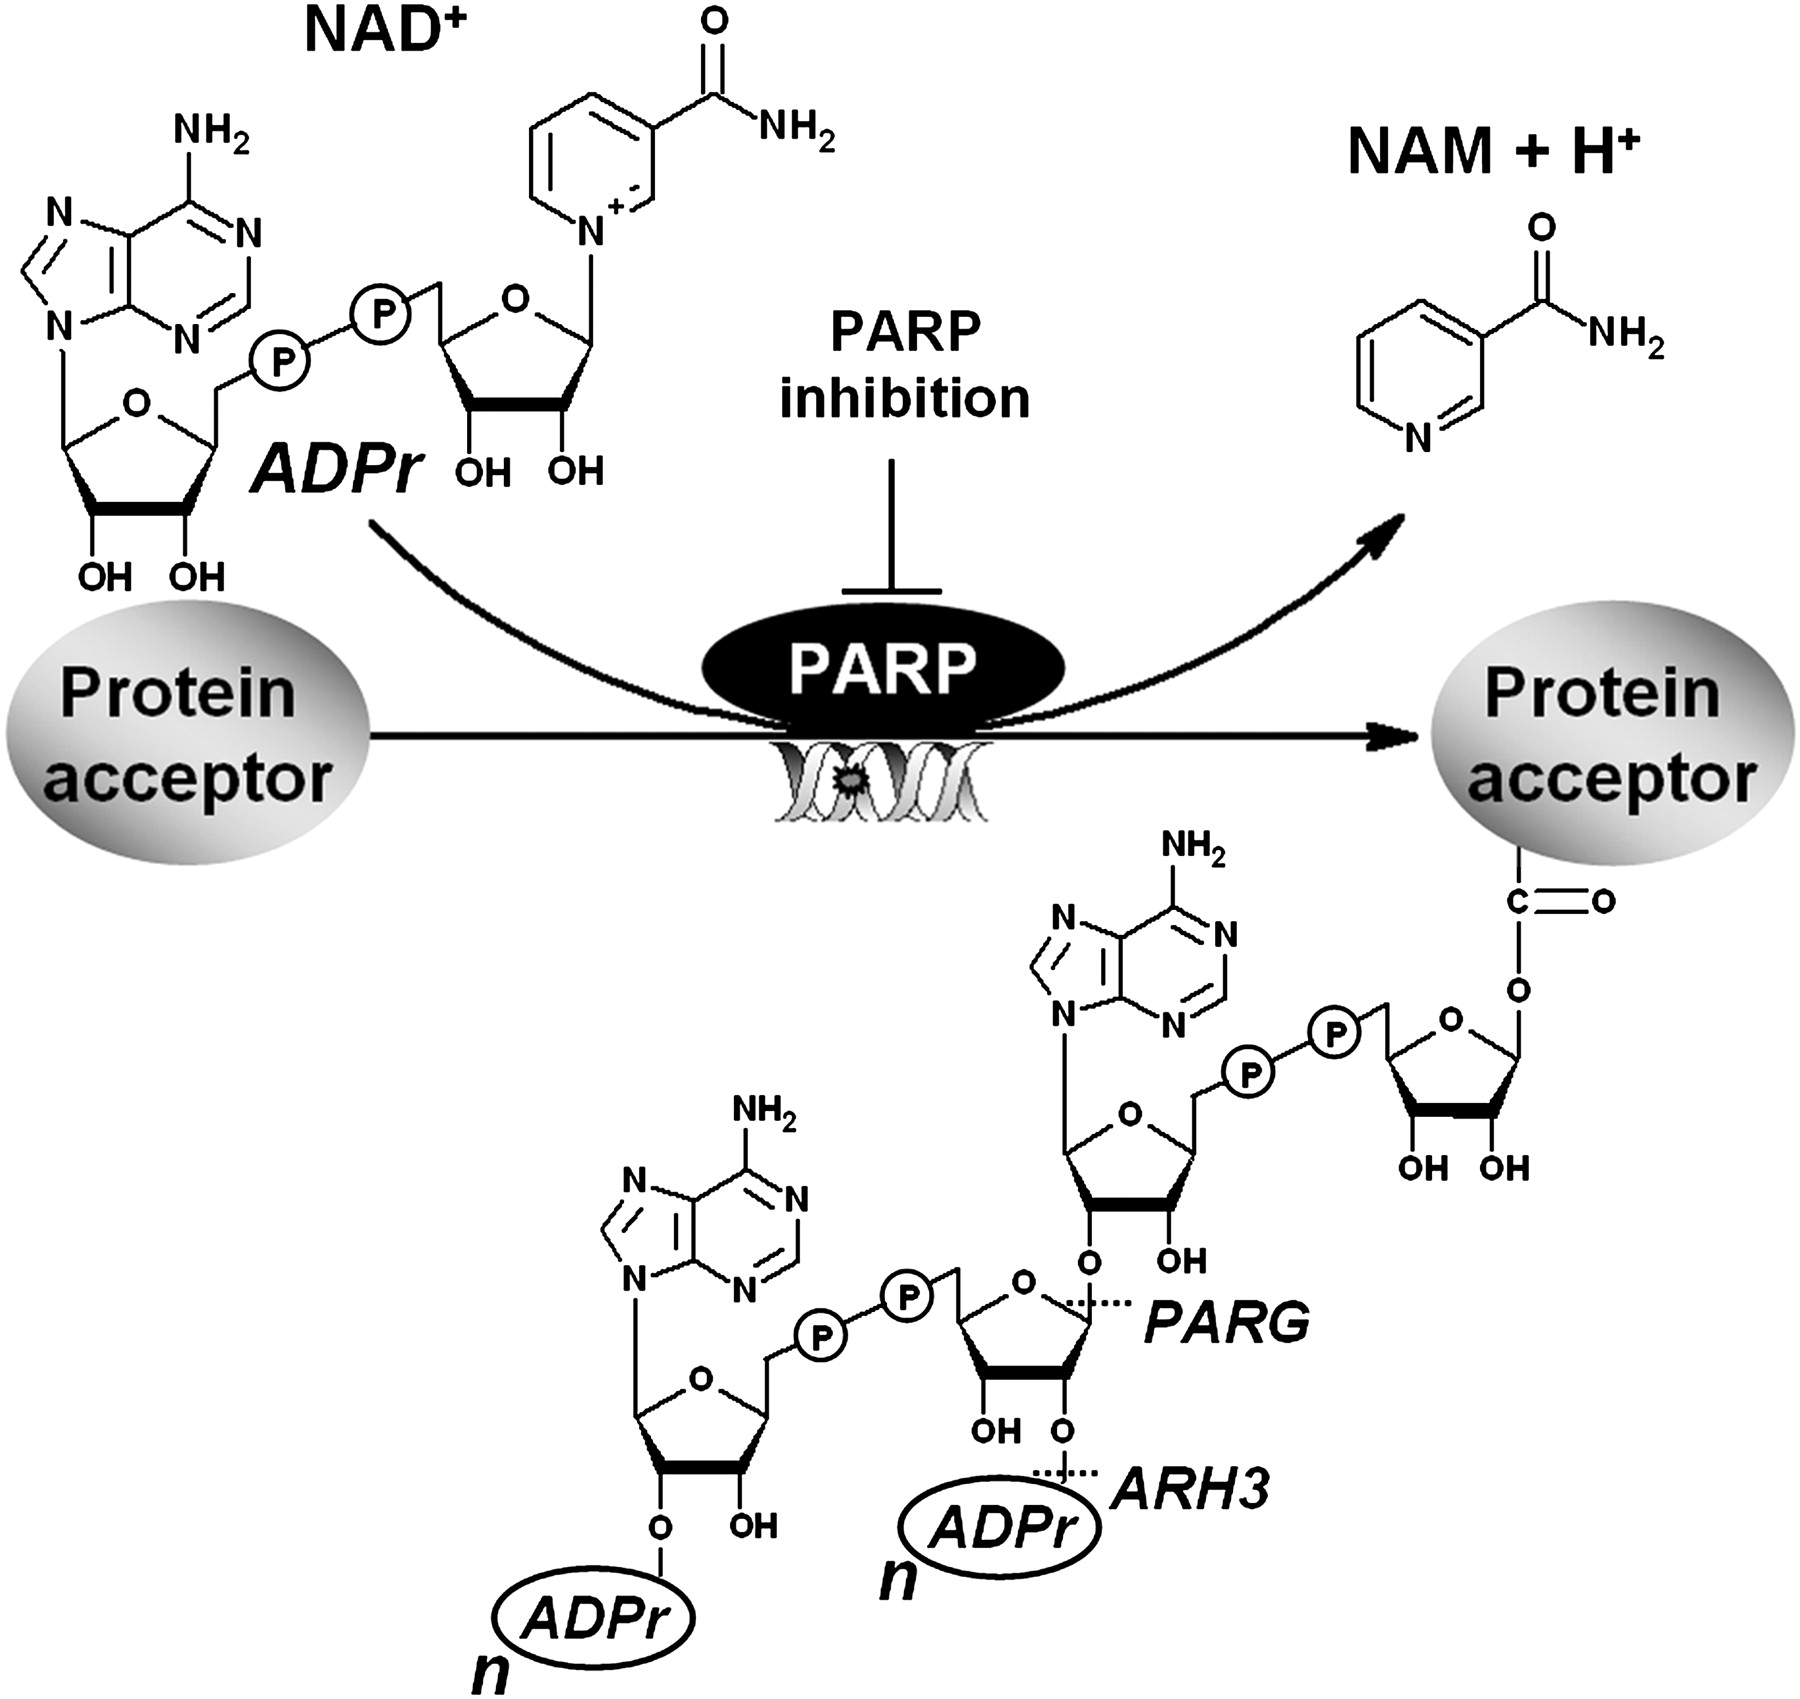
Figure 1: the Poly(ADP-ribosyl)ation reaction. As a response to DNA damage or other cellular stimulus, PARPs 1–3 hydrolyse NAD+ and catalyse the consecutive transfer of the ADP-ribose moiety to protein acceptors, releasing nicotinamide (NAM) and one proton (H+). The ADPr units are linked to each other via glycosidic ribose–ribose bonds resulting in linear or multibranched poly(ADP-ribose) polyanions. These PAR polymers are rapidly degraded by poly(ADP-ribose) glycohydrolase (PARG) and poly(ADP-ribose) hydrolase 3 (ARH3) enzymes (Sousa et al., 2012).
2.2.5 PARylation inhibitors and their use in cancer therapy
PARP inhibitors are regularly based on benzamide or purine structures constructed in such a way that allows them to compete with NAD+ in the CD of PARP-1 and/or PARP-2 (Sousa et al., 2012). The current PARP inhibitors are turning out as promising anticancer agents, and they are capable of sensitizing tumour cells to DNA-damaging agents or inducing synthetic lethality as single drugs in cancer with DSBR defects (Sousa et al., 2012). The notion of synthetic lethality is that the inhibition or deletion of either 2 genes is manageable, but the combined deletion and inhibition of both genes will cause the cell to die (Sousa et al., 2012). Hence a new therapeutic approach was discovered in order to selectively kill the cancerous cells, by combining the synthetic inhibition by an anticancer drug with a pre-existent oncogenic mutation (Sousa et al., 2012). The final outcome is represented by an increase in the therapeutic index combined with the reduction of the toxic side effects (Sousa et al., 2012).
2.2.6 Role of topoisomerase II in nuclear processes
Topoisomerases represent ubiquitous enzymes that are in charge of controlling DNA supercoiling and entanglements and their role is crucial during transcription and replication (Pommier, 2013). They are vital for all the processes that involve DNA movement within the nucleus or for the opening of the double helix (Deweese and Osheroff, 2008)). Its main function is the regulation of DNA under- and over-winding and it removes tangles and knots from the genetic material. In order for the topoisomerase II to carry out its physiological role, topoisomerase II can create transient double-stranded breaks in DNA. Therefore, the enzyme can fragment the genome, if it is necessary for cell survival (Deweese and Osheroff, 2008).
2.2.7 Topoisomerase II inhibitors and their use in cancer therapy
Topo2 has held the interest of researchers studying cancer due to the discovery of the fact that anti-cancer drugs, most important being etoposide and doxorubicin, target Topo2. Studies show that most clinically active drugs that target Topo2 generate enzyme mediated DNA damage (Nitiss, 2009).
Topoisomerase II has the ability to produce a cleavage/ligation of the DNA, which makes it the target for some of the most successful anticancer drug therapies currently in use (Deweese and Osheroff, 2008).
There are 2 classes of drugs targeting Topo II: poisons and catalytic inhibitors. Topo II poisons consists of the most clinically active agents, including Etoposide, Doxorubicin, and Mitoxantrone, and they are responsible for generating DNA lesions such as DNA strand breaks and the covalent bound of protein to DNA (Nittis 2009 cancer therapy). Catalytic inhibitors of Topo II are believed to kill cells by eradicating the essential enzymatic activity of Topo II (Nitiss, 2009).
2.3 THP-1 cells as a cellular model for AML
THP-1 designates a spontaneously immortalized monocyte-like cell line, derived from the peripheral blood of a childhood case of acute monocytic leukaemia (Bosshart and Heinzelmann, 2018), and it is used in the investigations of monocyte/ macrophage mechanisms, nutrient/drug transport, functions and signalling pathways (Chanput, Mes and Wichers, 2014). Both THP-1 cells and their genetically engineered derivativees represent valuable tools for investigating monocyte structure and function both in health and disease (Bosshart and Heinzelmann, 2018).
2.4 Aims and Objectives of the project
The hypothesis of this project is that the outcome of the combination of Topoisomerase II inhibitors and PARP inhibitors will be greater than the outcome of using them individually. This study aims to examine the effects of the 2 drugs on human monocytic THP-1 cell line. The Topo II inhibitors used were Etoposide and Genistin, and the PARP inhibitors used were 3-ABA, ABT888, NU1025, and PJ34. The findings from this study were focused on Etoposide and 3-ABA. The drugs were applied individually as well as together in order to observe how they affect cancerous cells.
3. MATERIALS AND METHODS
3.1 Passaging Cells in Suspension
The monocytic THP-1 cell line has been used and it has been maintained in the RPMI 1640 medium (Lonza), supplemented with 10% FBS (biosera) and 50ug/mL of gentamicin (Gibco, Invitrogen). Each experiment conducted throughout this project was tested upon THP-1 cells.
3.2 Cell Counting
An aliquot of 15uL from the re-suspended pellet with fresh medium have been loaded on a haemocytometer chamber with a cover slip in order to count cells under light microscopy, at a 10x magnification.
Cells have been seeded at a density of 2.5×10^5, 3×10^5, 3.5×10^5, and 4×10^5 cells/mL onto 12 well plates. Every day, 1 mL from each well was centrifuged for 3 minutes at 2000 rpm in order to separate the supernatant, which was then removed and 400uL of medium and 100uL of Trypan Blue dye were added in its place. The new mixture was re-suspended and left to rest for 5 minutes. Both the alive and the dead cells were then counted with the aid of haemocytometers and light microscopy.
3.3 Trypan Blue Dye Staining
The numbers of dead cells and viable cells within cell suspension have been determined using the Trypan Blue dye, which stains dead cells blue, alive cells actively excluding this dye. Trypan blue requires at least 5 minutes in order for it to be absorbed by the cells. The cells were afterwards counted under light microscopy, using haemocytometers, and the blue (dead) cells were always counted before the total cell number.
3.4 The Topoisomerase II drug addition
The Topoisomerase inhibitor Etoposide has been supplied as 1mM stock solution prepared in 100% DMSO. 4 different concentrations of the drug were applied to the THP-1 cells seeded at 2.5×10^5 cells/mL: 1uM, 2.5uM, 5uM, and 10uM. Each concentration was observed for 4 days, while the viable and dead cells were counted using Trypan blue and haemocytometers inspected under light microscopy. Based on the observations, 2 individual graphs were created: one plotting the total cell number in each case against time, and the other one showing the percentages of dead cells plot against time. The optimal concentration of the Topoisomerase II inhibitor was determined using these graphs, by selecting the lowest concentration that was able to effectively influence cell growth.
3.5 The PARP inhibitor addition
The PARP inhibitor 3-ABA has been supplied as 2mM stock solution prepared in 100% DMSO. 2 different concentrations of the inhibitor, 1.5uM and 2.5uM, were applied to the THP-1 cells seeded at 2.5×10^5 cells/mL seeding density and the numbers of total and dead cells were observed over the next 4 days following the same procedure as before. 2 graphs were generated: one plotting the absolute number of cells against time, and one plotting the percentages of dead cells against time. The optimal PARP inhibitor concentration chosen was the lowest one that effectively influences cell growth.
3.6 Combinatorial drug experiments
The optimal concentrations of the Topoisomerase II and PARP inhibitors were added onto the THP-1 cells seeded at 2.5×10^5 cells/mL both individually and combined. The PARP inhibitor was added first, before the Topoisomerase II inhibitor, due to its property of blocking the repair systems of the DNA. There were 3 wells from the 12 well plate allocated to each test subject: control, PARP inhibitor, Topo II inhibitor, and PARP and Topo II inhibitor. The first 2 days of the experiment were dedicated to the seeding processes, and the following 3 days were used for counting both the viable and dead cells, following the same procedure as in the previous experiments.
3.7 Growth Curves and Doubling Time Calculations
Growth curves were conducted for each experiment of this project and they were represented through graphs plotting the total number of cells (x10^5) against time (hours).
Cell doubling times was calculated using the following formula: Doubling Time = ln(2)/ Growth rate. The growth rate itself can be calculated using the equation: Growth Rate = ln (N(t)/N(0))/t, where N(t) is the number of cells at the time t, N(0) represents the number of cells at time 0, and t is time (hours).
3.8 Statistical analysis
Standard deviations were calculated for every experiment that contained replicas of the test subjects. Data are presented as the means ± SD. All values were calculated using Microsoft Office Excel 2010.
T-tests were conducted for each experiment in order to compare two means and identify whether those data are significantly different from each other. This ensures the results obtained were not by chance.
Each t-value has corresponding p-value attached. This study utilized a p-value of 0.05, meaning any value less than 0.05 was considered significant. These values were also obtained by using Microsoft Office Excel 2010.
4. RESULTS
4.1 OPTIMISATION OF THE SEEDING DENSITY OF THP-1 CELLS
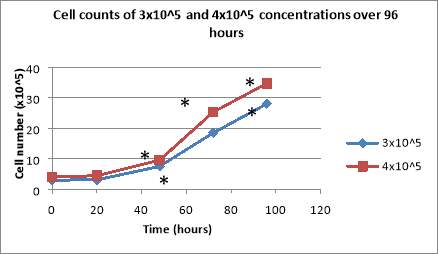
This project aims at determining whether Topo II and PARP inhibitors induce apoptosis and inhibit cell growth, which is an important step in finding a cure for AML. The first experiments conducted intended to find out the optimal THP-1 cell concentration that does not plateaux and does not lead to a significant number of dead cells. Initially, the seeding densities used were 3×10^5 cells/mL and 4×10^5 cells/mL. Subsequent to plating, the total cell number for both concentrations was calculated every day, using haemocytometers. The cells presented exponential growth, the final total cell number, after 96 hours, being 28 cells/mL for the cells with 3×10^5 cells/mL as their original concentration, and 34.7 cells/mL for those with 4×10^5 cells/mL as their initial seeding density (Figure 2A).
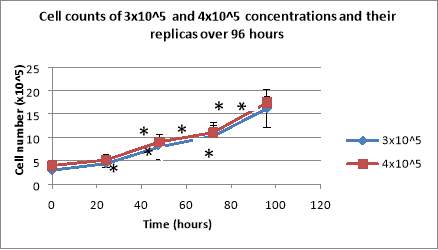
Following the same procedure, the experiment was repeated, this time using replicate wells for both concentrations in order to enable the use of standard deviation. The cells presented exponential growth, reaching values of 16.15×10^5 cells/mL for cells with 3×10^5 cells/mL as their initial seeding density, and 17.425×10^5 cells/mL for those with 4×10^5 cells/mL (Figure 2B).
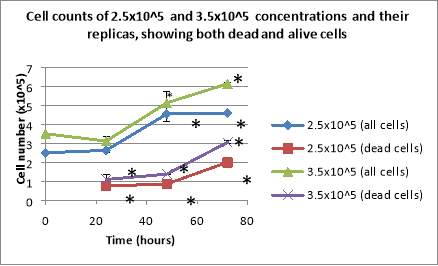
The experiment was repeated, using 2.5×10^5 cells/mL and 3.5×10^5 cells/mL as initial seeding densities. Furthermore, besides counting the total cell number, the number of dead cells was noted too. The cells plated with the 3.5×10^5 cells/mL concentration showed a decline in the total number of cells after 24 hours, followed by continuous growth over the next 48 hours, reaching 6.125×10^5 cells/mL at the 96 hours mark. The cells plated at the 2.5×10^5 cells/mL concentration presented exponential growth over the entire period of 72 hours, the final cell number being 4.5875×10^5 cells/mL (Figure 2C). Both cases displayed a continuous increase in the percentages of their dead cells over the entire period (Figure 2C).
The final seeding density of the THP-1 cells that was used all throughout the project was 2.5×10^5 cells/mL.
 (A)
(A)
**
*
*
 (B)
(B)
*
 (C)
(C)
Figure 2: Cell counts of 3×10^5 and 4×10^5 cell concentrations over 96 hours (A) and the cell counts of the same concentrations and their replicas (B). After being seeded, the cells were counted daily under light microscopy, using haemocytometers. Cell counts of 2.5×10^5 cells/mL and 3.5×10^5 cells/mL showing both the total number of cells and the number of dead cells (C). Data are the mean +/- SD of two experiments. *P<0.05 was considered significant.
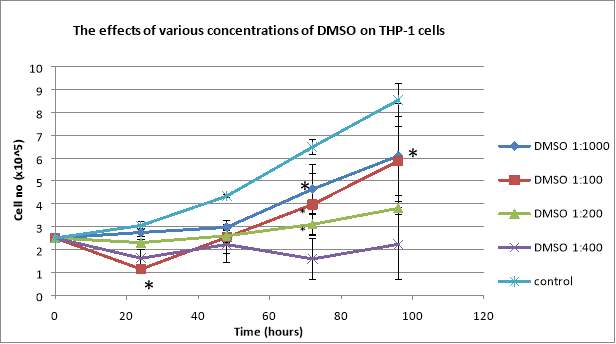
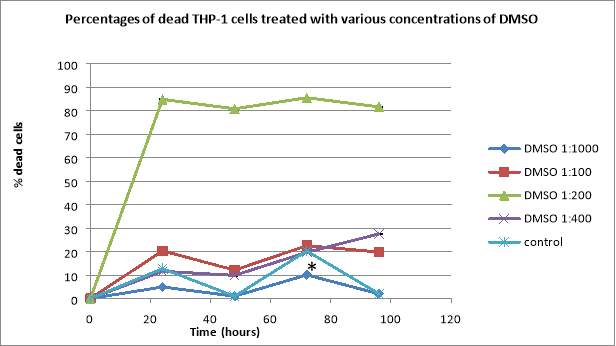
4.2 ASSESSING THE TOXICITY OF DMSO*
During this experiment, the toxicity of DMSO was tested in order to find the optimal concentration that is not too harmful for the THP-1 cells. DMSO represents an organic solvent that was applied before adding any of the inhibitors in order to dissolve them. For testing different concentrations of DMSO, 4 dilutions were made: 1:1000, 1:400, 1:200, and 1:100.
After plating the cells, the total cell number and the total number of dead cells were counted daily. Due to its toxicity, even in small concentrations, DMSO affects the THP-1 cells. The total number of cells for control showed exponential growth, having 8.535×10^5 cells/mL after 96 hours, whereas the cells treated with DMSO not only exhibited a lower number of total cells, but also a higher percentage of dead cells (Figure 3). The 1:100 dilutions presented a big decline in the total number of cells in the first 24 hours, followed by an exponential growth over the next 72 hours, reaching 5.875×10^5 cells/mL after 96 hours, when they also showed 19.78% dead cells (Figure 3). The 1:400 dilution presented a decline in the total number of cells, it reaching 2.225×10^5 cells/mL, and the percentage of dead cells increased every day, reaching 27.52% after 96 hours (Figure 3). The 1:200 dilutions displayed a decline in the total number of cells after 24 hours, followed by exponential growth (3.8×10^5 cells/mL at the 96 hours mark) but, regarding the percentage of dead cells, it showed over 80% after only 24 hours and the highest percentage of dead cells took place at the 72 hours mark with 85.48% (Figure 2). The 1:1000 dilution presented exponential growth in regards to the total cell number (6.09×10^5 cells/mL after 96 hours), and also it presented the lowest percentages of dead cells, with only 2% dead cells after 96 hours (Figure 3).
Therefore, the optimal concentration of DMSO used that was not too damaging for the THP-1 cells was the 1:1000 dilution.
*
(A)
(B)
Figure 3: Effects of DMSO on proliferation of human leukemic THP-1 cells (A). The cells were seeded at 2.5×10^5 cells/mL and were treated with 4 dilutions of DMSO (1:1000, 1:100, 1:200, 1:400) and observed over 96 hours. The percentages of dead THP-1 cells treated with various concentrations of DMSO (B). Data are the mean +/- SD of two experiments. *P<0.05 was considered significant.
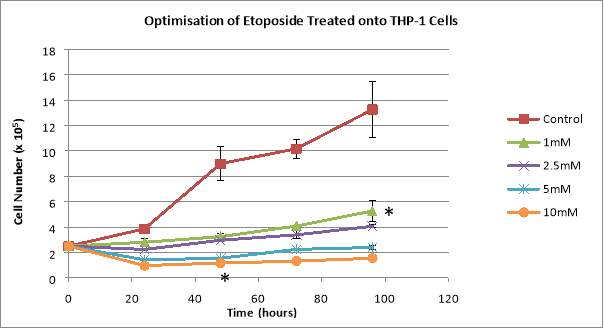
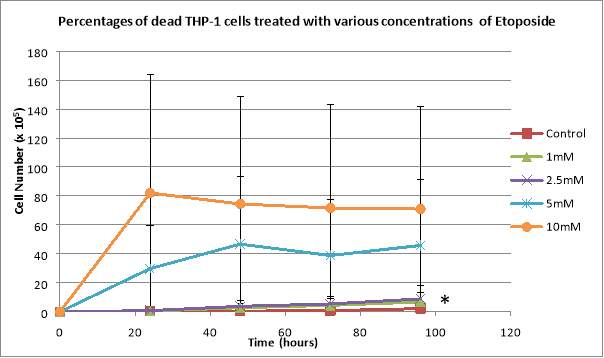
4.3 OPTIMISATION OF ETOPOSIDE
Throughout this experiment, the Topoisomerase II inhibitors were added and the objective was finding the optimal concentration of Etoposide.
The final concentrations of Etoposide used were 1mM, 2.5mM, 5mM, and 10mM. When treated with 10mM of Etoposide, the total number of cells presented a decline from 2.5×10^5 cells/mL to 0.975×10^5 cells/mL after only 24 hours, followed by the cells plateauing, and the percentage of dead cells reached the significant value of 82.05% after 24 hours, followed by a continuous decline, reaching 70.96% after 96 hours (Figure 4). 5mM of Etoposide added to cells created a decline in the total number of cells after 24 hours, reaching 1.425×10^5 cells/mL, followed by exponential growth (2.4×10^5 cells/mL after 96 hours), and it also produced 46.77% of dead cells after 48 hours, followed by a decline to 38.88% after 72 hours, and another increase to 45.83% after 96 hours (Figure 3). The 2.5mM concentration presented exponential growth regarding the total number of cells, reaching 4.06×10^5 cells/mL after 96 hours, and the percentages of dead cells also displayed a continuous growth, reaching 8.9% after 96 hours (Figure 4). When treated with 1mM of Etoposide, the cells presented exponential growth, reaching 5.269×10^5 cells/mL after 96 hours and the percentage of dead cells also showed a continuous increase, reaching 6.8% after 96 hours (Figure 4). Untreated cells displayed exponential growth, reaching 13.256×10^5 cells/mL after 96 hours and also the lowest percentages of dead cells, reaching only 0.29% after 96 hours (Figure 4).
The optimal concentration of Etoposide to be added to the THP-1 cells was 1mM.
(A)
(B)
Figure 4: Graphs showing the effects of various concentrations of Etoposide on THP-1 total cell counts (A) and the percentages of dead THP-1 cells treated with the same Etoposide concentrations (B). 2.5×10^5 cells/mL were plated and treated with 1mM, 2.5mM, 5mM, and 10mM of Etoposide. Data are the mean +/- SD of two experiments. *P<0.05 was considered significant.
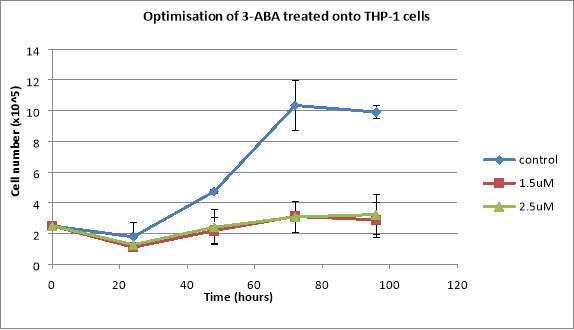
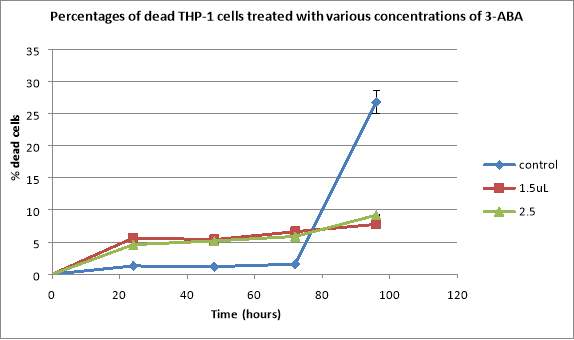
4.4 OPTIMISATION OF 3-ABA
Throughout this experiment, the PARP inhibitors were added and the aim was finding the optimal concentration of 3-ABA. The final concentrations of 3-ABA used were 1.5mM and 2.5mM.
Control cells had a decline after 24 hours, reaching 1.78×10^5 cells/mL, followed by exponential growth until the 72 hours mark, when there were 10.34×10^5 cells/mL, and then another decline to 9.91 cells/mL, and also it resulted in the smallest percentage of dead cells reaching only 1.57% after 72 hours, followed by a rapid increase to 26.78% in the last 24 hours of observation (Figure 5). Cells treated with 1.5uM of the drug displayed a decline to 1.1×10^5 cells/mL after 24 hours, followed by a continuous growth until the 72 hours mark (3.11×10^5 cells/mL) and a decline to 2.89×10^5 cells/mL in the last 24 hours (Figure 5). The percentage of dead cells in this case showed a decline from 5.64% after 24 hours to 5.38% at the 48 hours mark, followed by a continuous growth, reaching 7.77% after 96 hours (Figure 5). When added 2.5uM of the inhibitor, the total number of cells presented a decline from 2.5×10^5 cells/mL to 1.275×10^5 cells/mL after 24 hours, followed by exponential growth until reaching 3.23×10^5 cells/mL after 96 hours. The percentages of dead cells in this case increased constantly, reaching 9.18% after 96 hours (Figure 5).
Therefore, the final concentration of 3-ABA utilised was 1.5mM.
(A)
(B)
Figure 5: Graphs showing the effects of various concentrations of 3-ABA on THP-1 total cell counts (A) and the percentages of dead THP-1 cells treated with the same 3-ABA concentrations (B). Cells were seeded at a seeding density of 2.5×10^5 cells/mL and they were treated with 1.5uL and 2.5uL of 3-ABA. Data are the mean +/- SD of two experiments. *P<0.05 was considered significant.
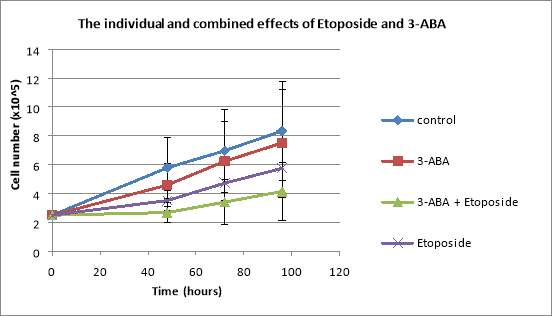
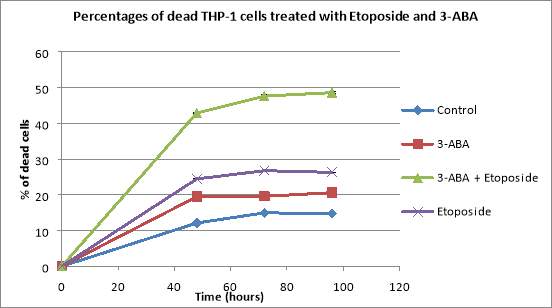
4.5 THE COMBINED EFFECTS OF ETOPOSIDE AND 3-ABA
During the final experiment of this project, both the Topoisomerase II inhibitor and the PARP inhibitor have been added to the cancerous cells, in order to observe the effects of the drug both combined and individually. The PARP inhibitor 3-ABA was added first, in order to block the cellular repair systems before Etoposide can trigger such repair systems by inducing programmed cell death.
Regarding the total number of cells, all of them, both untreated and treated with the inhibitors, resulted in an exponential growth. After the observation period of 96 hours, control cells reached 8.33×10^5 cells/mL, cells treated with 3-ABA reached 7.51×10^5 cells/mL, cells treated with Etoposide reached 5.75×10^5 cells/mL, and cells treated with both drugs reached 4.15×10^5 cells/mL (Figure 6A).
The percentage of dead cells for control increased continuously for 72 hours reaching 14.94%, and then decreased to 14.78% in the last 24 hours (Figure 6B). The percentages of dead cells treated with 3-ABA increased continuously, reaching 16.3% after 96 hours (Figure 6B). The percentages of dead cells that were added Etoposide increased continuously for 72 hours, reaching 26.74%, and then decreased to 25.86% at the 96 hours mark (Figure 6B). THP-1 cells treated with both of the inhibitors presented a continuous increase in the number of dead cells, reaching 48.58% after 96 hours (Figure 6B).
(A)
(B)
Figure 6: Graphs showing the effects of various concentrations of Etoposide and 3-ABA, both applied individually and together, on THP-1 total cell counts (A) and the percentages of dead THP-1 cells treated with the same concentrations of Etoposide and 3-ABA (B). The THP-1 cells were seeded at a seeding density of 2.5×10^5 cells/mL and they were treated with 1.5mM of 3-ABA and 1mM of Etoposide. Data are the mean +/- SD of two experiments. *P<0.05 was considered significant.
5. DISCUSSION
The elementary solution for finding a cure for AML is finding a way to cease excessive cell proliferation. The hypothesis of this project is that the outcome of the combination of Topoisomerase II inhibitors and PARP inhibitors will be greater than the outcome of using them individually. This study aims to examine the effects of the 2 drugs on human monocytic THP-1 cell line. The Topo II inhibitor used was Etoposide, and the PARP inhibitor used was 3-ABA. As these drugs do not dissolve in water, DMSO, which is an organic solvent, was used to help dissolve them. The drugs were applied individually as well as together in order to observe how they affect cancerous cells.
The first part of this project aimed at finding out the optimal seeding density of the THP-1 cells that did not plateaux and did not lead to a significant number of dead cells. The concentrations initially used were 3×10^5 cells/mL and 4×10^5 cells/mL. The same experiment was repeated the following week, this time using replicate wells for both seeding densities of the THP-1 cells. Both concentrations resulted in an exponential growth and they proved to be too high to be used for the following parts of the project.
As neither 3×10^5 cells/mL, nor 4×10^5 cells/mL were appropriate, the experiment was conducted again using 2 different seeding densities of THP-1 cells: 2.5×10^5 cells/mL and 3.5×10^5 cells/mL respectively. 3.5×10^5 cells/mL resulted in a concentration that is still too high to be used, whereas the 2.5×10^5 cells/mL concentration did not plateaux and it did not lead to a significant number of dead cells. Hence, the optimal seeding density of THP-1 cell line that would be used all throughout this project was 2.5×10^5 cells/mL.
There are multiple AML studies using THP-1 as cellular model, and the seeding densities vary from low values such as 0.5×10^5 cells/mL to higher values such as 5×10^5 cells/mL (Jagan et al., 2012). However, other studies have used even lower seeding densities of the monocytic cell line, such as 0.2×10^5 cells/mL (Hajighasemi F., Tajik S., 2017), whereas others used even higher concentrations such as 10×10^5 cells/mL (Tsan et al., 2000)
The objective of the next part of the project was assessing the toxicity levels of various concentrations of DMSO. DMSO represents the most used organic solvent as a cryopreservative agent (Hajighasemi F., Tajik S., 2017). Because DMSO represents an organic solvent, it was added to the cells before any of the inhibitors, in order for it to dissolve them. Due to the high toxicity levels of DMSO, 4 dilutions were made: 1:1000, 1:400, 1:200, and 1:100. In the absence of DMSO, the THP-1 cells had a doubling time of 41.27 hours. The addition of DMSO at 1:200 significantly reduced proliferation and increased the doubling time to 81.71 hours.
Literature findings state that DMSO has a cytotoxic effect on the THP-1 cell line, influenced by not only the dose of DMSO added, but also the time it was left on (Hajighasemi F., Tajik S., 2017). DMSO significantly diminishes the proliferation of THP-1 cells at concentrations higher than 2% (Hajighasemi F., Tajik S., 2017). However, the same study states that DMSO did not have any cytotoxic effect on the proliferation of leukemic cells at a concentration of 0.1%, and it also demonstrated that DMSO does not present any significant toxicity level on human leukemic cell lines when it is added at a concentration lower than 2% (Hajighasemi F., Tajik S., 2017).
Nonetheless, on the grounds that during this experiment DMSO showed high cytotoxicity levels, the concentration used was 0.1% (1:1000 dilution).
The next experiment was represented by the testing of various concentrations of the Topoisomerase II inhibitor Etoposide on THP-1 cells. The final 4 concentrations used were 1mM, 2.5mM, 5mM, and respectively 10mM. The untreated cells presented an exponential growth compared to the treated cells. Furthermore, the higher the concentration of Etoposide used, the higher the percentage of dead cells, and the smaller the total number of cells. The 10mM and 5mM concentrations presented over 70%, and respectively 40% of dead cells over a period of 96 hours and the cells that were still alive plateaued. On the contrary, the 1mM and 2.5mM concentrations both presented less than 10% of dead cells, but the cells didn’t plateaux and showed a continuous growth.
Studies talking about the apoptosis process in human monocytic THP-1 cells have used higher doses of the drug, such as 25uM (Zhuang, Dinsdale and Cohen, 1998) ). So do studies discussing the dissociation of phagocyte recognition of cells undergoing apoptosis (Zhuang et al., 1998), which have also used 25uM of Etoposide on THP-1 cells before incubation.
However, the concentration of Etoposide used during this experiment was 1mM.
For this experiment, the objective was finding out the optimal concentration of the PARP inhibitor 3-ABA from the final 2 concentrations of 1.5uM and 2.5uM. The untreated cells presented an exponential growth over the first 72 hours, followed by a small decline in the last 24 hours of observation, whereas the THP-1 cells treated with 3-ABA showed a decline in the total number of cells in the first 24 hours following being added the drug, and then an exponential growth. Even when using small concentrations of 3-ABA, the cells present a continuous increase in the percentage of dead cells, between 4% and 10%, whereas the control THP-1 cells presented about 2% of dead cells over the first 72 hours, followed by a significant increase in the percentage of dead cells in the last 24 hours of observation, from 2% to over 25%. Therefore, the optimal concentration of 3-ABA used was 1.5uM.
Studies discussing cell death pathways of activated monocytes have used 3mM of 3-ABA, responsible for 12 (± 1.89)% of dead cells (Castaigne, 2002), but the THP-1 cells were also treated with IFN- γ, which is an important activator of macrophages and inducer of Class II major histocompatibility complex (MHC) molecule expression (Castaigne, 2002).
The last part of this project aimed at observing the combined effects of 3-ABA and Etoposide on THP-1 cell. 3-ABA was added before the Topoisomerase II inhibitor, due to its ability to block the cellular repair systems. When the drugs were applied individually, both cases resulted in exponential growth, with the absolute number of cells for the cells that were added 3-ABA being higher than the absolute number of cells for those which were added Etoposide. However, the cells that were added both drugs presented not only the lowest number of cells, but also the highest percentages of dead cells. 3-ABA added to the cells by itself resulted in a lower percentage of dead cells than those were added Etoposide on its own.
The project had time limitations. Only two replicas were produced for each experiment, in order to be able to calculate the means and the standard deviation of the data. Further repeats of the experiments would produce more accurate data.
This study was based on the hypothesis that the combination of Topo II and PARP inhibitors would result in a better outcome than the result of each of the inhibitors used individually, hypothesis that proved to be correct within this project.
6. REFERENCES
Amé, J., Spenlehauer, C. and de Murcia, G. (2004). The PARP superfamily. BioEssays, 26(8), pp.882-893.
Bosshart, H. and Heinzelmann, M. (2018). THP-1 cells as a model for human monocytes. [online]
Atm.amegroups.com. Available at: http://atm.amegroups.com/article/view/11701/12871 [Accessed 12 Mar. 2018].
Cancer Research UK. (2018). Acute myeloid leukaemia (AML) statistics. [online] Available at: http://www.cancerresearchuk.org/health-professional/cancer-statistics/statistics-by-cancer-type/leukaemia-aml#heading-Zero [Accessed 12 Mar. 2018].
Cancer.org. (2018). Targeted Therapy for Acute Myeloid Leukemia. [online] Available at: https://www.cancer.org/cancer/acute-myeloid-leukemia/treating/targeted-therapy.html [Accessed 11 Mar. 2018].
Cancer.org. (2018). Typical Treatment of Most Types of Acute Myeloid Leukemia (Except Acute Promyelocytic M3). [online] Available at: https://www.cancer.org/cancer/acute-myeloid-leukemia/treating/typical-treatment-of-aml.html [Accessed 11 Mar. 2018].
Cancerresearchuk.org. (2018). About acute myeloid leukaemia (AML) | Acute myeloid leukaemia (AML) | Cancer Research UK. [online] Available at: http://www.cancerresearchuk.org/about-cancer/acute-myeloid-leukaemia-aml/about-acute-myeloid-leukaemia [Accessed 12 Mar. 2018].
Castaigne, J. (2002). A CD18-dependent protein kinase C beta-mediated alternative cell death pathway of activated monocytes. International Immunology, 14(9), pp.1003-1014.
Deweese, J. and Osheroff, N. (2008). The DNA cleavage reaction of topoisomerase II: wolf in sheep’s clothing. Nucleic Acids Research, 37(3), pp.738-748.
Estey, E. and Döhner, H. (2006). Acute myeloid leukaemia. The Lancet, 368(9550), pp.1894-1907.
Hajighasemi F, Tajik S. Assessment of Cytotoxicity of Dimethyl Sulfoxide in Human Hematopoietic Tumor Cell Lines.IJBC 2017; 9(2): 48-53.
Jagan, S., Paganessi, L., Frank, R., Venugopal, P., Larson, M. and Christopherson, K. (2012). Bone Marrow and Peripheral Blood AML Cells Are Highly Sensitive to CNDAC, the Active Form of Sapacitabine. Advances in Hematology, 2012, pp.1-12.
Lowenberg, B., Downing, J. and Burnett, A. (1999). Acute Myeloid Leukemia. New England Journal of Medicine, 341(14), pp.1051-1062.
Nitiss, J. (2009). Targeting DNA topoisomerase II in cancer chemotherapy. Nature Reviews Cancer, 9(5), pp.338-350.
Norbury, C. and Zhivotovsky, B. (2004). DNA damage-induced apoptosis. Oncogene, 23(16), pp.2797-2808.
Pommier, Y. (2013). Drugging Topoisomerases: Lessons and Challenges. ACS Chemical Biology, 8(1), pp.82-95.
Sousa, F., Matuo, R., Soares, D., Escargueil, A., Henriques, J., Larsen, A. and Saffi, J. (2012). PARPs and the DNA damage response. Carcinogenesis, 33(8), pp.1433-1440.
Tsan, M., White, J., Maheshwari, J., Bremner, T. and Sacco, J. (2000). Resveratrol induces Fas signalling-independent apoptosis in THP-1 human monocytic leukaemia cells. British Journal of Haematology, 109(2), pp.405-412.
Wang, J. (2001). DNA damage and apoptosis. Cell Death & Differentiation, 8(11), pp.1047-1048.
Wei, H. and Yu, X. (2016). Functions of PARylation in DNA Damage Repair Pathways. Genomics, Proteomics & Bioinformatics, 14(3), pp.131-139.
Zhuang, J., Dinsdale, D. and Cohen, G. (1998). Apoptosis, in human monocytic THP.1 cells, results in the release of cytochrome c from mitochondria prior to their ultracondensation, formation of outer membrane discontinuities and reduction in inner membrane potential. Cell Death & Differentiation, 5(11), pp.953-962.
Zhuang, J., Ren, Y., Snowden, R., Zhu, H., Gogvadze, V., Savill, J. and Cohen, G. (1998). Dissociation of Phagocyte Recognition of Cells Undergoing Apoptosis from Other Features of the Apoptotic Program. Journal of Biological Chemistry, 273(25), pp.15628-15632.
Cite This Work
To export a reference to this article please select a referencing stye below:
Related Services
View all


Related Content
All TagsContent relating to: "Biomedical Science"
Biomedical Science focuses on how cells, organs and systems function in the human body and underpins much of modern medicine. Biomedical Science applies parts of natural and/or formal sciences to help develop advances in healthcare.
Related Articles

DMCA / Removal Request
If you are the original writer of this dissertation and no longer wish to have your work published on the UKDiss.com website then please: