Effect of Positive Morning Commutes on the Rest of the Day
Info: 8502 words (34 pages) Dissertation
Published: 28th Feb 2022
Tagged: Psychology
Abstract
It has been well established that your mood in the morning influences the rest of your day, and for many students, a large part of their morning is spent on the bus to university. However, commuting has a negative effect on well-being, with bus users being the most affected. Engaging in an activity has found to reduce travel disutility, and this study investigates which types of activities improve students’ bus journeys in order to positively impact the rest of their day. A questionnaire relating to trip characteristics and activities was distributed, as well as assessing satisfaction with the most recent commute, and subjective well-being. Although some trip characteristics predicted satisfaction and well-being, no relationship was found between activities and either outcome, which can be explained by lack of power and disregarding other important factors. Recommendations for bus service changes are provided, as well as suggestions for future research.
Introduction
For most people, commuting to work or school in the morning is a regular part of their daily routine. In 2016, 16% of all trips taken across all modes of transport in the UK were for commuting purposes (Department for Transport, 2017). For students attending Warwick University and commuting from Leamington Spa, as for many students around the country, a large amount of their morning is spent on the bus journey to university. However, studies have consistently shown that commuting has a negative effect on well-being (Novaco & Gonzalez, 2009; Roberts, Hodgson & Dolan, 2009; Office of National Statistics, 2014). This study investigates how the daily commute can be utilised in order to reduce this effect and improve psychological well-being in students.
Psychological well-being is a multidimensional concept which has been defined and researched in many ways and includes both subjective and objective components. Debates revolve around whether the hedonistic approach, which highlights maximising positive affect and minimising negative affect (Bradburn, 1969) or the eudaimonic approach, which highlights personal development and self-realisation (Rogers, 1961) should be used. Under the hedonistic approach, Diener et al. (1984) describe how subjective well-being encompasses both high positive affect and low negative affect, referring to moods, emotions, and feelings that one has about events in their life. Under the influence of Seligman’s (2004) ‘Positive Psychology’ movement based on the concept of Eudaimonia, Ryff proposed a six-factor model of subjective well-being, comprising of autonomy, environmental mastery, personal growth, positive relations with others, purpose in life, and self-acceptance. Based on this model, Dodge et al. (2012) proposed that well-being can be achieved through achieving equilibrium between challenging and rewarding life events. As subjective well-being concerns how individuals evaluate the quality of their own lives, it is defined by the individual and evaluated using self-report measures, although this can create problems surrounding reliability (Linton, Dieppe, & Medina-Lara, 2016). High subjective well-being has been associated with many objective outcomes, especially health and longevity (Diener, 2010); income, productivity, and organisational behaviour (Oswald et al. 2012; Peterson et al., 2011); and social behaviour (Nelson, 2009).
Research has shown that how you spend your morning before work influences well-being for the rest of your day, representing a resetting of affect from the day before (Marco & Suls, 1993). Rothbard and Wilk (2011) describe how your mood before you get to work is an “affective prime” for how you interpret your day, impacting both how you feel and how you perform, issues which are especially relevant for students, and for most, would ideally be maximised. The psychophysiological effects of commuting in the morning can spill over into the home and workplace, increasing job strain and affecting productivity and satisfaction (Wener, Evans, & Boately, 2005), as well as overall quality of life (Costal et al. 1988). While evaluating the effect of previous activities on subjective well-being, Kahneman et al. (2004) found the morning commute to generate the lowest level of positive affect out of a selection of 25 activities, concluding that this information should be used to inform public policy. This recognition that service changes and investments in transportation infrastructure can improve commuter’s quality of life has motivated researchers to investigate how well-being can be improved by travel conditions.
The burden on well-being has been found to be especially prevalent for those who commute by public transport. Paez and Whalen (2010) recognised that for university students, public transport users had the lowest commuter enjoyment compared to active transport and car users. In fact, active transportation commuters such as cyclists and pedestrians tend to be the most satisfied and have higher levels of subjective well-being (Martin, Goryakin & Suhrcke, 2014). Coupled with the increasing priority of sustainable transport, an ideal solution would be to increase the number of students who cycle into university. However, due to lack of appropriate infrastructure, the long distance, and unpredictable weather conditions, this is unlikely to be a popular option at Warwick University. The next best option in terms of sustainability is to improve the use of public transport, as the bus has been shown to be more environmentally sustainable than car transport and aids in decreasing traffic congestion (WBCSD, 2001). For these reasons, this study investigates ways in which student’s bus journeys can be improved, in order to positively impact well-being throughout the rest of their day and to encourage the use of the bus over less sustainable options such as driving.
St-Louis et al. (2014) recognised that satisfaction with the commute is determined by multiple factors, which differ across modes of transport. External trip characteristics, such as travel time and traffic congestion, as well as internal factors such as personal, social, and attitudinal variables, were found to be influential. St-Louis et al. found active transport was better for commuter satisfaction than the train, bus, or metro, due to the fact that individuals are getting value out of their commuter rather than just getting from one place to another. As Ory and Mokhtarian (2005) summarise, the objective features of a journey may not be the primary factors that influence trip satisfaction, as the effect is mediated by subjective measures. Consequently, the enjoyment of a commute may improve trip satisfaction, even if travel time decreases it. One of the ways in which enjoyment can be increased is through the behaviours and activities which commuters choose to engage in, which can give the trip value in a similar way to an active commute. Ohmori and Harata (2008) propose that engaging in activities while commuting reduces travel disutility as commuters will be less concerned about travel times. For commuters taking the train in Tokyo, participation in activities was found to be primarily determined by travel mode, as those who had to stand were limited as to which activities they engage in. Subsequently, participation was determined by the predictability of travel time. As some activities cannot be “fragmented”, to be conducted in smaller pieces, commuters didn’t engage in them if they were unsure whether they had enough time to complete them. Ohmori and Harata conclude that although increasing speed and frequency of the trains would increase satisfaction, so would improving train conditions to enable participation in activities.
Participating in activities has been found to link trip satisfaction to well-being. De Vos et al. (2013) explain that that transport researchers use the term “satisfaction” to comprise both the cognitive and affective evaluation of a trip, which although may capture some of the affective experiences associated with travel, is not the same as psychological well-being. De Vos et al. conducted a meta-analysis of studies concerning travel and subjective well-being and found that travel increases well-being due to enabling participation in activities and decreases well-being for those who are unable to participate. This is due to the facilitating the achievement of personal goals and feeling of purpose with their time (Abou-Zeid & Ben-Akiva, 2012). In support, Schwanen and Wang (2014) found that the subjective well-being gained from an activity depends on both the type of activity and the location in which it is conducted, and that activities spent outside of the home result in higher levels of well-being. Furthermore, the effect of context was found to be more important for overall well-being than for momentary satisfaction. Therefore, there is uncertainty in the literature about whether activities have a separate effect on trip satisfaction and well-being, or whether, through adding value to a commute, there is an impact on trip satisfaction which increases psychological well-being in the long-term.
Research has shown that passengers use their choice of activity to construct a more positive journey. Stradling et al. (2007) proposed the idea of an ‘ideal bus journey’, and described how most for most bus users, this involves feeling relaxed and switched off during their journey. A bus is a public place, resulting in what Stradling et al. describe as ‘social discomfort’, as well as boredom and stress. Therefore, passengers can take an active role in creating their own individual ideal journey by using strategies and activities to alleviate this. Clayton, Jain, and Parkhurst (2017) found that the most popular activities while commuting by bus were those related to personal benefit and relaxation, such as reading, listening to music, or browsing the internet. Alternatively, passengers may prefer a stimulating or productive commute. Gatersleben and Uzzel (2007) describe how different travel modes elicit different affective responses, and as commuting by public transport is boring, the opposite – excitement – may improve attitudes towards public transport. Jain and Lyons (2008) suggest that whether travel time is spent actively or passively depends on the individual. On the bus, some commuters may associate the journey with time to be productive and utilise the environment, whereas some may engage in activities to disengage from the environment (Bertelsen & Boedker, 2003). In this way, commuters create their own environment depending on their needs.
Camacho, Foth, Rakotonirainy and Rittenbruch (2017) offered that activity choice is due to commuter’s values, as some individuals value being stimulated by their travelling activities, and some valued feeling relaxed and disconnected from the environment. Camacho et al. proposed the use of Activity Theoryto understand what shapes activities within specific contexts. Diener (1884) used activity theories in explaining well-being, as it describes how the happiness obtained from an activity comes from the performance of the activity rather than the end state. Activity Theory states that happiness comes from the action, and that this action is directed by attaining psychological needs. Therefore, in-vehicle activities that better align with passengers’ needs will lead to better perceptions of the service and higher trip satisfaction (Carreira et al., 2014). Camacho et al. found that passengers most commonly valued wanting to be stimulated by their activities. However, this study had a limited number of participants, only four of whom were in the same age group as students at Warwick, and none of whom were also students.These participants may spend their time differently to students as they have different goals and motivations. Therefore, an area which has notbeen investigated is which type of activities while commuting improve trip satisfaction specifically for students.
For students, the motive or action that drives commuting activities may differ from the general public due to the high stress they experience with their studies, financial pressures, and time pressure (Misra, McKean, West, & Russo, 2000). Studies have demonstrated a decrease in student’s mental health due to stress (Suldo, Shaunessy and Hardesty, 2008), leading to an “alarming” surge in the prevalence of depression and anxiety (Bayram & Hilgel, 2008). According to Meijman and Mulder’s (1998) Effort-recovery model, periods of high stress and effort expenditure need to be followed by periods of recovery which are sufficient to undo negative effects which have built up throughout this time. This consists of both recovery activities and recovery experiences (Sonnetag 2001; Sonnentag & Fritz, 2007). There are three important components of the recovery experience: psychological detachment from work; relaxation; and the experience of mastery, which involves challenging experiences leading to learning and success (Sonnetag, Binnewies, & Mojza, 2008). Recovery experiences usually occur during evenings and weekends but have recently been studied in the context of the commute after work. Madelon & van Hooff (2013) found that after controlling for time spent commuting, relaxation during the journey home was beneficial for reducing anxiety and increasing serenity, two outcomes associated with work stress, although the effect was short-lived. Research on students has shown that taking part in recovery activities that involve relaxation and mastery over the weekend can improve well-being on Monday (Ragsdale, Beehr, Grebner and Han, 2011), but there is currently a lack of literature exploring whether recovery experiences in the morning can increase student’s well-being for the rest of the day.
This study investigates ways in which student’s bus journeys can be improved in order to positively impact the rest of their day and encourage the use of the bus over less sustainable options. The journey touniversity rather than back home will be targeted, due to the evidence that how you start your day affects performance later on. Satisfaction with the bus journey has been shown to be determined by many different factors, and both external characteristics of the trip that the commuter does not have control over, as well as internal, subjective aspects of the trip, which are the activities the individual chooses to engage in while travelling, will be considered. In line with previous literature, the study is concerned with the interaction between satisfaction with the commute and well-being. It has been established that commuting has a negative effect on well-being, but that this effect can be decreased by gaining value from the commute. Therefore, it is hypothesized that increasing trip satisfaction enhances well-being. Secondly, it is expected that although satisfaction with the bus journey is decreased by the negative external factors such as long travel times, engaging in an activity mediates this effect, increasing satisfaction. In terms of which activities have the greatest effect for students, a bi-directional hypothesis is proposed, that students who engage in relaxing, pleasurable activities will have a different perception of trip satisfaction than those who engage in productive, stimulating activities. Finally, also in line with previous findings, it is expected that for students, engaging in a disengaging activity increases psychological well-being.
Method
Participants
Participants were an opportunity sample of 129 students who completed the survey online. Participants were not offered an incentive or compensated for their time. Thirty respondents (23.2%) were excluded as their surveys weren’t sufficiently completed. Three participants (2.3%) were further excluded as they were no longer studying at Warwick, leaving a total of 96 participants.
The final sample consisted of 69 females (71.9%), 26 males (27.1%), and one person who indicated ‘other’ (1%). Age ranged from 18-56, with an average of 21.42 (SD = 3.69).
The most common subject studied was Psychology (32.3%), followed by History (15.6%). In terms of current grades, most participants reported working at a 2.1 (65.6%). Regarding year at university, 4.2% were in first year; 9.4% in second year; 42.7% in third year; 40.6% in fourth year; and 3.1% were completing masters.
Materials
An online questionnaire was created and delivered via Qualtrics (see Appendix). Participants were first shown a consent form and indicated that they understood what they were about to complete. Demographic information was then gathered, including age; gender; year at university; subject; and current grade.
First, a series of questions were used to collect objective information about the most recent bus journey to university. These questions concerned what time the participant arrived at the bus stop; how long they had to wait for; how long the journey took; whether any buses passed that were full; if they got a seat or had to stand; how crowded the bus was; how many people they travelled with; what the weather was like; and what they were going to university for. For each question, options were selected from a multiple-choice list. These questions were chosen as they were considered relevant factors that differ during a typical student’s journey from Leamington Spa to Warwick University.
In order to collect information about activities completed on the bus, participants were asked to fill in a short textbox describing which activity they spend most of their time doing, and another textbox describing any other activities they engaged in. This was adapted from Ohmori and Harata’s (2008) method in which participants chose activities from a pre-determined list, however it was decided that using a list would be too complicated, as the list would either be too long to read through, or too limited to include every possible option. Instead, responses are to be categorised after collection. Participants were then asked to indicate, on a scale of ‘very unlikely’ to ‘very likely’, whether they would engage in physical activity on the bus, if it became available.
Next, participants rated satisfaction with their bus journey, using St-Louis et al.’s (2008) measure of commuter satisfaction for bus users. This involves participants rating their satisfaction with seven aspects of the journey: travel time; consistency of travel time; comfort; safety from crime and unwanted attention; cost; time to reach stop/station; and waiting time. Respondents responded on a five-point Likert scale from ‘very satisfied’ to ‘very dissatisfied’. This method allows an overall trip satisfaction score to be generated by calculating the sum of each participant’s satisfaction scores as a percentage of the highest possible satisfaction score. This measure was chosen as St-Louis et al. demonstrated that bus users’ satisfaction is influenced by all seven external trip characteristics.
Finally, psychological well-being was measured using Ryff’s (1989) 42-item Psychological Wellbeing Scale. This scale was chosen due to its emphasis on Eudaimonic well-being and achievement of personal development through life events, as these aspects were considered relevant to the current study. The scale measures well-being across each of six dimensions, using an equal number of positively and negatively worded items. The six dimensions are autonomy, environmental mastery, personal growth, positive relations with others, purpose in life, and self-acceptance. Ryff’s original instrument contained 120 items (20 per dimension) but shorter versions exist, comprising of 84 items; 54 items; 42 items; or 18 items. The 42-item version was chosen as a compromise between length and validity. Compared to longer versions, short versions of the scale have been shown to lack construct validity (Van Dierendonck, 2004), and internal consistency (Abbot et al., 2010), therefore it was decided that the 42-item would be suitable.
Procedures
This study had a within-subjects design with two independent and two dependent variables. The independent variables were trip characteristics and commuter activity from the most recent commute between Leamington Spa and the University of Warwick. The dependent variables were satisfaction with the journey, as a percentage out of 100, and overall well-being score, as a score out of 252.
Participants were recruited through anonymous links to friends and classmates; social media posts containing a website link; and a recruitment poster placed in various locations around campus containing a QR code. The questionnaire was completed in the participants’ own time, on their own devices. All procedures were approved by the University of Warwick Psychology Department Research Ethics Committee and conform to standard ethical guidelines as outlined by the BPS.
Participants were shown a consent form prior to commencing the surveys. They learned they were about to complete a short survey as part of a Psychology Undergraduate degree third-year project, consisting of a questionnaire regarding their journey to university, and a questionnaire concerning psychological well-being related to the rest of their day. They were informed that their responses would remain anonymous, and that they could choose not to answer any questions or discontinue participation at any time without their data being saved. Finally, they were informed that their data would be kept for a minimum of 10 years in line with the University of Warwick’s Research Data Management Policy. Participants were provided with contact details of the researchers and were advised to email if they had any questions or if they would like to have their data removed. After completing the survey, a debrief form was shown, and participants had the option of providing an email address to be sent a summary of the results.
Results
Most commuters took the bus at between 7am-8.59am (36.5%) or 9am-10.59am (31.3%); had to wait either 6-10 minutes (33.3%) or 11-15 minutes (30.2%) for the bus to arrive; and took 21-30 minutes (36.5%) to get to university.
Only 26% reported buses pass them that were full; only 16.7% had to stand; and on a scale of 1-10, the mean amount of crowding was 6.27 (SD = 2.72).
Most people travelled alone (71.9%) and were going to university to attend a lecture or seminar (68.8%). Finally, the weather was generally reported as ‘neither pleasant nor unpleasant’ (40.6) or ‘unpleasant’ (39.6%).
Satisfaction
The satisfaction scale was found to be reliable (7 items; α = .68), and responses across each of the seven aspects can be seen in Table 1. Participants were most satisfied with safety, and least satisfied with cost.
Table 1. Percentage of responses for each level of satisfaction across each of the seven trip characteristics.
| Response | |||||
| Trip characteristic | Very Satisfied | Somewhat satisfied | Neutral | Somewhat dissatisfied | Very dissatisfied |
| Travel time | 10.4 | 49.0 | 17.7 | 18.8 | 4.2 |
| Consistency | 7.3 | 32.3 | 18.8 | 29.2 | 12.5 |
| Comfort | 5.2 | 47.9 | 34.4 | 12.5 | 0 |
| Safety | 54.2 | 34.4 | 8.3 | 3.1 | 0 |
| Cost | 4.2 | 19.8 | 18.8 | 40.6 | 16.7 |
| Time to reach stop/station | 16.8 | 43.8 | 14.6 | 24.0 | 1.0 |
| Waiting time | 6.3 | 22.9 | 23.5 | 43.8 | 13.5 |
Overall satisfaction score was calculated as a percentage out of 35, as this was the highest possible satisfaction score across the seven aspects of the journey.
Satisfaction score ranged from 25.71 to 80.00, with a mean of 54.55 (SD = 12.10).
Well-being
The well-being scale was found to be highly reliable (42 items, α = .92).
After reverse coding appropriate questions, a well-being score was calculated for each participant as a total score out of 252. Well-being ranged from 84 to 189, with a mean of 151.85 (SD = 20.34).
Satisfaction and wellbeing
A Pearson product-moment correlation was used to determine the relationship between trip satisfaction and subjective well-being. This is illustrated in Figure 1. There was no significant correlation between these two variables, r(96)= -.01, p > .05.
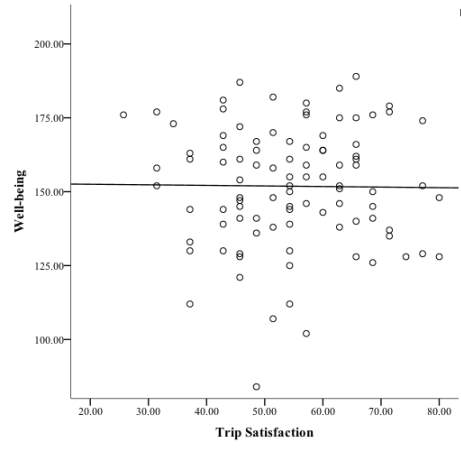
Figure 1. A scatter graph showing the correlation between Trip Satisfaction and Well-being.
Trip characteristics
To investigate the influence of each of the nine objective trip characteristics on satisfaction with the journey, a multiple regression analysis was run. A significant regression equation was found (F(9, 86) = 4.1, p < .000), with an R2of .301, describing how these variables accounted for just over 30% of the variance in trip satisfaction. Only two variables added statistically significantly to the prediction, how long they had to wait for the bus for, (β = .358, p = .002), and how long the bus took to get to university, (β = .303, p = .003).
A further multiple regression was run to predict well-being from each of the nine characteristics of the trip. These variables also significantly predicted trip satisfaction, (F(9,86) = 2.961, p = .004), with an R2of .237, therefore these variables accounted for just over 23% of the variance in subjective well-being. Again, only two variables added statistically significantly to the prediction, whether any buses passed which were full, (β = .277, p = .014), and experience of the weather, (β = .252, p = .011).
Main activities
A total of 14 different activities were reported as the main activity engaged in. The most popular activity to take part in was listening to music (46.9%). The percentage of participants engaging in each activity can be seen in Table 2.
When categorising items as “active” or “passive” it was discovered that some descriptions didn’t provide enough information to be categorised. Therefore, a third category was added which included activities deemed “neutral”, as enough information wasn’t given in order to determine if they were active or passive. These included ‘reading’; ‘browsing the internet’; ‘on my phone’; and ‘social media’. The rest of the activities were categorised as “active” if they are assumed to require mental engagement or “passive” if they are assumed to create feelings of relaxation and disconnection from the environment.
Table 2. Number of participants conducting each activity, by type.
| Activity | n | % | |
| Active | Learning a language | 1 | 1.0 |
| Project work | 1 | 1.0 | |
| Talking/chatting/socializing | 15 | 15.6 | |
| On a phone call | 2 | 2.1 | |
| Replying to emails on phone | 1 | 1.0 | |
| Neutral | Reading | 10 | 10.4 |
| Browsing the internet | 2 | 2.1 | |
| On my phone | 10 | 10.4 | |
| Social media | 5 | 5.2 | |
| Passive | Listening to music | 45 | 46.9 |
| Listening to a podcast | 1 | 1.0 | |
| Watching videos | 1 | 1.0 | |
| Sleeping | 1 | 1.0 | |
| Nothing | 1 | 1.0 | |
| Total | 96 |
Average levels of satisfaction and well-being for each of the three groups can be seen in Table 3.
Table 3. Means and Standard Deviations of Trip Satisfaction and Well-being as a function of Type of Activity.
| Trip Satisfaction | Well-being | ||||
| Type of Activity | n | M | SD | M | SD |
| Passive | 20 | 55.80 | 13.16 | 151.45 | 21.44 |
| Neutral | 27 | 53.86 | 12.79 | 148.81 | 15.26 |
| Active | 49 | 52.43 | 7.83 | 156.95 | 23.40 |
| Total | 96 | 54.55 | 12.10 | 151.85 | 20.34 |
Note. Trip satisfaction is presented as a percentage. Well-being is scored out of 252.
A one-way independent ANOVA was performed to examine the effect of activity type on trip satisfaction. Although trip satisfaction increased as passivity increased (as seen in Figure 2), it was concluded that trip satisfaction for the three groups didn’t differ significantly, F(2, 93) = 0.61, p > .05.
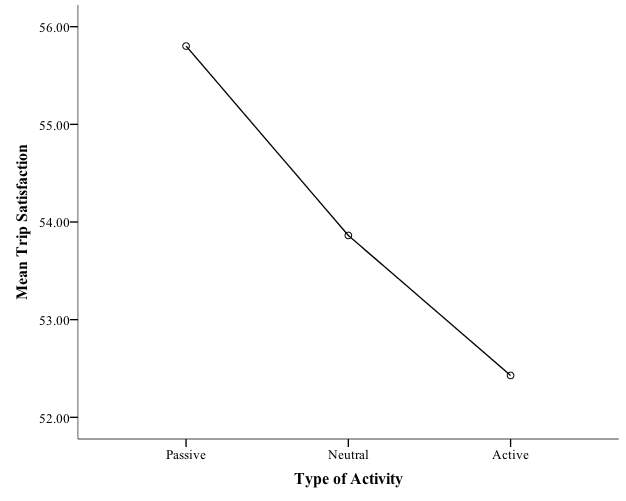
Figure 2. Mean trip satisfaction score as a function of activity type.
A further one-way independent ANOVA was performed to examine the effect of activity type on well-being. Although participants engaging in active activities had higher levels of well-being than those engaging in passive activities (as seen inFigure 3), there was no statistically significant difference in well-being between the three groups, F(2, 93) = 0.94, p > .05.

Figure 3. Mean well-being as a function of activity type.
A one-way ANCOVA revealed there was no main effect of activity type on well-being, even when controlling for trip satisfaction F(2, 92) = 0.92, p > .05. A further one-way ANCOVA revealed no main effect of activity type on satisfaction, even when controlling for well-being F(2, 92) = 0.60, p > .05.
Secondary activity
Of the 96 participants, 72 (75%) reported taking part in at least one secondary activity. Independent sample t-tests revealed that those who took part in more than one activity didn’t differ significantly from those who only took part in one, on either satisfaction (t(94) = -1.04, p > .05), or well-being (t(94) = 0.85, p > .05).
A simple regression analysis revealed that the number of activities conducted was also not significant for either satisfaction (F(1, 94) = .043, p > .05, R2 = .00) or well-being (F(1, 94) = .028, p > .05, R2 = .00).
A total of 89 activities were reported as the secondary activity conducted. These activities were also sorted into active, passive, or neutral, and can be seen in Table 4.
Table 4. Number of participants conducting each activity, by type.
| Activity | n | % | |
| Active | Talking/chatting/socializing | 10 | 11.2 |
| On a phone call | 1 | 1.1 | |
| Replying to emails on phone | 1 | 1.1 | |
| Checked weather | 1 | 1.1 | |
| Planning the day | 3 | 3.4 | |
| Neutral | Reading or writing | 21 | 23.6 |
| Browsing the internet | 1 | 1.1 | |
| On my phone | 11 | 12.5 | |
| Social media | 18 | 20.2 | |
| Doing makeup | 1 | 1.1 | |
| Passive | Listening to music | 11 | 12.5 |
| Listening to audiobooks | 1 | 1.1 | |
| Watching videos | 1 | 1.1 | |
| Drawing on the windows | 1 | 1.1 | |
| Looking out the window | 3 | 3.4 | |
| Charging phone | 1 | 1.1 | |
| Drinking | 1 | 1.1 | |
| Resting | 2 | 2.2 | |
| Total | 89 |
Note. As some participants reported taking part in more than one secondary activity, n=89.
Total productivity scores were calculated for participants who took part in more than one activity, as the sum of the productivity scores (from 1 = passive, to 3 = active) for each activity they took part in. A simple regression analysis revealed that total productivity score was not significant for either satisfaction (F(1, 94) = .040, p > .05, R2 = .00) or well-being (F(1, 94) = .031, p > .05, R2 = .00).
After entering their activities, participants were asked how likely they would be to engage in physical activity on the bus, if it became available. Responses can be seen in Figure 4. Only 4 participants (4.1%) indicated that they would be ‘very likely’ to do so, and the most popular option, answered by 33 participants (34.4%) was ‘unlikely’.
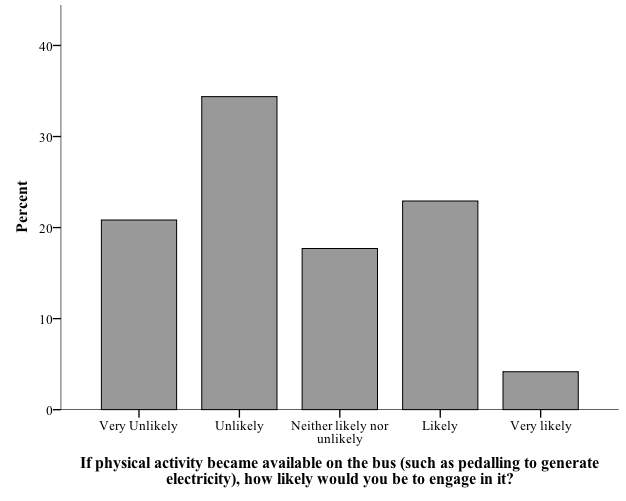
Figure 4. Percentage of responses for each option, for the question “If physical activity became available on the bus (such as pedalling to generate electricity), how likely would you be to engage in it?”
Discussion
Contrary to previous research, trip satisfaction was not found to correlate with, and therefore could not have been a predictor of, subjective well-being. As this is an established finding in the previous literature, it is assumed that the inability to find a significant result was due to lack of power from the limited sample size. Another explanation may be there are other, more important factors that contribute to a student’s well-being than their commute to university, which were not measured in the current study. In terms of behaviour and outcomes, Diener (1984) found social contact, life events, activities and personality to be the main influences on psychological well-being. Of these four predictors, the morning commute falls under ‘activities’; but the impacts of the other three indicators weren’t considered at all. For students, these other factors may have more of an impact than commuting, for example while at university many students place high importance on their social lives. Diener also discussed how each measure of psychological well-being defines the concept differently and assesses different elements of the same construct, therefore results cannot be generalized across studies. It may be that trip satisfaction simply doesn’t have an impact on the six dimensions of psychological well-being that are measured by the scale used in the current study.
Of the nine objective trip characteristics, both how long the participants had to wait for the bus, and how the long the bus took to get to university, were significant predictors of trip satisfaction. This could be explained by student’s high level of time urgency. Landy et al (1991) describe the personality concept of time urgency as referring to an individual’s perception of time, deadlines, and the rate at which tasks must be performed. Those who are time-urgent experience more stress from commuting time pressures, impacting satisfaction with the journey (Lucas & Heady, 2002). Therefore, as students are under high time pressures, a long bus journey impacts trip satisfaction. It is interesting that these were the only two trip characteristics found to have an impact on satisfaction, but it should also be considered that there may also be other trip characteristics that weren’t measured in this study that have an effect, and further research would be needed in this area to identify these. The trip characteristics that were found to significantly predict well-being were whether any buses passed that were full, and experience of the weather. Weather has been frequently found to influence subjective well-being (Connolly, 2012; Feddersen Metcalfe, & Wooden, 2016), but the effect of missing a bus has not previously investigated and could be a basis for future research, as it could be linked to wasted time and missed opportunities, which have been related to decreased well-being (Sagioglou & Greitemeyer, 2014).
It was hypothesised that participating in an activity while travelling would increase trip satisfaction, but as no participants reported not engaging in an activity, it wasn’t possible to compare whether simply engaging in any activity had an effect on satisfaction. In assessing the ways in which different activities affected trip satisfaction, it was found that whether the main activity conducted was active, passive, or neutral had no effect on satisfaction; or well-being. Furthermore, an effect wasn’t found for well-being when controlling for satisfaction, and vice versa. There are possible methodological reasons for these results. Although it was assumed that providing a textbox for participants to describe their activity would eliminate the issue of a list being too limited, many participant’s responses were vague and didn’t provide enough information to be sorted into either “active” or “passive”. For example, many responses simply read “on my phone”, which the researchers decided could be classified as active, if the commuters were using their phones to be productive, such as replying to emails; or as passive, such as if commuters were scrolling through social media to pass the time. Adding a third category of “neutral” provided a way of sorting these responses but meant that the three groups were small and unequal. This issue could have been resolved by conducting a pilot study in order to compile a list of the possible activities, then offering participants options such as “on my phone (for work)” and “on my phone (for leisure)”; similar to a method used by Ohmori and Harata (2008) in order to ask commuters about the purpose of their activities.
The addition of the second textbox for further activities was a useful tool for collecting detailed data on how participants spent their time but also led to the collection of vague responses which had to be sorted subjectively. Results showed that taking part in more than one activity wasn’t significant for either outcome; and neither was the total number of activities conducted. Total productivity scores across all activities conducted were calculated as the sum of the productivity scores (from 1 = passive, to 3 = active) for each activity the participants took part in but was also not a predictor. Methodological issues arise around calculating productivity scores as it wasn’t clear how participants split their time between their main and secondary activities. Although it was assumed that most of their time was spent on the activity they reported as the main one, the more activities they engaged in, the less time was spent on each one, and the less of an effect they would have on satisfaction and well-being. Furthermore, the researchers concluded that ‘productivity score’ is an ambiguous construct that had only been calculated for the purpose of this study and would need further definition and evaluation to be applicable in the real world.
Disengaging activities were not found to have an effect on well-being in students through reversing the effects of stress. The Effort-recovery model (Meijman & Mulder, 1998) describes how recovery activities are needed in order to undo the negative effects of periods of high stress, and although it has been found that engaging in these activities on the weekend improves well-being on Monday (Ragsdale, Beehr, Grebner, & Han, 2011), this study hasn’t shown that recovery activities in the morning have an impact on the rest of the day. Ragsdale et al. suggest that the two stressors linked with effort-recovery in academic settings are quantitative workload and role ambiguity – uncertainty about how to achieve what is expected of them. Carveth, Gesse, and Moss (1996) summarise that academic stress arises from student’s knowledge of their workload, yet the perception of inadequate time to complete it. A limitation of the current study is that it didn’t consider whether students were actually stressed at the time. This could’ve been addressed by including a measure of individual differences in mood, or a measure of student’s workload and role ambiguity, as these are the two constructs associated with student stress and recovery.
The impact of social activity wasn’t considered in this study, and although many students reported talking to friends on the bus, this wasn’t found to correlate with satisfaction or well-being. Ragsdale et al. (2011) suggest that engaging in social activities aid in stress recovery as they provide opportunities to receive social support. Cobb (1976) defined social support as an individual’s perception that they are loved and cared for, and found social support to be protective against the consequences of stress in a variety of situations from low birth weight to depression or alcoholism. Social support is not only protective against stress but also directly increases well-being, as Cohen and Wills (1985) found the correlation to be both due to a main effect, and indirectly as a buffer against stress. When faced with the same stressors, people use different coping mechanisms to handle the stress. Bland, Melton, Welle and Bigham (2012) assessed 29 factors associated with lifestyle habits and coping skills among college students, and found the sole significant protective factor against stress to be the amount of support felt by family, friends, and teachers. Social coping mechanisms can be either approach-orientated, such as approaching the sources of stress by seeking support; or avoidance-orientated, such as avoiding the sources of stress by calling a parent (Suls & Fletcher, 1985). These different ways of using social support as a coping strategy demonstrate why social activities would have such a great impact on stress reduction, and why it would’ve been important to consider its impact in a more detailed manner in the current study.
Although social time might increase well-being for students, in terms of travel satisfaction it has been found to have a negative impact, due to the noise and disruption of passenger’s personal space (Stradling et al., 2007). One way in which individuals create their own sense of private space is through personal music players (Bull, 2005), and the use of technology is another factor which wasn’t specifically considered in this study. Although many students reporting being on their phone, in the context of how productively they were using their time, it was difficult to categorise technology for the current hypotheses. Young people make the most out of personal technology to escape from stressful situations (Skanland, 2011), and it could be argued that there may be a generational gap in its use on public transport, with it being particularly relevant to students, whose generation is constantly connected, entertained, and stimulated (Widerberg, 2006). Technology can be used to connect with others outside the vehicle, increasing the sociality of the journey (Camacho et al., 2017), and Mokhtarian (2003) describes how the development of mobile technologies has removed the problem of travellers not engaging in activities on the bus due to the limited time and space. Furthermore, how travellers use technology depends on what they perceive their time on the bus to be. For example, if they see it as personal time, they might use their phone to listen to music or browse the internet. However, if they see the journey as a chore to be endured, the same activities are used to remove some of the negative affect and discomfort they experience. This evidence highlights how individual subjectivity influences journey experience and perception of satisfaction.
When asked whether they would engage in physical activity on the bus, most participants responded that this would be an unlikely option for them, with only four participants saying they would be very likely to do so. Currently, zero emissions buses are being tested around the world, such as the TU Buscycle in Thailand which requires people pedalling for its power. City tours such as BikeBus in Boston and HIIT workout commutes such as Ride 2 Rebel in London are also a solution to the current global climate, as well as reducing the number of cyclists that are killed or injured in road accidents in cities every day. The current study provides evidence that these types of buses wouldn’t be a popular option at Warwick, so it could be argued that this wouldn’t be the ideal situation in which to test them out for students. Instead, there are other ways to improve sustainability that could be trialled, for example, investing in buses that run on solar power, such as Big Lemon buses in Brighton; CNG vehicles which run on compressed natural gas; hybrid vehicles; or simply encouraging car-sharing. Overall, the researchers argue that there are more long-term improvements that can be made in the realm of public transport other than simply increasing travel time and comfort for passengers.
From the results it is clear that there isn’t one universal, optimal bus journey experience for current students at the University of Warwick. Most use their time to listen to music, but activities range from learning a language, to staring out of the window, and these activities have no significant impact on trip satisfaction or well-being. This is evidence of the individual differences in activities which students find valuable and chose to spend their time doing, and that changing these would not increase the number of people who took the bus, or the well-being of those who did. The only factors found to impact trip satisfaction that the bus company might have some control over were how long the participants had to wait for the bus, and whether any buses passed which were full. Therefore, increasing the frequency of buses from Leamington Spa to the University of Warwick would have a positive effect on student satisfaction and possibly increase the number of students taking the bus. This would have a knock-on effect on sustainability and traffic, improving another factor that was found to be important – how long the bus took to get to university. However, the evidence is only causal and an experimental study to test this relationship wouldn’t be feasible.
This study investigated factors which could improve the daily commute for students at the University of Warwick, in order to improve psychological well-being, as well as impact trip satisfaction and increase the use of the bus. Although trip activities were not found to have an effect, this could be due to methodological issues such as the limited sample size or vagueness of participant’s responses. Future research could focus on investigating factors such as social activities, or use of technology on the bus, in influencing these factors, as these are considered to be specifically relevant for students. The trip characteristics which were found to have an effect could be influenced by infrastructure changes from the companies, especially as recently, the focus for bus operators has shifted from simply offering a sufficient service, to a service with higher quality and customer satisfaction levels. However, Clayton, Jain, & Parkhurst raise the issue of responsibility – bus operator’s main objective is to get passengers to a destination on time, so how concerned should they need to be with the well-being of university students at the expense of the money and effort it takes to improve their service? To resolve this concern, Clayton et al. discuss the concept of bus companies creating their own “Unique Selling Point” of the bus, which allows them to compete with other companies and creates more business and profit, as well as aiding in long-term efforts to increase the use of the bus for sustainability reasons. Although increasing speed and frequency of the buses would increase commuter’s trip satisfaction, more research is needed into which factor increase the quality of the journey for university student’s commutes.
Cite This Work
To export a reference to this article please select a referencing stye below:
Related Services
View all


Related Content
All TagsContent relating to: "Psychology"
Psychology is the study of human behaviour and the mind, taking into account external factors, experiences, social influences and other factors. Psychologists set out to understand the mind of humans, exploring how different factors can contribute to behaviour, thoughts, and feelings.
Related Articles

DMCA / Removal Request
If you are the original writer of this dissertation and no longer wish to have your work published on the UKDiss.com website then please: