Condition Monitoring and Fault Detection Tool for Gearbox Systems
Info: 8124 words (32 pages) Dissertation
Published: 13th Dec 2019
Tagged: Engineering
A vibration based Condition monitoring and fault detection tool for gearbox systems using advanced signal processing techniques
Abstract
A vibration based condition monitoring tool has been developed using Labview 2015. The tool makes use of advanced signal processing techniques to monitor and indicate defects in two-stage spur gearbox. A review of commonly used signal processing techniques for gearbox fault diagnosis is presented. Several condition indicators have been developed for unbalanced shafts, broken and eccentric gears and defects in inner race, outer race and rollers within rolling element bearings. The effectiveness of the tool has been evaluated using vibration data acquired from a two-stage gearbox and provided by Prognostics and Health Management (PHM) society.
Acknowledgements – Labview team, Faris Elasha, Rolls-Royce, Joao
Machines play a crucial role in modern world.
It has been reported that UK companies spend three times as much each year maintaining existing plants and machinery as they do in replacing it. This is a high maintenance bill, and much of the cost of meeting it is wasted (hand book of condition monitoring). Maintenance costs manufacturing companies around 5 percent of the yearly turnover. Yet the assets are available only 40 percent of the time(hand book of condition monitoring). If the companies are to achieve and sustain a competitive advantage, an effective maintenance strategy of the assets cannot be ignored. As the industrial process and the machines involved become more sophisticated, the impact of poor maintenance choices becomes even bigger, causing significant decline in efficiency of the business.
Machinery maintenance strategies can be mainly categorised in to reactive maintenance, preventative maintenance and predictive maintenance[practical machinery vibration analysis and predictive maintenance]. Reactive maintenance is basically running the machine to failure. The major drawback of this strategy is quite obvious; the cost to repair or replace the failed equipment is typically much higher than if the problem was detected and fixed earlier. Not to mention the lost revenue due to unplanned downtime. A preventive strategy assumes equipment is relatively reliable until, after some period of time, it enters a wear out zone where failures increase. While preventive maintenance strategy (i.e. scheduled maintenance activities) has been in use for quite some time now, it does have its drawbacks. This maintenance approach does not allow end-users to fully benefit from the machine’s capability and operational life. Performing scheduled maintenance can be too early and sometimes even too late. Even worse, it may introduce failures to the machine during the maintenance activities. The third strategy, predictive maintenance, overcomes these drawbacks by constantly monitoring actual equipment condition and using the information to predict when a problem is likely to occur. The maintenance can then be scheduled for the equipment that needs it before the problem affects process or equipment performance. Condition based maintenance (CBM) is a great way to improve maintenance productivity, as well as reduce costs for repairs and unexpected downtime. A best-practices plant uses CBM for most equipment where condition-monitoring is practical, limiting reactive and preventive strategies to equipment that is not process-critical and will cause little or no collateral damage if run to failure.
CBM uses various techniques such as vibration monitoring, acoustic emissions, particle analysis, oil analysis, thermography and ultrasonic measurements to evaluate the condition of the machine [practical machinery vibration analysis and predictive maintenance].
Vibration analsyis
Vibration analysis has the advantage of identifying potential or developing faults before they become too serious and result in equipment breakdown [hand book of condition monitoring]. All rotating machines produce vibrations. These vibrations are a function of design, configuration and state of the machine. In practice, a machine with no faults will have a vibration signature, “normal” signature, based on its system dynamics and forces acting on the system. Different mechanical faults in different components will display different vibration signatures that can be differentiated from the “normal” signature, with the utilization of the proper signal processing techniques. Vibration monitoring is capable of detecting misalignment and unbalance in rotating shafts, broken or worn gears and defects in bearings.
A vibration based condition monitoring system typically consists of a vibration sensor, data acquisition hardware, a computer to store the data and an analysis software. The transducers convert vibration in to electronic signals. Most commonly used vibration transducers are accelerometers, velocity pickups and eddy current or proximity probes. The data acquisition hardware includes electronics to convert the analogue signal from the transducers in to digital signal. It also ensures that the data is sampled at an appropriate sampling frequency, depending upon the characteristics of the machine being monitored. The data is then stored in to a computer where an analysis software is used to extract useful information about the machine condition.
Vibration based signal processing techniques (Methodology)
Signal processing techniques for feature extraction
Time domain
TSA
Synchronus average vibration spectrum (normal spectrum analysis?)
Diagnosis and health assessment of rotary machinery using vibration signals from the machine has been a domain of interest for many years. Prior to a total failure, degradation and incipient level of damage in components of the machinery can demonstrate behavioral features hidden within the vibration signals. One of the main challenges in diagnosis and health assessment of rotary machinery is the potentiality of the machine or equipment to operate in a multitude of regimes, and thus their vibration behavior will be different in each regime. Another, challenge is that the “normal” vibration signature from every operating regime might not be available for prior training.
Over the years, several basic and relatively sophisticated signal processing techniques have been introduced to extract the features of defects in gearbox systems from vibration signals. These techniques can be divided into two main different processing groups i.e. Time and frequency Analysis. Time domain analysis involves computing statistical features of signal including mean, root mean square (RMS), standard deviation, variance, kurtosis, crest factor and skewness. The frequency domain analysis involves computing spectrum by performing Fourier transform on the time domain signal. The spectrum of a signal shows all the frequencies present in a signal. The frequencies of interest can then be detected to indicate a particular machine fault. The real life signals
In time domain, statistical features of an acquired vibration signal can be computed for diagnosing damage in the gearbox. These include root-mean-square (RMS) level, Crest factor, and shock pulse counting (Tandon, N., 1994, ‘‘A Compassion of Some Vibration Parameters for the Condition Monitoring of Rolling Element Bearings,’’ Measurement, 12, pp. 285–289)
All conditions indicators developed in this project involve a use of analysis algorithms to enhance the fault signatures from each component i.e. shafts, bearings and gears. The statistical features of the enhanced signals are then computed to indicate a general fault. Furthermore the increase of peaks, as compared to a reference signal, at characteristic frequencies of bearing and gear mesh frequencies are used to indicate specific faults. The analysis algorithms used include demodulation of amplitude modulated signal, extraction of residual signal of interest using analysis algorithms for each consists of combining analysis algorithms with statistical features are mainly based a combination of feature extraction using and upon extracting features of interest using analysis algorithms for different components and then using statistical features
Vibration based condition monitoring of gearbox
Review of Signal processing techniques
The fundamental aim of signal processing from condition monitoring point of view is to manipulate the signal obtained from vibration transducer(s) and extract useful information related to the machine. The raw signal from the sensor will include vibrations from all components within the machine e.g. shafts, gears and bearings in the case of a gearbox. The aim of signal processing is to separate the vibration signatures produced by each of these components and perform some analysis to determine their health. In practical vibration based condition monitoring, multiple signal processing techniques are used in combination to develop effective and reliable condition indicators (CI) for individual machine components.
A discussion of some commonly used signal processing techniques for transmission systems is presented in this section. These are also the technique used to develop the condition monitoring tool in this project.
Signal de-noising
A vibration transducer such as an accelerometer attached to a machine will pick up vibrations from several sources. These include the vibration signatures produced by the machine components as well as the ambient noise. The effect of the noise on the signal is even more prominent when there are other machines operating in vicinity of the machine being monitored. Therefore the recorded signal will contain both the machine fault information and the noise. Due to this reason, performing analysis on raw signal will not result in meaningful conclusions. Following techniques are commonly used for de-noising a raw signal
- Time synchronous averaging (TSA)
- Wavelet de-noising
Time Synchronous Averaging (TSA)
Time synchronous averaging is a procedure that allows the removal of non-stationary component noise from a vibration signal [100, 101]. It is well suited for gearbox analysis where it allows the vibration signature of the gear under analysis to be separated from other gears and noise sources that are not synchronous with that gear. Time synchronous average resamples the vibration data synchronously with a shaft, and is the basis of numerous gear and shaft condition indicator (CI) algorithms[A Review of Time Synchronous Average Algorithms].
The basis of TSA is that all vibration related to gears on the shaft will repeat periodically with shaft rotation. By dividing the vibration signal into adjacent segments, each the same length as the shaft period and ensemble averaging a sufficiently large number of segments, the vibration which is periodic with shaft rotation will be enhanced and other components will cancel out. This then results in a signal which represents the average vibration for one revolution of the shaft [102]. This technique is used to represent the time-domain of the vibration signal produced by the meshing of the gear teeth over one complete revolution. TSA is often used for analyzing signal from a machine with multiple shafts that are rotating at different speeds, such as a gearbox. Rotor related vibration problems such as unbalance, misalignment as well as gear related faults are retained in the TSA vibration signal. Whilst the non-synchronus defects such as bearing faults are effectively averaged out [signal processing, applications book]
TSA requires a tachometer signal. The pulses from the tachometer are used to segment the data. These segments are then ensemble averaged to obtain a time waveform that is synchronous to the shaft rotation. This process is shown in figurexx
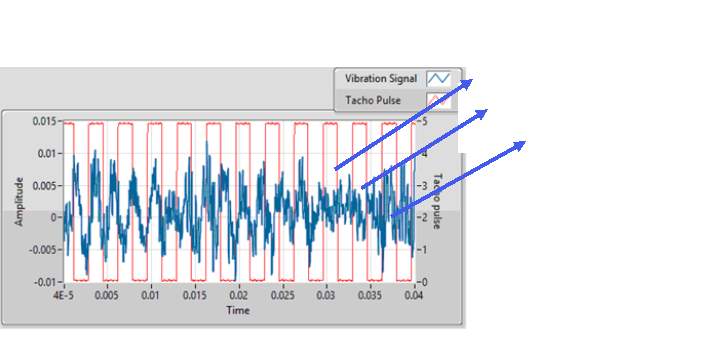
Figure 1 TSA process
Wavelet de-noising
Time Waveform Analysis
Time waveform is one of the simplest ways to analyze a signal. It is the representation of a signal in time domain. The vibration amplitudes are plotted on y-axis against the time intervals on x-axis. Time domain approach is appropriate when periodic vibration is observed and faults produce wideband frequencies due to periodic impulses [18]. Use of the waveform enables changes in the vibration signature caused by faults to be detected, but it is difficult to diagnose the source of faults. Figurexx shows the gearbox vibration waveform for healthy and faulty gear systems.
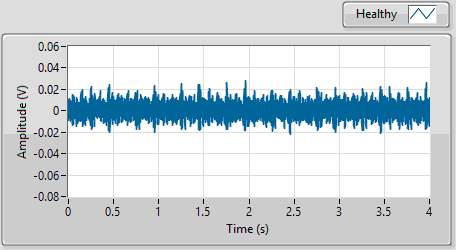
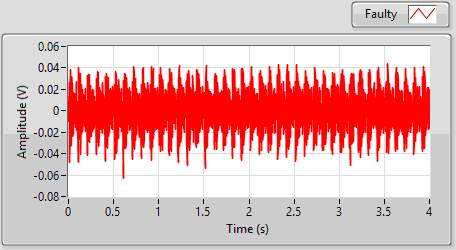
Figure 2 Time waveforms signals from healthy (left) and faulty gearbox (right)
The statistical features of a time waveform are commonly computed and used for mechanical fault detection. These statistical features can be either computed for time waveform of raw signal to indicate general fault in the gearbox or for a time wave form extracted using some analysis algorithm to identify faulty components. The statistical features include root mean square (RMS), kurtosis, crest factor, skewness, peak, peak to peak etc. [Fault indicator – Faris]
Root Mean Square (RMS)
Root mean squared characterizes the energy content of the signal. [Fault indicator – Faris]. It is mainly used to track general fault progression in a machine as it is not very sensitive to incipient fault [Vecer, P., Kreidl, M., &Smid, R. (2005), Condition Indicators for Gearbox Condition Monitoring Systems. ACTA Polytechnica. Vol. 45, No. 6, pp. 35 – 43.] RMS can be computed as follows
RMS=1N∑i=1Nsi2
Where
N is the number of data points in a dataset “s”
si
is the i-th member of points in dataset “s”
Peak
Peak is simply the highest value of amplitude present in a signal.
Peak to peak
Peak to peak is the difference between the values of maximum and minimum amplitudes present within a signal of certain time interval.
Speak-peak=Smax-Smin
Kurtosis
In statistics, kurtosis is measure of how peaked of flat a distribution is. A normal or Gaussian distribution has kurtosis of 3. In signal processing it is used to describe the shape of amplitudes distribution within a signal. A signal with a kurtosis higher than 3 has relatively sharp peaks. Kurtosis can be calculated as follows [Faris conference paper]
Kurtosis=∑i=1n(x-μ)4*4σ4
Where
μ
is the mean of the signal
σ
is the standard deviation
Skewness
In statistics skewness is a measure of symmetry of a distribution. In signal processing it describes the symmetry of amplitudes distribution within a time domain signal. A time series with an equal number of large and small amplitude values will have a skewness of zero. Skewness can be calculated as follow [Faris indicators]
N.∑i=1Nsi-s̅3∑i=1Nsi-s̅23
Where
N is the number of data points in a dataset “s”
si
is the i-th member of points in dataset “s”
Crest Factor
Crest factor is the ratio of peak value of the signal to its RMS value. It indicates the damage in early stages [Vecer]. Mathematically
Crest Factor=SpeakRMS
Where
Speak
is the peak value of the signal
Crest factor value is normally between 2 to 6. A value greater than 6 indicates possible machine failure [Faris incdicators]
Spectral analysis
Spectral (or frequency) analysis is a term used to describe the analysis of the frequency domain representation of a signal. Spectral analysis is the most commonly used vibration analysis technique for condition monitoring in geared transmission systems and has proved to be a valuable tool for detection and basic diagnosis of faults in simple rotating machinery [Dalpiaz .G el al, “Gear fault monitoring comparison of vibration analysis techniques”, Italian National Research Council, pp 623-632.] It has been found that the spectral content of the measured signal is often much more useful than the time domain for determining gear condition because the complex time-domain signal can be broken down into several frequency components. It is therefore easy for analysts to focus on these frequencies which are valuable in fault diagnosis [Forrester, B. D., Advanced Vibration analysis Techniques for Fault Detection and Diagnosis in Geared Transmission Systems. PhD Thesis, Swinburne University of Technology, Melbourne, 1996]. Whereas the overall vibration is a measure of the vibration produced over a broadband of frequencies; the spectrum is a measure of the vibrations over a large number of discrete contiguous narrow frequency bands
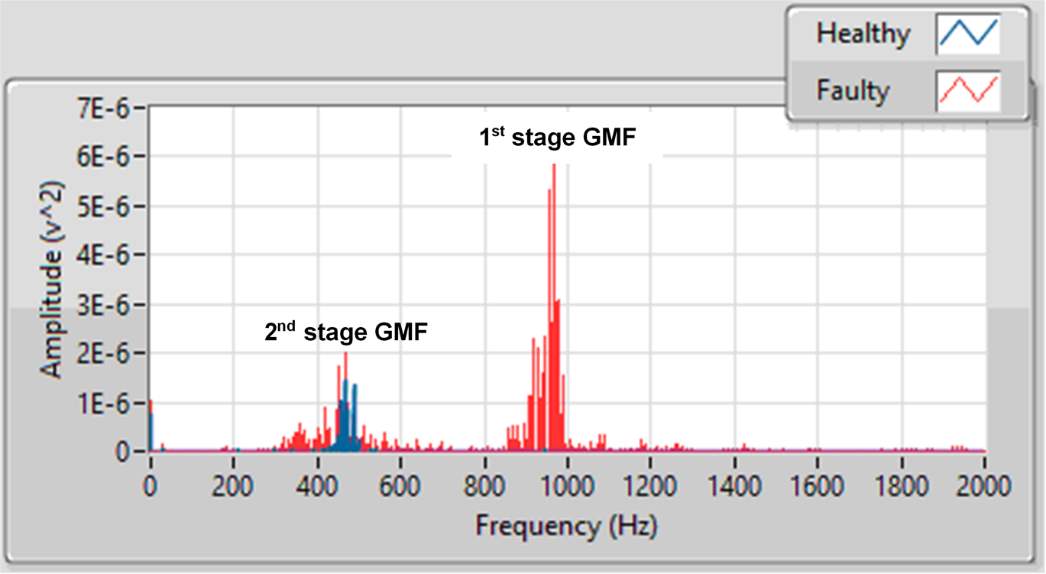
The fundamental process common to all spectral analysis techniques is the conversion of a time domain representation of the vibration signal into a frequency domain representation. This can be achieved by the use of Discrete Fourier Transform (DFT) or Fast Fourier Transform (FFT). The FFT is just an efficient and faster algorithm to compute DFT. Figurexx shows power spectrum of a healthy and faulty two-stage gearbox signals. The spectrum is zoomed in to display the 1st and 2nd stage gear mesh frequencies of 960Hz and 480Hz respectively.
Order Analysis
Order analysis is a technique for analyzing vibration signals in rotating or reciprocating machinery. Gearbox systems have a variety of mechanical parts such as shafts, bearings and gears. Each mechanical part contributes a unique component to the overall machine vibrations signal. When performing vibration analysis many vibration signal features are directly related to the running speed of a machine such as imbalance, misalignment, gear mesh, and bearing defects. Most rotating machinery operates under continuously changing rotational speeds. This significantly complicates the classical spectrum analysis of vibration signals with constant sampling frequency. This is due to the fact that the signal frequency components, which are proportional to the rotational speed, change position in the spectrum and cause spectrum smearing.
Order analysis is a type of analysis geared specifically towards the analysis of rotating machinery and how frequencies change as the rotational speed of the machine changes. It resamples raw signals from the time domain into the angular domain, aligning the signal with the angular position of the machine. This negates the effect of changing frequencies on the FFT algorithm, which normally cannot handle such phenomena[VIBRATION ANALYSIS TECHNIQUES FOR GEARBOX DIAGNOSTIC: A REVIEW].
Order analysis is performed using a reference signal from the rotational shaft of interest [Jason R. B., Improving the Analysis of Operating Data on Rotating Automotive Components, PhD Thesis, University of Cincinnati Dec.1990.]. This signal can be obtained using an appropriate tachometer coupled to that shaft. The sampling of the data from vibration transducer is synchronized with the tachometer pulses.
Envelope Analysis
The envelope analysis or demodulation is an important tool for gearbox fault detection. It involves demodulation of an amplitude modulated (AM) signal. The raw vibration signals acquired from a gearbox are often amplitude modulated. This modulation occurs due to the presence of gears and bearing faults. For example, when a gear has a local fault, the vibration signal of the gearbox may contain amplitude and phase modulations that are periodic with the rotation frequency of the gear known as gear mesh frequency (GMF). The modulation of the meshing frequency, as a result of faulty teeth, generates sidebands in the spectrum, which are frequency components equally spaced around a centre frequency. Figurexx shows an AM signal and its envelope.
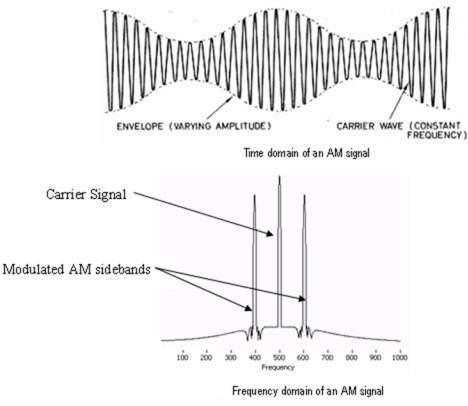
A spectrum of an AM signal typically contains equally spaced sidebands on the either side of a carrier frequency. The difference between the center frequency and the side bands is equal to the modulating frequency as shown in figurexx. The centre frequency called the carrier frequency maybe the gear mesh frequency, multiples of bearing ball pass frequency, resonant frequency of a machine component/structure, or the resonant frequency of an accelerometer. Sidebands are either the shaft rotational speed or one of its multiples[Gearbox fault detection using Hilbert and wavelet packet transform]. The increase in the number and the amplitude of such sidebands often indicates faulty conditions [G. Dalpiaz, A. Rivola, R. Rubini, Effectiveness and sensitivity of vibration processing techniques for local fault detection in gears,Mechanical System and Signal Processing 14 (3) (2000) 387–412.]
Since modulating frequencies are caused by certain faults of gearbox components including gears, bearings, and shafts, the detection of the modulating signal is very useful to detect gearbox faults. The process of restoring the modulating signal that is mixed with a carrier signal is called demodulation or enveloping. The envelope of an AM signal can be acquired by Hilbert transform. Hilbert transform is defined as [A. Carcaterra, A. Sestieri, Complex envelope analysis: a quasi-static approach to vibrations, Journal of Sound and Vibration 201 (2) (1997) 205–233.]
Hxt=1π∫-∞∞x(t)t-τdτ
Where “t” is time, x(t) is a time domain signal and H[x(t)]is the Hilbert transform of x(t).
Difference/Residual signal
Residual Analysis
The residual analysis involves removing certain frequencies from the raw signal. The residual analysis algorithm varies depending upon the information that is required to be obtained or removed. The residual signal for a gear can be calculated by removing the shaft harmonics and the gear mesh frequency and harmonics from the time synchronous average signal [Faris indicators]. The statistical features of the residual signal can be computed to develop condition indicators sensitive to a particular fault.
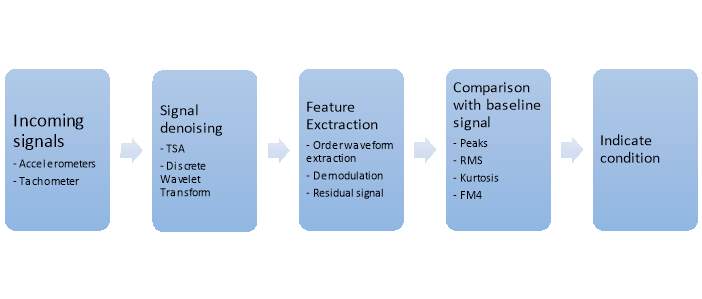
Development of condition monitoring tool
The condition monitoring tool was developed using LabVIEW 2015. LabVIEW (Laboratory Virtual Instrument Engineering Workbench) is a graphical program development environment. It is commonly used for data acquisition, instrument control and industrial automation. It contains powerful tools that allow integration of instruments, hardware communications such as data acquisition cards and the signal processing algorithms. LabVIEW has several toolkits that contain built in virtual instruments (VIs) allowing development of sophisticated algorithms for advanced signal processing of vibration data. The condition monitoring tool developed in this project takes advantage of several of these signal processing VIs to perform tachometer signal processing, order analysis, computation of defect frequencies, envelope detection, peak search etc. to name a few.
Overview
The algorithm takes signals from two accelerometers, one each from input and output sides of the gearbox. This allows locating the exact bearing within the gearbox that is producing the fault signal as the vibrations captured by the accelerometer located on the defective bearing side might be more severe. The fundamental methodology in the algorithm to detect and indicate all faults is based upon comparing the current state of the gearbox with a signal obtained from the same gearbox in healthy state. Therefore algorithm also takes two accelerometer inputs for a baseline or healthy signal. Similarly algorithm takes two tachometer signals to specify speed profile of input shaft for healthy and current states. This allows correct computation of TSA of the signals, gear mesh frequencies, bearing characteristic frequencies and order analysis. Appropriate gear ratios are also applied for correct computation of speeds of input, idle and output shafts. The basic methodology is shown in figurexx
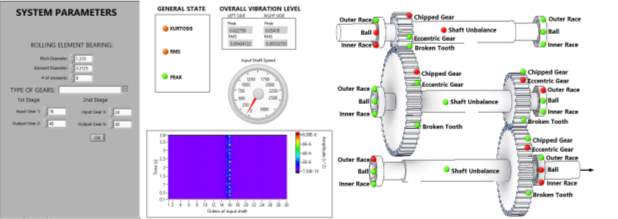
One of the aims while developing the tool was to provide an interface that is easy to use, requires minimal input and displays the most relevant information first in an easily understood manner. The front panel was designed keeping this in mind. Figurexx shows the front panel of the tool. It requires the user to specify geometric parameters of gearbox components i.e. gear teeth, pitch diameter, roller diameter and number of rolling elements within the bearings. These parameters are used by the algorithm to compute characteristic frequencies of gears and bearings. The front panel includes individual indicators for all components, placed on a schematic of the gearbox to provide quick and easy visual of the state of each component. It also displays indicators for overall gearbox vibration levels as well as a color map of the order spectrum. The colormap allows the user to visually identify the most dominant order present within the overall incoming vibration signal. This can be very useful to identify the component(s) causing high vibrations.
Vibration data for tool development
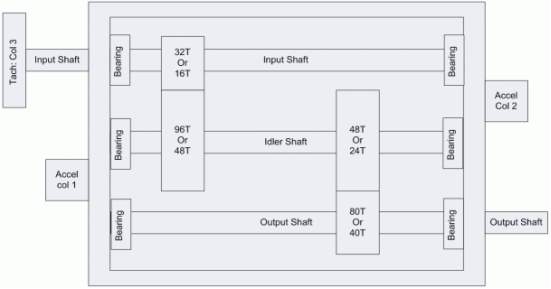
The vibration data used for the development and evaluation of the condition monitoring tool was provided by PHM society. The data was acquired from two-stage gearbox that consisted of 3 shafts, 4 gears and 6 bearings. The data acquisition system included two Endevco accelerometers with a sensitivity of 10 mv/g and resonance greater than 45 kHz. The data from two accelerometers was sampled synchronously with a sampling frequency of 66,666.67 Hz. It also included signals from a tachometer attached to the input shaft generating 10 pulses per revolution [project brief]. A schematic of the two-stage gearbox is shown in figurexx [performance predicting model].
The provided dataset consisted of data from the gearbox tested under different operating condition as well as under different conditions of mechanical components i.e. shafts, gears and bearings. The dataset was segmented based on 5 different input shaft speeds (30, 35, 40, 45 and 50 Hz), high and low loadings and the conditions of mechanical components. Tablexx [project brief] shows the data classification in to case numbers based upon the condition of mechanical components.
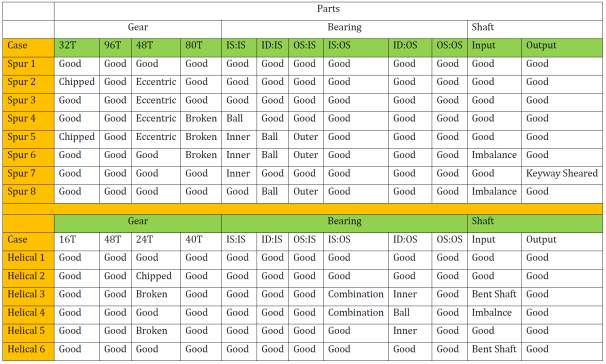
As shown in data key “Case 1” contains no faults, therefore the signals associated to this case were taken as baseline in the algorithm.
The data was acquired from two different configurations of the gearbox i.e. spur and helical gears. This report focuses on the algorithm evaluated using spur gear configuration only. However the same algorithm can be applied to a helical gearbox also. The parameters of the components are as follow
Gears (spur gears configuration)
No. of teeth on input shaft pinion = 32
No. of teeth on idler shaft 1st stage gear = 96
No. of teeth on idler shaft 2nd stage gear = 48
No. of teeth on output shaft gear = 80
Therefore
Gear ratio=3296×4880=5 to 1 reduction
Bearings
Bearing locations are identified based upon the input or output side of the gearbox as well as the shaft supported by the bearing. Following terminology is used for locating bearings in the data key
IS:IS is denoting Input shaft bearing located on the input side
IS:OS is denote Input shaft bearing located on the output side
ID:IS is denoting Idle shaft bearing located on the input side
ID:OS is denote idle shaft bearing located on the output side
OS:IS is denoting output shaft bearing located on the input side
OS:OS is denote output shaft bearing located on the output side
All the bearings were similar with the following geometric parameters
Number of rolling elements = 8
Rolling element diameter = 0.3125”
Pitch diameter = 1.319”
Contact angle = 0°
General condition indicators
The general indicators were developed to indicate overall health of the gearbox.
Statistical Features
RMS and peak values of raw signals for both the baseline and current state were computed and compared to indicate the overall condition of gearbox.
Order spectrum colormap
A colormap of the order spectrum was used to identify the most dominant orders present within the raw signal. This provides a great visual of overall vibration levels and helps to identify components with the incipient faults.
Tablexx shows characteristic frequencies of gearbox components as orders of the input shaft.
| Characteristic Frequencies | Orders of Input Shaft |
| Input shaft frequency | 1 |
| Idler shaft frequency | 0.33 |
| Output shaft frequency | 0.2 |
| 1st stage GMF | 32 |
| 2nd stage GMF | 16 |
| BPFO input shaft | 3.052 |
| BPFI input shaft | 4.947 |
| BSF input shaft | 1.992 |
| BPFO idler shaft | 1.0173 |
| BPFI idler shaft | 1.649 |
| BSF idler shaft | 0.664 |
| BPFO output shaft | 0.6104 |
| BPFI output shaft | 0.9894 |
| BSF output shaft | 0.3984 |
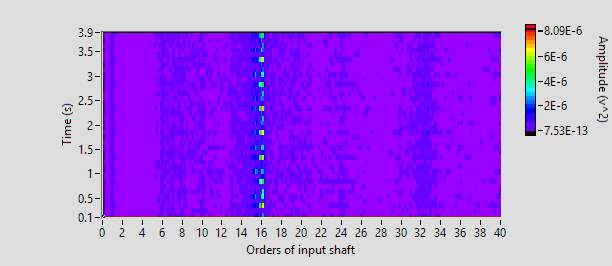
Figurexx shows order colormap of signal from case 6. As shown in the data key, case 6 contains signature from broken tooth of a 2nd stage gear. As it can be seen in figurexx 16th order is the most dominant order in the order spectrum which corresponds to 2nd stage gear mesh frequency
Time Synchronous Average Algorithm
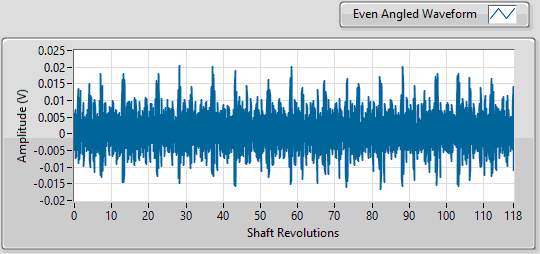
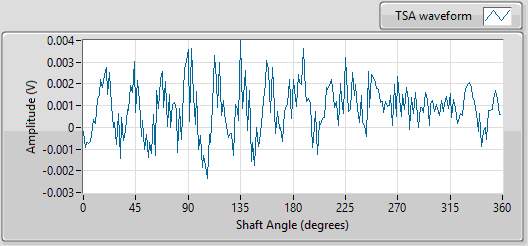
The raw signal sampled by the accelerometer is evenly spaced in time. The TSA in LabVIEW was achieved by converting the signal in to evenly spaced shaft angles. For example in case of 30Hz shaft speed, the algorithm identified 118 complete revolutions in approximately 4 seconds block of signal as shown in figurexx. The algorithm then averages the vibrations at each angle for total number of revolutions present in the signal. The TSA of vibration signal from case 1 at 30Hz input shaft speed is shown in fgurexx.
Shafts condition indicators
Vibration due to unbalance of a rotor is probably the most common machinery fault [Practical machinery vibration book]. The unbalance in shafts is caused by uneven distribution of mass along their rotational centerline. Due to this the rotational centerline does not coincide with the geometric centerline of the shaft. Mass unbalance in a rotating system often produces excessive synchronous forces that reduce the life span of various mechanical elements. A very small amount of unbalance may cause severe problem in high speed rotating machines such as gearbox[shaft unbalance]. The unbalance can be present due to number of reasons e.g. manufacturing errors, non-uniform density of material and gain or loss of material during operation.
An unbalanced shaft produces vibrations that are synchronous to its rotational frequency. A vibration spectrum obtained from an unbalanced shaft will display an increasing peak at 1x shaft speed as the unbalance increases. However for this specific gearbox, the peak at 1xrpm also overlaps with the peaks at the characteristic bearing fault frequencies; in particular the BPFO of the bearings on the idler shaft (1.017xrpm of input shaft) and the BPFI of the bearings on the output shaft (0.9894xrpm of input shaft). So, a high amplitude peak at 1xrpm of input shaft could be caused by either of these problems. The developed indicators are as follows:
Peak at fundamental shaft frequency
The process flow of algorithm for this indicator is shown in figurexx. . As discussed above, some of the bearing characteristic frequencies overlap with the input shaft fundamental frequency. The TSA algorithm removes the non-synchronous components in the signal such as bearing fault frequencies. Therefore the raw signal is first de-noised using TSA. The peak at 1x is then determined and compared with the equivalently processed healthy signal to indicate the health of shafts.
RMS of 1x extracted waveform
The process flow of this indicator is shown in figurexxx. The raw waveform is processed through the order waveform extraction VI in Labview. This VI allows the extraction of waveform of specified order. For input shaft unbalance the 1st order waverform was extracted. The RMS of the extracted waveform is then computed and compared with the baseline signal to indicate shaft health.
Results
The “peak at 1x” indicator was tested on all cases. It was able to successfully identify shaft unbalance in all signals containing input shaft imbalance i.e. cases 6 and 8 as specified in data key in tablexx. However it was noted that this condition indicator indicated faults even for the cases, which according to the data key, did not contain shaft imbalance. Upon further inspection it was revealed that the peak at 1x increases by up to 250% in shaft imbalance specified cases. Therefore the algorithm requires a peak increase criteria to be set in order to correctly indicate fault. There was no literature found that sets any limits on amount of peak increase before the fault is indicated. This criteria will therefore mainly depend upon the type of machine that the tool will be implemented on, machine tolerances and the company’s experience.
Figurexx andxx show the extracted 1st order waveform and power spectrum respectively for 50Hz input shaft speed. As it can be seen in the power spectrum of extracted waveform in figurexx, only the waveform containing shaft rotational frequency is extracted.
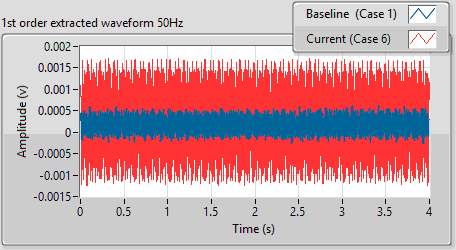
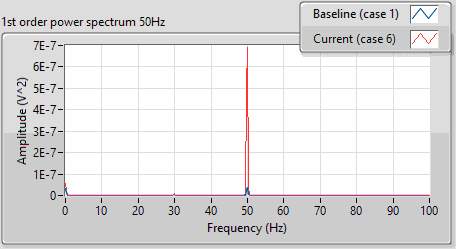
The RMS values of extracted waveforms are given in tablexx. As shown in the data key, cases 6 and 8 contained input shaft imbalance. The data containing input shaft imbalance signals i.e. cases 6 and 8, was available only for 30Hz and 50 Hz shaft speeds. This CI was able to identify unbalance in all specified cases.
| RMS Values of 1st order waveform | |||
| Input shaft sped | Case 1 (baseline) | Case 6 | Case 8 |
| 30 Hz | 3.08E-04 | 6.34E-04 | 7.15E-04 |
| 50 Hz | 2.82E-04 | 9.46E-04 | 5.19E-04 |
Bearings condition indicators
Rolling bearing elements are one of the most essential parts in rotating machinery. They often operate under severe conditions and are subjected to high stresses. Their integrity becomes an issue particularly in key machinery. A machine could be seriously damaged if defects occur to those rolling element bearings during service. Early detection of the defects, therefore, is crucial for the prevention of damage and secondary damage to other parts of a machine or even a total failure of the associated large system can be triggered. The bearing defects are typically caused by insufficient/contaminated lubrication, poor installation, excessive vibration due to manufacturing defects and normal wear [uni notes]. The rolling element bearings consist of inner race, out race, rolling elements and a cage. The common defects in the rolling element bearings include indentation in inner race, damaged rollers, spalling of outer race and fractured cage.
For decades, bearing-condition monitoring using associated vibration signals has received considerable attention. Most diagnostic techniques for rolling element bearings entail signature analysis of vibration signals from accelerometers mounted on the bearing housing or close-by machine casing. In recent years, several basic and relatively sophisticated signal processing techniques have been introduced to extract the features of defects in rolling element bearings from vibration signals[dong’s paper].
Rolling Element Bearing Characteristic Frequencies
Damaged components within the bearings produce vibration signatures at certain frequencies called defect or characteristic frequencies. These frequencies are a function the rotational speed and geometric parameters of the bearing. These are
- Ball pass frequency of inner race (BPFI)
- Ball pass frequency of outer race (BPFO)
- Ball spin frequency (BSF)
- Fundamental train frequency (FTF)
Mathematically
BPFI=0.5zf1+dDcosα
BPFO=0.5zf1-dDcosα
BSF=0.5fDd1-dDcosα2
FTF=0.5f1-dDcosα
Where “f” is rotational speed of the shaft, “z” is the number of rollers, “d” is the diameter of rollers, “D” is the pitch diameter and α is the contact angle.
Wavelet de-noising
The characteristic frequencies in real life signals may differ from the calculated ones by 1 to 2%. This is due to the fact that calculations do not take in to account some degree of slip of rolling elements during operation. Nonetheless, this slip is what makes it possible to separate the vibration signals derived from bearings from those derived from shafts and gears of gearboxes. The latter are known as the deterministic components of the vibration signal, whilst the frequency components from bearings are known as the non-deterministic components [Faris conference paper]. Discrete Wavelet transform is a very efficient tool to separate the non-deterministic component from the signal.
Signal demodulation
The vibrations generated by the bearing defects are in form of short impulses. These impulses are generated as the defected rolling elements or the inner/outer race surface come in to contact with each other. The energy of these impulses is relatively low and distributed over a wide frequency range [conference paper]. Furthermore, presence of noise in the signal makes it even more difficult to detect these defects in the spectrum of raw signal. Due to this reason, more sophisticated signal processing techniques are required for bearing faults detection. The envelope demodulation technique has become a very efficient and popular technique and has been employed to detect the characteristic frequencies of defected bearings. In general, the traditional envelope detection contains two steps. First, the vibration signal is filtered around one of the resonant frequencies. Second, the above band-pass filtered signal is demodulated by an envelope detector to extract the characteristic frequency of defect from the carrier frequency. In order to get satisfactory results, the envelope detectors have to select a resonant frequency band in which the impulsive components excited by defects are dominant. However, it is difficult to predict or specify which resonant modes of neighboring structures will be excited. Especially, it will be costly and unrealistic in practice to find the resonant modes through experiments on rotating machinery that may alter in different operational conditions. In addition, it is also difficult to estimate how these resonant modes are affected on assembly into a full bearing and mounting in a specific housing, even if the resonant frequencies of individual bearing elements can be tested or calculated theoretically[dong’s paper].
Spectral Kurtosis for optimum band specification
In time domain signal, the amplitude distribution of a bearing in perfect condition is Gaussian. Whereas damage in a bearing leads to a distribution with dominant tails[Dyer, D., and Stewart, R. M., 1978, ‘‘Detection of Rolling Element Bearing Damaged by Statistical Vibration Analysis,’’ J. Mech. Des., 100~2!, pp. 229– 135.]. This allows using kurtosis as a condition indicator for diagnosing bearing faults. The kurtosis of a perfect bearing should be 3. Kurtosis values higher than 3 indicate bearing faults. However using the kurtosis as a statistical measure for the raw vibration time signal is not necessarily effective for detecting incipient damage because of the sensitivity to environmental noise and operational conditions. The use of the spectral kurtosis by Antoni et al. [reference Antoni] has shown to be suitable solution for characterizing the transient impulsive type faults that occur for mechanical components; the spectral kurtosis technique has shown to be effectively used as a machine surveillance indicator as well as a way to select an optimum band pass filter for mechanical fault detection.
Bearing algorithm process flow
Figurexx shows the bearing algorithm process flow. The raw signal is first de-noised using discrete wavelet transform. A bank of 13 band pass filters of 1 kHz bandwidth each, in the range of 20-33 kHz, is applied to the non-deterministic part of signal for optimum band specification. The kurtosis of each band is computed and the bandwidth with the highest kurtosis is selected for envelope detection within the non-deterministic signal. The RMS, peak and kurtosis of the enveloped signal is computed and compared with the equivalently processed baseline signal. Based on the outcome of this comparison, general bearings health is indicated. Further to that, the peak detection method is used to detect peaks at characteristic frequencies of bearings. The detected peaks are then compared with peaks detected at characteristic frequencies in the baseline signal to indicate health of inner race, outer race, rolling elements and cage. Also the appropriate gear ratios are applied to the tachometer signal to correctly specify the speeds of input, idle and output shafts. The characteristic frequencies of bearings on each shaft are computed accordingly. The algorithm takes vibration signals both from input and output sides of the gearbox. These techniques ensure condition of components within the each of 6 bearings is indicated separately to isolate the faulty bearing.
Results
Tablexx shows the bearing characteristic frequencies at 20Hz and 50Hz input shaft speeds.
| 30Hz input shaft speed | 50Hz input shaft speed | |||||
| Charatceristic frequency (Hz) | Input shaft | Idler shaft | Output shaft | Input shaft | Idler shaft | Output shaft |
| BPFI | 148.43 | 49.48 | 29.69 | 247.38 | 82.46 | 49.48 |
| BPFO | 91.57 | 30.52 | 18.31 | 152.62 | 50.87 | 30.52 |
| BSF | 59.76 | 19.92 | 11.95 | 99.60 | 33.20 | 19.92 |
| FTF | 11.45 | 3.82 | 2.29 | 19.08 | 6.36 | 3.82 |
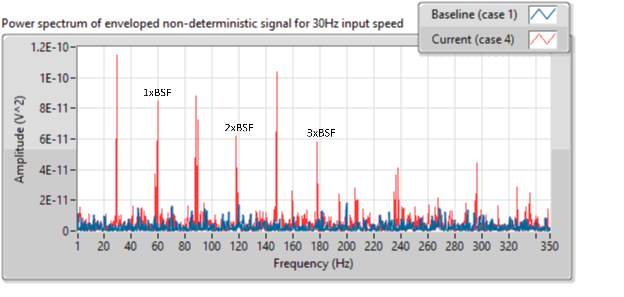
Figurexx shows the power spectrum of enveloped signal from case 4 at 30Hz input shaft speed. The signal in case 4, as indicated in data key, contains signature of faulty ball in the bearing located on the input shaft and input side of the gearbox. The spectrum of enveloped signal clearly contains peaks at BSF (59.76Hz) and its harmonics, indicating defect in ball.
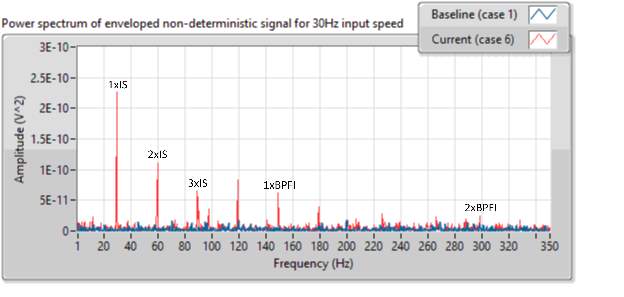
Similarly, figurexx shows the power spectrum of enveloped signal from case 6 at 30Hz input shaft speed. The spectrum contains peaks at BPFI (148.43Hz) and its 2nd harmonic indicating inner race defect. It also contains peaks at input shaft fundamental frequency (30Hz) and its harmonics indicating presence of imbalance in input shaft. As shown in data key, case 6 contains signature from faulty inner race of IS:IS bearing as well as the input shaft imbalance.
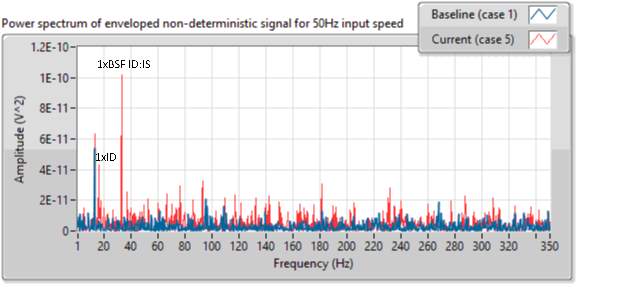
Figurexx shows power spectrum of enveloped signal from case 5 at 50Hz input shaft speed. The case 5 as shown in data key contains signature from defected ball of ID:IS bearing. The spectrum shows peaks at BSF of ID:IS bearing (33.20Hz) as well as at idle shaft rotational frequency (16.6Hz).
Gears condition indicators
Gears are the most important elements within a gearbox and play a prominent role in mechanical power transmission. Due to the industrial importance of gears, the effective condition monitoring of gearboxes is essential. Constant efforts have been made to improve measuring techniques and tools for the early detection and diagnosis of gearbox faults.
Gear mesh frequency
During real gear meshing the load and its direction on the tooth vary with time, causing tooth deflection to also vary [44]. This produces the dominant vibration at the mgear meshing frequency, m f , and its harmonics.
m T r f N . f (1.4)
Where; T N is the number of teeth on the gear and r f is the shaft rotation frequency.
This basic signal will be modulated in amplitude and phase due to imperfection in the gears and teeth such as eccentricity. This modulation appears as sidebands either side of the gear meshing frequency (and the harmonics) in the vibration spectrum, and is separated from them by multiples of the modulating frequency [45] In fact there will be a number of modulation frequencies and determination of these is often very useful in diagnosis of faults. Even the vibration signal generated by healthy gears will contain harmonics and sidebands of the gear meshing frequency. Thus the sideband frequencies will be:
SD mk m r f m. f k. f , (1.5)
Where: m is the number of the meshing harmonic, and k is an integer [19].
Importance of gears
Typical gear faults
The features present in the signal for each fault (gearmesh frequencies, side bands, and increase in number of sidebands as well as amplitudes)
Difference signal
FM4
Power in band
Results
Describe gear faults i.e. eccentricity, broken tooth etc, characteristics of signal containing gear faults
Cite This Work
To export a reference to this article please select a referencing stye below:
Related Services
View all


Related Content
All TagsContent relating to: "Engineering"
Engineering is the application of scientific principles and mathematics to designing and building of structures, such as bridges or buildings, roads, machines etc. and includes a range of specialised fields.
Related Articles

DMCA / Removal Request
If you are the original writer of this dissertation and no longer wish to have your work published on the UKDiss.com website then please: