Financial Reporting and Analysis of: Citrix Systems, Inc.
Info: 12583 words (50 pages) Dissertation
Published: 9th Dec 2019
Tagged: AccountingFinance
Financial Reporting and Analysis of: Citrix Systems, Inc.
Stock symbol: CTXS (NASDAQ)
Table of Contents
RETURN ON EQUITY DECOMPOSITION
DISCOUNTED ABNORMAL RETURN ON EQUITY
EARNINGS GROWTH (BUFFETT’S MODEL)
CALCULATION OF ALTMAN Z-SCORE MODEL
APPENDIX ………………………………………………………………………………………………………….……………………57
Citrix Systems, Inc. (“Citrix”) is in the business of providing virtualization, networking and cloud infrastructure solutions to consumers who aim to influence a world where individuals, organizations, and items are securely linked and easily accessible to make the extraordinary possible. They are disrupting their industry by accelerating change in their industry and providing clients solutions to reimagining the future of how they work.
Rapid technology innovation, coupled with a generational shift in the workplace as Millennials replace Baby Boomers, has motivated Citrix to adapt to changing times and adjust their strategy. Workforces have become increasingly demanding of more agile, productive and resourceful tools to provide their employees flexibility while facilitating productivity and promoting a positive worker experience.
Based on a comprehensive analysis of Strategy, Accounting, Financial, Credit and Prospective analysis of Citrix Systems, we believe the stock it is overvalued at current price levels and our recommendation is a “HOLD. The financial health and growth prospects of Citrix, demonstrate its potential to outperform the market but as the management continues to focus on redefining its product offering and divest from non-profitable business units. At its core business, it shows good signs of strength and viability at 15.3% growth compared to 10.9% of the industry.
STRATEGIC ANALYSIS
COMPANY OVERVIEW
Citrix Systems, Inc. is one of the leading company of its industry, founded in 1989 by former IBM developer Edward Iacobucci. The multinational US-based software firm originated in Richardson, Texas. Later that same year, it was relocated to Mr. Iacobucci’s hometown of Ft. Lauderdale, Florida. Subsidiary operations have been established in California and Massachusetts, with additional centers located worldwide in Australia, Canada, Denmark, Germany, India, and the United Kingdom. As of December 31, 2017, the company employs 8,100 employees worldwide.
Although the company was first introduced as Citrus Systems, a trademarked dispute arise and forced the company to officially change their name to Citrix. In its early days, the company continued to develop their ‘Citrix Multiuser’, which was created to support the OS/2 Microsoft package by allowing multiple users remote access[1]. Today, the company offers a complete and integrated portfolio including application delivery, virtualization, mobility, network delivery and file sharing solution technology that makes applications and data secure and easy to access, empowering people to work anywhere and at any time. In order to encourage employees in promoting growth in trying new ideas and staying current with the times, they added two fundamental practices, ‘curiosity’ and ‘courage’, to their company core values. [2]
Citrix functions through two business segments: the enterprise and service provider, and mobility applications. The enterprise and service provider segment include workspace services, delivery networking products and related license updates, and maintenance and professional services. The company wants to connect people, organizations and things securely and empower them to make the extraordinary possible.[3]
INDUSTRY ANALYSIS
Companies in this industry design and publish computer software. The global information technology industry surpassed $4.5 trillion in 2017, according to the research consultancy IDC. If growth expectations materialize in the year ahead, spending will surpass the $4.8 trillion mark.[4] The Computer Software & Services Industry includes a broad range of companies, offering an extensive range of products and services, spanning personal computer operating systems and office productivity suites to network security applications to payroll processing services to information technology consulting and outsourcing services. Digital transformation is occurring in every industry at a rapid pace.
As stated in Deloitte’s Challenges and solutions for the digital transformation and use of exponential technologies report, the software and services sector is responsive to the needs and opportunities of an increasingly connected and mobile society. The software and services sector is responsive to the needs and opportunities of an increasingly connected and mobile society. The rise of the internet, as well as the continued growth of access around the world, has allowed the Software and Service sector to position itself as an enabler of communication and information. Product and service innovation is focused on increasing mobility, offering large and complex data sets, cloud computing, the virtualization of data centers and helping customers reduce their environmental footprint. Gradually, emerging markets are accounting for an important share of the services these companies provide, as well as being the home to some of these firms.[5]
Important innovations are making cloud computing even more valuable for companies as they seek to transform their operations and business models. These advances are helping organizations accelerate deployments of artificial intelligence and Internet of Things solutions, while also enabling deep, analytics-driven insights and accelerated software delivery.[6]
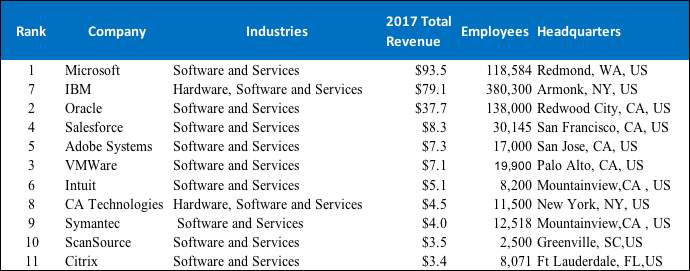
Figure 1 Fortune Global 500 Technology Companies
In order to enable growth and to keep up with the complexities and unyielding pace of digital transformation, companies are buying or partnering with other companies in order to pool their resources for mutual gain in areas where they don’t compete directly.
In order to facilitate growth and to keep up with the complexities and relentless pace of digital transformation, companies are buying or partnering with other companies in order to pool their resources for mutual gain in areas where they don’t compete directly.
In today’s fast-changing technology marketplace, it has become imperative to recognize where new, disruptive technologies are emerging.
COMPETITIVE ENVIRONMENT
Technology is fast disrupting various industries across the board. Traditional software and internet companies have become key players in the business transformation for many industries. Innovation has enticed leading competitors looking to continue growth, increase operational performance and gains to develop more intrinsic creative software.
Michael Porter developed the Five Forces Analysis Model to examine an industry’s competitive and economic structures.[7] The five forces are as follows:
- Bargaining power of buyers
- Bargaining power of suppliers
- Threat of new entrants
- Threat of substitute products or services
- Rivalry among existing competitors
Bargaining power of buyers
Citrix needs to continue satisfying customers, who significantly determine the company’s performance. Buyers increase competition within an industry by forcing down prices, bargaining for improved quality or more services, and playing competitors against each other to obtain better prices. Readily available access to information about product features and prices further empowers buyers as they can use that information to compare Citrix products to competitors. This excels pressure on Citrix Systems, Inc. profitability in the long run.
Bargaining power of Suppliers
Bargaining power of suppliers can raise prices or reduce the quality of products or services. Due to the intensification of the competition in the marketplace, the bargaining power of suppliers among many industries has decreased. For Citrix, the supplier bargaining power is low because the information technology industry, and hardware and software segment is highly competitive, and a large number of companies and suppliers operate in this industry.
Threat of new entrants
New entrants bring innovation and diverse ways of doing things, which puts pressure on Citrix to find ways to continue to improve their price, cost, and quality. It is difficult to enter this industry because of the number of financial resources required for entering the industry. Investment of large capital in Research and Development is essential in order to remain competitive and continue to create innovative products. Entry into this industry is not uncommon, but its competitive nature requires the newcomer to be able to sustain a technological and product marketing edge over its larger rivals. If successful, the new entrant can grow very quickly. However, in the end, it may find itself an acquisition target if it is unable to reach large enough scale.
Threat of substitute products or services
The substitute products and services is considered a major factor for companies as it impacts the overall competitive environment within the industry. For Citrix, the threat of substitute products and services is low because the range of direct and indirect substitution for the types of services offered by the company that includes application virtualization software, network access devices, cloud computing connectivity, and mobile applications and a wide range of software applications is very limited.
Rivalry among the Existing Competitors
The intensity of rivalry among industry players is fierce. Companies are constantly putting pressure on one another and limit each other’s profitability. Citrix is repositioning itself for future growth by redlining their core business. It has streamlined their product portfolio and it is focusing on two segments that generate the most revenue: workspace services and delivery networking.
REGULATORY ELEMENTS
The regulatory trends affecting the software and services sector are related to consumer data privacy and security, and intellectual property (IP) rights, issues that, due to rapid technological change, legal oversight is struggling to keep up with. There has been an ongoing global debate concerning these issues and recently, the U.S. and European Union have taken some steps to introduce regulatory changes.
COMPETITIVE ADVANTAGE
CITRIX SYSTEMS INC Is benchmark against industry averages and competitors, including:
Microsoft Corporation
IBM
Oracle Corporation
Salesforce
Adobe Systems
VMware Inc
Intuit
CA Technologies
ScanSource
Symantec
Developing purpose-built products from the ground up is fundamental to the company’s culture of meeting customer needs. Every Citrix product is designed to deliver exceptional reliability, speed, security, and ease of use while being affordable to businesses of all sizes. This appealing combination of simplicity and cost-effective pricing enables the company to enjoy widespread adoption of its product offerings.
Flexible work environments better align work policies to the lives and values of employees. As a result, employees become more engaged and productive. However, providing this kind of flexibility introduces new security and management challenges. To stay ahead, employers will need to find new strategies for managing and securing their technology infrastructure.
Citrix Systems became the leader in Workspace as a Service (WaaS) by delivering the industry’s most secure platform, data, network, and delivered services in their Cloud. Citrix is well positioned for continued sturdy growth. Its collection of solutions enables businesses to fundamentally change their economies by allowing them to innovate, extend their reach and productivity and drive higher ROI. The company is uniquely positioned for long-term changes in the workplace. Its remote access and collaboration services free businesses to work from anywhere, providing employers and employees alike with significant advantages in productivity, cost savings and job satisfaction.
SWOT ANALYSIS
SWOT analysis is a strategic planning tool that can be used by a company to perform a situational analysis of the company. Citrix continues its leading position in the market by critically studying and evaluating their SWOT analysis. This analysis proves to be a handy means in understanding the company’s Strengths (S), Weakness (W), Opportunities (O) & Threats (T) Citrix faces in its current business environment.
The core purpose of SWOT matrix is to identify the strategies that a company can utilize to exploit external opportunities, counter threats, and build on & protect Citrix Systems strengths, and eradicate its weaknesses.
STRENGTHS
As one of the leading companies in its industry, Citrix Systems has numerous strengths that help the company protect market share while also letting it continue to thrive in the marketplace.
- Strong cash flow.
- Increased investment in Research & Development.
- The company sells directly to the consumer, saving om retailers margin while still also selling to resellers, to reach a large diversified market.
- Strong network of suppliers and distributors.
- Strong online service segment, easily accessible by end users, with an option to easily customize package requests.
- Excellent Supply Chain Management, helping to reduce operational cost.
- Has company centers worldwide, including Australia, Canada, Denmark, Germany, India, and the United Kingdom with 8,1000 strong workforces.
WEAKNESS
Weakness, or internal strategic factors, where Citrix can improve upon to keep their competitive advantage and strategic positioning include:
- High inventory days, and low inventory turnover due to their inefficient demand forecasting.
- Supplier issues causing a few operational issues.
- Need for more innovation and new technology investment to stay a competitive industry leader outside of core business.
- More controlled global dispersion and higher days in inventory as compared to a few other leading companies due to poor forecasting.
OPPORTUNITIES
Opportunities or external strategic factors, where Citrix is able to grow and dominate more market while attracting higher gains include:
- Strategic mergers and acquisitions.
- Technology partnerships to enhance technology and market positioning.
- Growing virtualization market.
- Manufacturing and marketing low-cost, unbranded low-price PCs.
- New online platform investments geared to attract more online consumers.
- Expected increased revenues due to new consumer work trend requests.
THREATS
Threats, other external strategic factors, Citrix needs to take into consideration in order to stay a leading company includes:
- Intense growing market competition.
- Competitor counterfeit low-quality imitation of products.
- Threat of new competitor offering more affordable value propositions.
- Fluctuation in the currency due to operating in multiple countries.
VALUES OF KEY PERSONNEL
Increased turnover of multiple senior-level members of management has created uncertainty and instability for Citrix in the last three years. In several cases, these valuable managers have left to join Citrix’s direct competitors. As one of the main priorities of Citrix management, initiatives were created to retain, and recruit top talent was implemented.
Citrix is committed to connecting and engaging employees and customers. Citrix states in its Code of Business Conduct that it “values employee diversity and equal opportunity for all”. They encourage innovative ways of doing things and continuously look for new young blood. Diversity and inclusion are utilized to leverage the power of human difference for good.
According to Donna Kimmel, SVP Chief People Officer at Citrix, “Even as technology continues its breathtaking pace of innovation, nothing can replace the empathy, creativity, and potential of the people in your organization”. By being open to learning new things, challenging limits, failing fast and learning continuously, employees will be better enabled to thrive in a future of work characterized by smart machines and big data. Citrix believes when employees are given the space to make meaningful contributions at work, they become more purposeful not only in their daily tasks but in their careers.
Employees take pride in the company’s relentless technological innovation, commitment to cybersecurity and the opportunities it creates for their customers. The company’s vision of Corporate Citizenship is to help people work better and live better Citrix acknowledges that it “is rapidly expanding its business every day” and that its responsibility to be a global corporate citizen has grown.
ACCOUNTING ANALYSIS
Citrix’s annual report outlines all of its accounting policies in support of their financial statements. In a review of their accounting policies, we compared their methods with their competitors (Oracle, VMWare, and Microsoft) and concluded that majority of Citrix’s reporting methods are similar to their competitors. The closest in comparison in similarities is VMWare’s, while Microsoft and Oracle are much more specific in their reporting. Below is a comparison table between Citrix and their competitors. For more details about their accounting policies, we’ve included in the appendix at the end of this report.
| CITRIX[8] | ORACLE[9] | VMWARE[10] | MICROSOFT[11] | |
| Revenue Recognition | Persuasive evidence of the arrangement exists.
Must indicate terms and conditions of a distributor, reseller or end user agreement. |
Similar – overall necessity of persuasive evidence of the business arrangement. Fees are fixed or determinable – buyers do not have right to refund fees or payment terms once details are established.
Difference – Oracle goes into specifics of their types of products, i.e. non-software elements, software, hardware, etc. |
Similar – overall necessity of persuasive evidence of the business arrangement. Fees are fixed or determinable.
Differences – services are classified by design, implementation, and training. These are not considered essential to the functionality (not included in initial package). |
Similar – overall necessity of persuasive evidence of an arrangement must exist; the fee is fixed or determinable and collectability is probable. |
| Delivery has occurred, and no remaining obligations exist.
Delivery of Product – licenses, hardware, training and consulting services, updates and maintenance. For services, revenues are recognized ratably over the contract term commencing the start date that the services are initially available to the buyers, 12 to 24 months. |
Similar – delivery/passage of rights and titles to the buyer; for services, revenues are recognized ratably over the contract term commencing the start date that the services are initially available to the buyers. | Similar – delivery/passage of rights and titles to the buyer; for services, revenue is recognized as hours are
Difference – VMWare enters into multiple-element arrangements, which its revenues are deferred until fair value is determined via the Selling Price Hierarchy. |
Similar – delivery/passage of rights and titles to the buyer; for services, revenues are recognized ratably over the contract term commencing the start date that the services are initially available to the buyers.
Differences – software update delivery was specified as free of charge are evaluated on case-by-case (whether it is an upgrade or a multiple-element arrangement). Specifically, due to Windows 10 license. |
|
Selling Price Hierarchy
Established by hardware/software types. Hierarchy is utilized based on an availability of selling prices. |
Similar – Oracle utilizes the same hierarchy (VSOE, then TPE, then ESP).
Difference – This hierarchy is used only for non-software products; typically depends on if product consists of software and non-software elements that are sold separately. ESP is evaluated differently from Citrix’s as Oracle looks into specifics about how and why elements are sold separately. |
Similar – VMWare utilizes the same hierarchy (VSOE, then TPE, then BESP). BESP – Best estimated selling price – different name, same concept.
Difference – This hierarchy is used only for non-software products; for multiple-element arrangements, any revenue is deferred until VSOE exists for any undelivered product/service. VMWare also generally does not have VSOE of fair value for specified upgrades or license products. |
Similar – Microsoft utilizes the same hierarchy (VSOE, then TPE, then ESP).
Software Elements – VSOE Multiple-elements delivered – VSOE Stand-alone Basis – ESP |
| CITRIX | ORACLE | VMWARE | MICROSOFT | |
| Investments | Measurements
Available-for-sale investments are measured on a recurring basis. Investments that are accounted for are based on cost method. When investments are impaired, they are measured on a non-recurring basis. |
Similar – Oracle classifies all of the marketable debt and equity securities as available-for-sale.[12] | Similar – VMWare classifies their short-term investments as available-for-sale securities. | Similar – Microsoft reviews their investments quarterly for other-than-temporary impairments.
Debt and publicly-traded equity securities are classified as available-for-sale and realized gains and losses are recorded using the specific identification method. |
| Fair Value Hierarchy
Prioritizes the inputs used in measuring fair value Maximizes use of observable inputs and minimizes the use of unobservable inputs by requiring most observable inputs be used when available. |
Similar – Marketable debt and equity securities classified as available-for-sale are reported at fair value, with all unrealized gains (losses) reflected net of tax in stockholders’ equity on Oracle’s consolidated balance sheets | Similar – VMware carries its fixed-income investments at fair value and unrealized gains and losses on these investments, net of taxes, are included in accumulated other comprehensive income (loss). | Similar – Microsoft recognizes the fair values of their investments as approximations of their carrying value.
Difference – Microsoft considers all highly liquid interest-earning investments with a maturity of three months or less at the date of purchase to be cash equivalents. |
|
| Impairment
Citrix reviews investments quarterly for other-than-temporary impairments. When investments are impaired, they are measured on a non-recurring basis. |
Similar – Oracle evaluates the investments to determine if impairment charges are required. | Similar – VMWare reviews their investments quarterly for other-than-temporary impairments.
When a determination has been made that an other-than-temporary decline in fair value has occurred, the amount of the decline that is related to a credit loss is realized and is included on the consolidated statements of income. |
Similar – Microsoft reviews their investments quarterly for other-than-temporary investments. The company employs available quantitative and qualitative evidence.
Once a decline in fair value is determined to be other-than-temporary, an impairment charge is recorded to other income (expense), net and a new cost basis in the investment is established. |
| CITRIX | ORACLE | VMWARE | MICROSOFT | |
| Goodwill | Evaluation
Excess of fair value of purchase price over the fair values of the identifiable assets and liabilities from Citrix’s acquisitions. Citrix recorded $1.61 billion in Goodwill related to their acquisitions. |
Similar – Oracle measures Goodwill as the excess of the purchase price in a business combination over the fair value of net tangible and intangible assets acquired. Oracle
can perform two-step impairment test or perform a qualitative assessment. |
Similar – VMWare measures Goodwill as the excess of consideration transferred over the net amounts of the identifiable tangible and intangible assets acquired and the liabilities assumed at the acquisition date.
Difference – VMWare includes this under Business Combinations. VMWare recorded $3.9 billion in Goodwill. |
Difference – The estimated fair value assigned to the tangible assets, identifiable intangible assets, and assumed liabilities were based on management’s estimates and assumptions. |
| Impairment
Intangible assets are reviewed annually, during the fourth quarter of the fiscal year, for indicators of impairments. The fair value of each reporting unit is estimated primarily through the use of a discounted cash flow methodology. The fair value of each reporting unit is estimated primarily through the use of a discounted cash flow methodology. Citrix did not recognize any goodwill impairment after their annual tests for the 2017 fiscal year. |
Similar – Oracle reviews annually for impairment. Oracle uses fair value of a reporting unit for determination of the carrying value.
Difference – Oracle also reviews whenever events or changes in circumstances indicate its carrying value may not be recoverable. Intangible assets that are not considered to have an indefinite useful life are amortized over their useful lives, which generally range from one to 10 years. Oracle did not recognize any goodwill impairment charges in the 2017 fiscal year. |
Similar – VMWare reviews for impairment during the fourth quarter of each year or more frequently if events or changes in circumstances indicate that the carrying value of the asset may not be recoverable.
VMWare concluded that there were no impairments to Goodwill for the 2017 fiscal year. |
Similar – Microsoft reviews annually for impairment, specifically on a reporting unit level.
Microsoft also reviews if an event occurs or circumstances change that would more likely than not reduce the fair value of a reporting unit below its carrying value. Difference – All of Microsoft’s intangible assets are subject to amortization and are amortized using the straight-line method over their estimated period of benefit, ranging from one to 15 years. |
| CITRIX | ORACLE | VMWARE | MICROSOFT | |
| Income Taxes | Deferred Tax Assets
Citrix recorded a valuation allowance of $76.8 million to reduce deferred tax assets, which they must be able to generate sufficient taxable income in those jurisdictions where the deferred tax assets are located. These deferred tax assets are reviewed periodically for recoverability. Citrix reported $152.3 million in net deferred tax assets was necessary. |
Similar – Oracle recorded a valuation allowance to reduce deferred tax assets. In order to do so, the company has to generate sufficient taxable income. Adjustments will be made depending on whether or not the company realizes their deferred tax assets.
Oracle reported $1.14 million in net deferred tax assets. |
Difference – VMWare is recognized under the Dell consolidated group; the company is subject to periodic reviews to determine adequacy and recoverability.
VMWare reported $346 million in net deferred tax assets. |
Similar – Microsoft recorded a valuation allowance to reduce deferred tax assets. In order to do so, the company has to generate sufficient taxable income.
Microsoft reported $2.7 billion and $617 million for the U.S. and foreign subsidiaries, respectively. |
| 2017 Tax Act
Fiscal Year ending December 31, 2017 Citrix had a re-measurement due to the reduction of the corporate tax rate; a provisional income tax charge of $64.8 million was recorded. |
Fiscal Year ending May 31, 2017
The 2017 Tax Act did not apply to Oracle’s annual report ending on May 31, 2017, as the Tax Act was implemented in December 2017. |
Fiscal Year ending February 2, 2018
Due to the timing of Tax Act implementation, VMWare was not able to finalize calculations of total foreign earnings and profits. |
Fiscal Year ending June 30, 2017
The 2017 Tax Act did not apply to Microsoft’s annual report ending on June 30, 2017, as the Tax Act was implemented in December 2017. |
FINANCIAL ANALYSIS
The goal of this financial analysis is to determine the health of Citrix, and how it compares with the industry. Two competitors Citrix identifies as strong competitors that will be discussed in this analysis include Oracle (ORCL) and VMware (VMW). The 10-year period covered for the purpose of this financial examination, used for all three companies, were obtained from Wharton, University of Pennsylvania[13]. Note that data for the fiscal year ending 2017 for both Oracle and VMware were not available (N/A). Key areas that were analyzed for Citrix and its competitors include Return on Equity Decomposition, Profitability, Asset Management, Liquidity, Debt & Coverage and, Sustainable Growth.
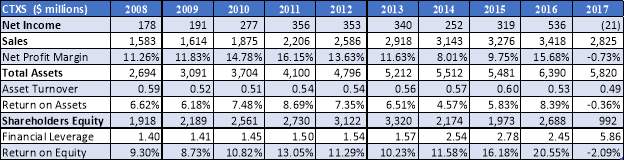
RETURN ON EQUITY DECOMPOSITION
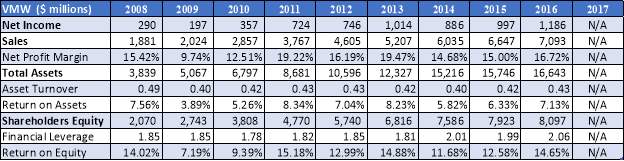
The following tables show the Return on Equity (ROE) for Citrix, and its two competitors elected: Oracle and VMware. This analysis provides financial information on the impact that the business decisions taken had on these companies. Below we will compare their Net Income, Sales, Net Profit Margin, Total Assets, Asset turnover, Return on Assets (ROA), Shareholder’s Equity, Financial leverage, and Return on Equity (ROE).
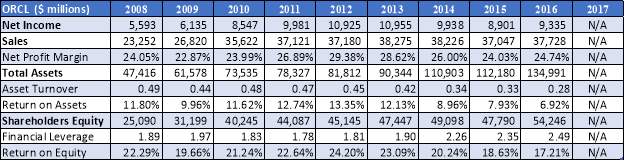
*N/A=Not Available
*N/A=Not Available
Citrix’s Net Income and Sales, in comparison to its chosen opponents, is the lowest. Still, this does not signify that the company is performing the poorest. Therefore, we will now dive into the financial ratios to better evaluate the well-being of the company.
Citrix’s net income increased to almost double its average in 2016 of $536 million, or $3.41 per diluted share. During FY2016 Citrix appointed Kirill Tatarinov as President and CEO, who transitioned the company to a functional business structure in order to unify the organization. This shift unveiled a new focus on company values while also announcing their separation of GoTo Business and, its merger with billion-dollar industry leader LogMeIn.[14]
Below is a chart and graph showing the Net Profit Margin trends for Citrix, its competitors, and the industry average.
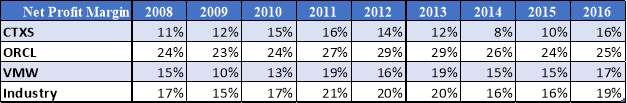
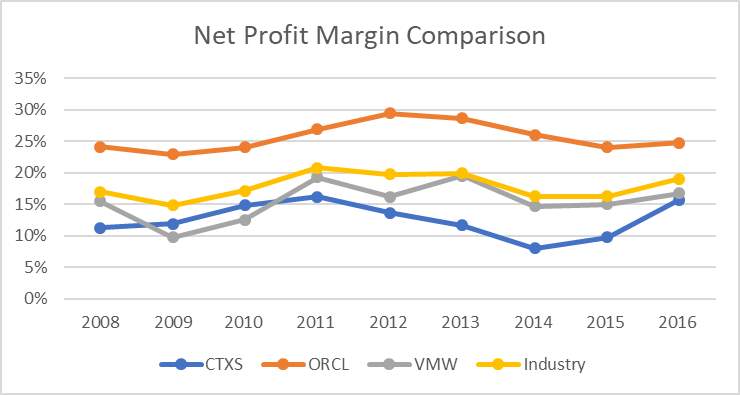
The Net Profit Margin comparison clearly shows that Oracle consistently leads in the industry over the analyzed time frame by an average of 15% more each period. Between 2011 and 2014 Citrix shows that it had a challenging time in keeping profit compared to its competition but, between 2014 and 2016 a welcomed 6% increase occurred. FY 2014 was a pivotal year of transformation for Citrix since they launched their “software-defined workplace” strategy, and new programs to better optimize capital structure to be able to return higher capital to its shareholders. [15]
Below is a chart and graph showing the Asset Turnover trends for Citrix, its competitors, and the industry average.
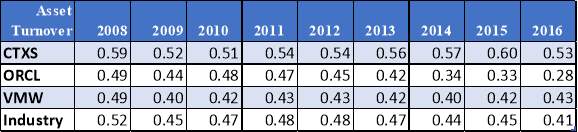
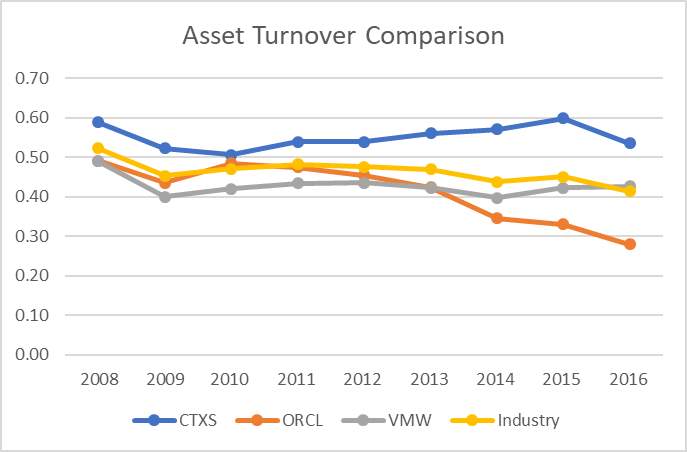
Citrix might not be the industry leader with net profit margins but they do have full control of how they generate sales with their assets. This Asset Turnover indicator shows that Citrix uses its resources to sustain efficient processes to manage its assets and generate revenues. On the other hand, the other competitors who have greater net income and sales, are below industry average.
Below is a chart and graph showing the Financial leverage trends for Citrix, its competitors, and the industry average.
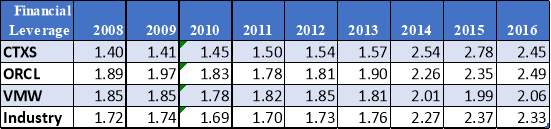
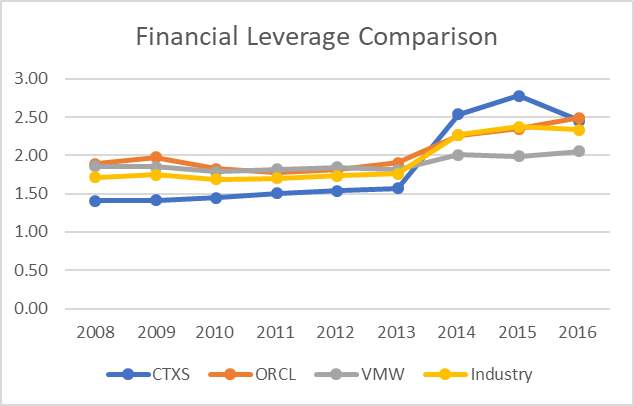
Citrix financial leverage ratio trend is explosive from being consistent and below industry average through 2008-2013 to a substantial change in 2014 above the industry average. This 1-point change does mean that Citrix made a business decision that increased their financial debt and risk, but analyzing the other ratios we can see that it has been worth the investment they have made to increase business growth. In FY2014 Citrix had major “initiatives” to streamline the organization, simplify focus on core growth markets and re-allocate resources towards emerging high-growth businesses as well as future initiatives like the Citrix Workspace Cloud[16].
PROFITABILITY
In order to determine Citrix’s profitability, below is a comparative analysis of Return on Common Equity, Return on Assets, and Gross Profit Margin with the industry.
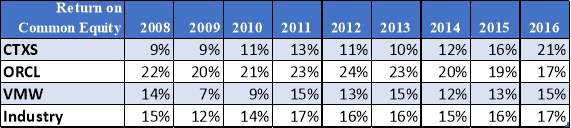
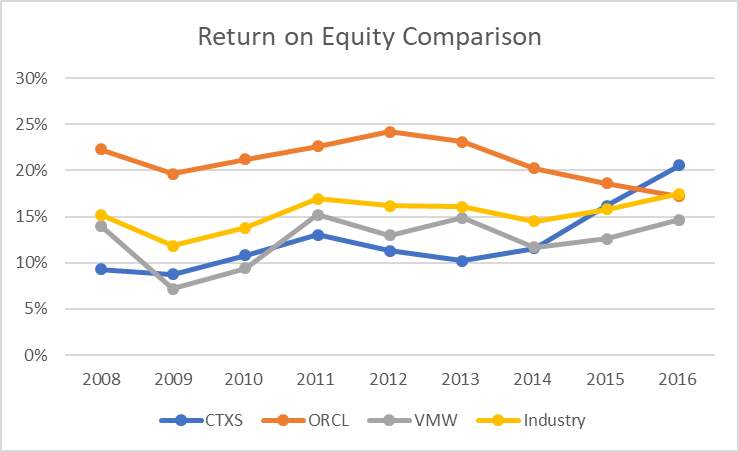
Top competitor Oracle has continuously been above average in the Return on Equity trends for this time period demonstrating an effective management of shareholders’ funds. After 2013, Citrix displays a positive ROE trend, this indicator would encourage investors who wish to invest in this industry to consider Citrix rather than its VMW competitor, who is constantly below the industry average, and, ORCL, who is trending downward with decreasing ROE.
Below are a chart and graph showing the Return on Total Asset trends for Citrix, its competitors, and the industry average.
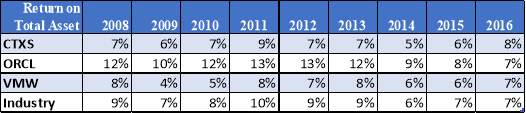
Return on Asset (ROA) measures the company’s profit for every asset invested. Oracle continues to once again show above average returns until 2014, “primarily on account of lower interest income”[17] The industry trend including Oracle who has been consistently higher ROA, causing it to increase. Between 2014 and 2016 both Citrix and VMware increased its ROA while Oracle decreased to the industry average.
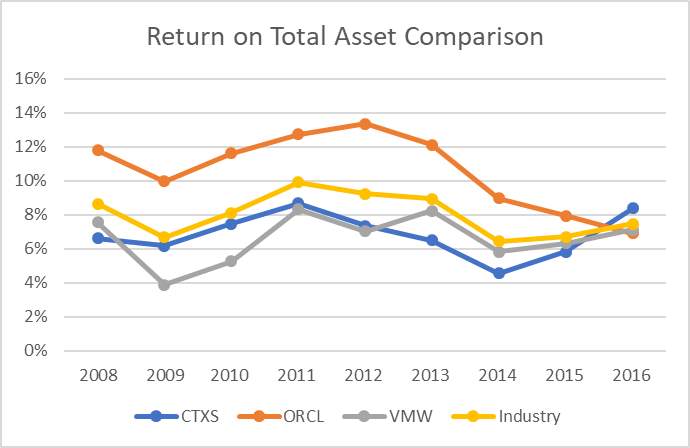
Below is a chart and graph showing the Gross Profit Margin trends for Citrix, its competitors, and the industry average.
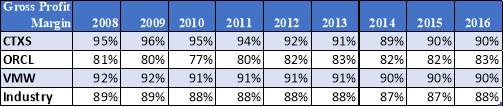
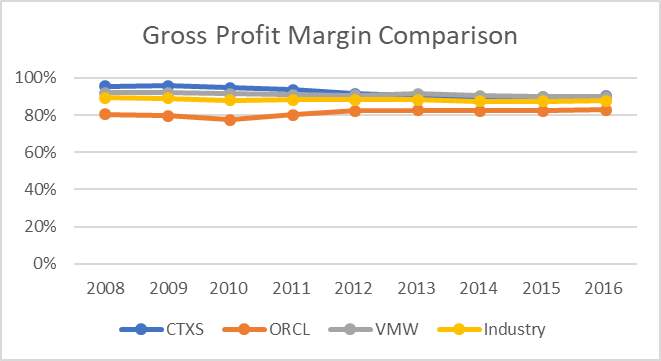
Gross Profit Margin ratio is the proportion of money left over from revenues after subtracting the cost of goods sold (COGS), divided by the revenues. The above data shows the industry and businesses have been consistent over this period of time. This demonstrates that the industry has low COGS, and about 90% is Gross Profit. This indicator is definitely an eye catcher for investors as it shows consistent profitability.
ASSET MANAGEMENT
Operating Working Capital turnover and Inventory turnover are analyzed below to determine how these companies manage their assets. As previously noted 2017 data for the competitors was not available (N/A).
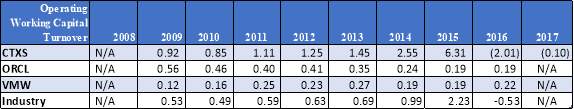
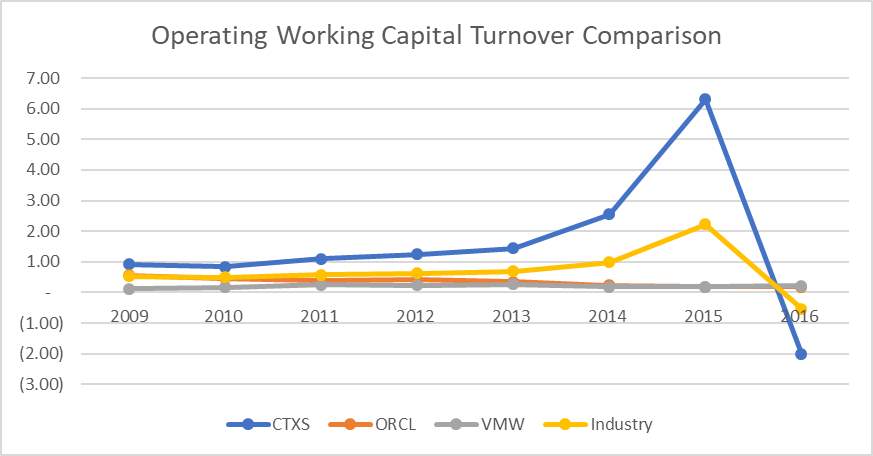
From 2009 to 2013 Citrix maintained a steady operating working capital turnover, much like the projected industry average. There was a spike between the 2014 and 2015 period, followed by a drastic change in 2016. During the 2016 year, Citrix fell below the line resulting in a negative 2.01 working capital. The company’s negative downward trend, scoring up to -537, stated to its competitors that their negative working capital reflected they had more total current liabilities (debt) than total current assets. This ratio shows that Citrix was having a challenging time in 2016, and clearly lacked the required funds for future growth, while the other competitors maintained their stable ratios and business.
Below is a chart and graph showing the Inventory Turnover trends for Citrix, its competitors, and the industry average.
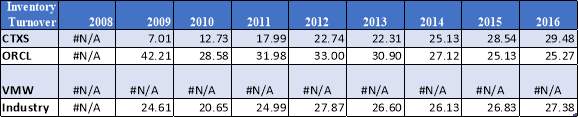
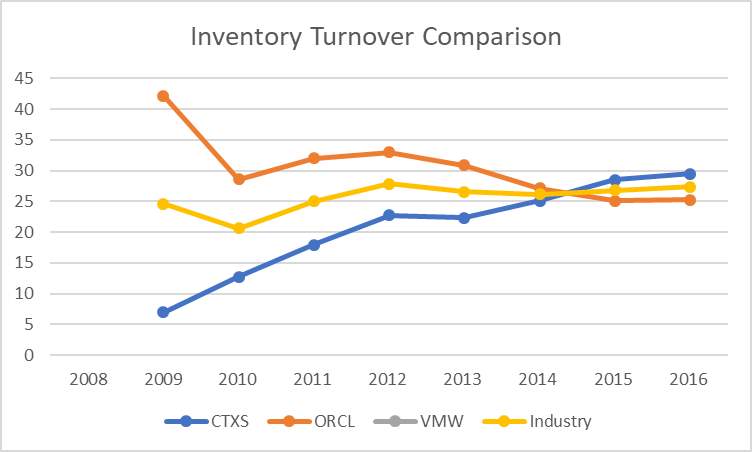
Although some data is not currently available to clearly compare certain aspects of Citrix to its competitors, it still demonstrates that through all its’ adversity to still be a solid opponent to both VMware and Oracle. Trends have confirmed that Citrix has maintained a positive linear trend and high positive ratio when referring to sales, year after year. In 2014, Citrix surpassed Oracle in Inventory turnover, demonstrating that it has a better integrated efficient inventory management system. These significant skills have been a huge part of the company’s success.
LIQUIDITY
The ratios used to determine the liquidity of Citrix are Current Ratio, Quick Ratio, and operating cash flow ratio. These ratios allow us to dive into operations management and provide a closer insight into Citrix’s processes.
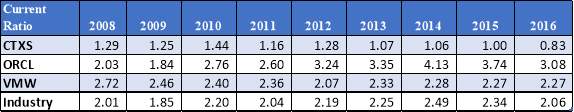
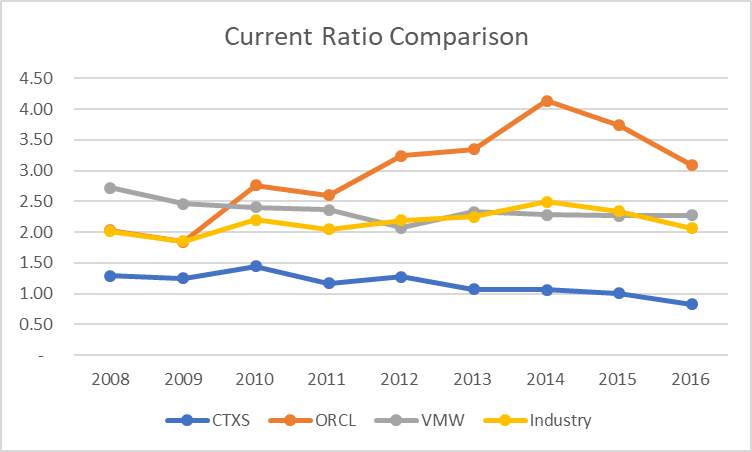
Current ratio points out the short-term liquidity of the company, and the ability to cover its current liabilities using its current assets. Citrix has a low 1 ratio compared to the industry 2.5 average and Oracle’s positive trend who surpasses all. Citrix’s average ratio of 1 means that they are able to only exactly cover their liabilities. In 2016 they were below a 1.0, indicating that their liabilities are greater than their assets. This current ratio analysis is definitely concerning for Citrix investors because they were unable to at least meet the industry average.
Below is a chart and graph showing the Quick Ratio trends for Citrix, its competitors, and the industry average.
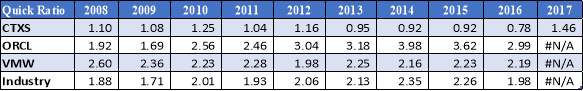
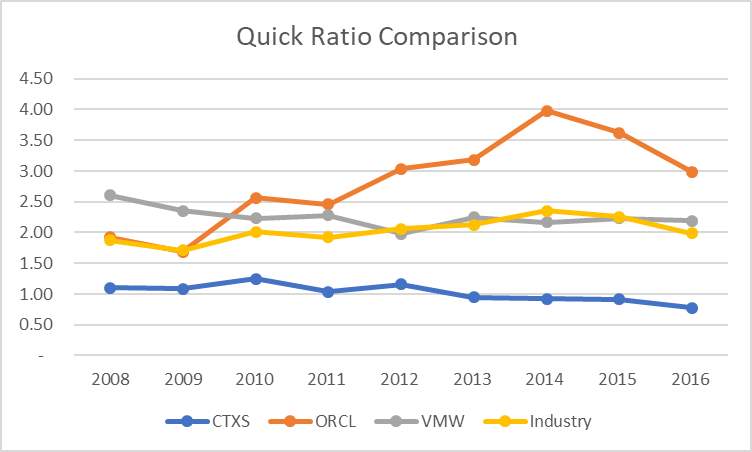
Similar to Current ratio, the Quick ratio also helps determine the ability for these companies to pay their current liabilities with current assets. From the information collected, Citrix cannot quickly convert its assets into cash to pay off its current liabilities. The higher ratios that Oracle earned reveals that they are able to successfully pay off their current liabilities without having to sell any of their long-term assets. Instead, Citrix would need to sell their long-term assets to pay off current liabilities, which could hurt the company because ‘those’ assets are the ones that generate the most revenue.
Below is a chart and graph showing the Operating Cash Flow ratio trends for Citrix, its competitors, and the industry average.
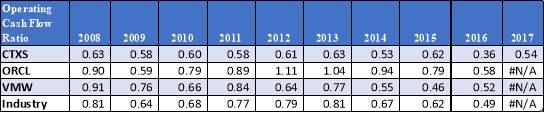
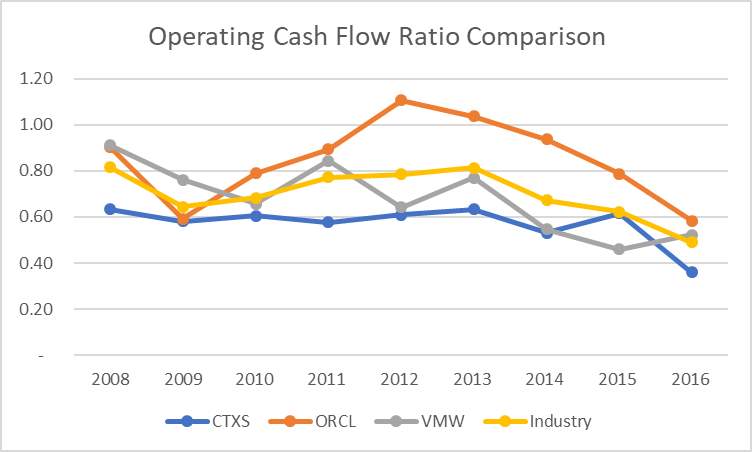
Operating cash flow (OCF) is the last liquidity measure examined in this analysis. Again, the trends show that Citrix has a difficult time paying its current liabilities, but, in this case, the overall industry cannot fully cover its liabilities with their operating cash flow. Cash flows are usually a more accurate measure since revenues can be manipulated. OCF can still be slightly manipulated by paying bills later, and by deducting depreciation expense from its revenue. Citrix accounting does subtract depreciation and it has been on average $204 million per year. [18]
DEBT & COVERAGE
Debt to Assets, Debt to Equity, and Interest Coverage ratios were all calculated to evaluate the company’s Debt & Coverage. Competitors’ information only covered 8 of the 10 years used in the analysis report. Having an above 1 ratio signifies that the business can generate enough cash flow to cover its operating expenses.
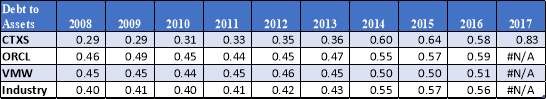
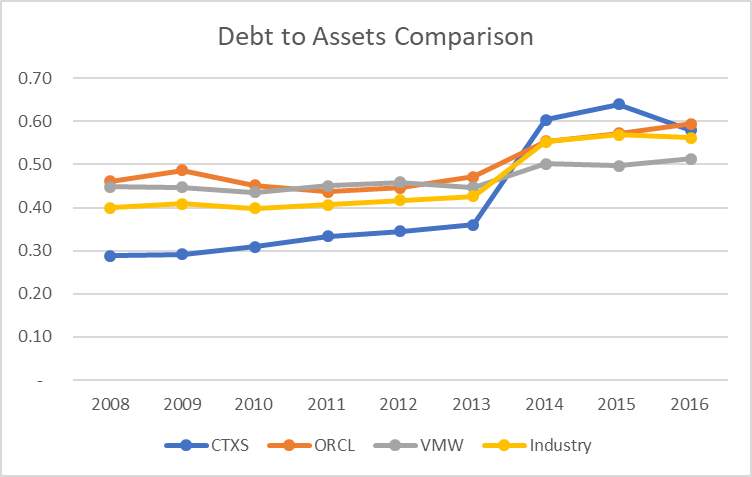
The Debt to Asset trends confirms that Citrix has always been in the lower side of the risk spectrum, but in 2014, Citrix can be seen as raising its financial risk with its competitors and the overall industry. That same year they merged with multiple companies: Octoblu, RightSignature, ScaleXtreme, FrameHawk, and much more[19]. This jump was due to an increase in assets that were financed by debts.
Below is a chart and graph showing the Debt to Equity trends for Citrix, its competitors, and the industry average.
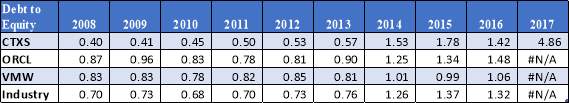
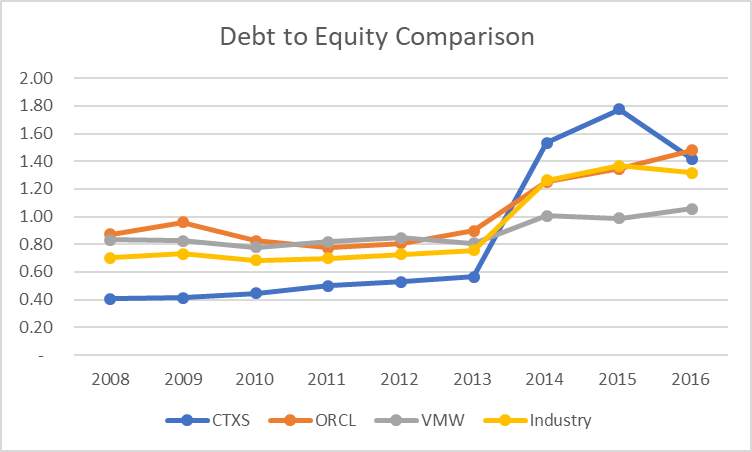
The industry Debt to Equity ratio was approximately .8 between 2008 and 2013, year after year. But, as most equity ratios have been trending, there was an increase in 2014 and a positive trend thereafter for the industry. The lower debt to equity between 2008 and 2013 implies more financial business stability. The increase in 2014 is concerning and shows that more creditor financing was used instead of shareholder’s funds.
Below is a chart and graph showing the Interest Coverage trends for Citrix, its competitors, and the industry average.

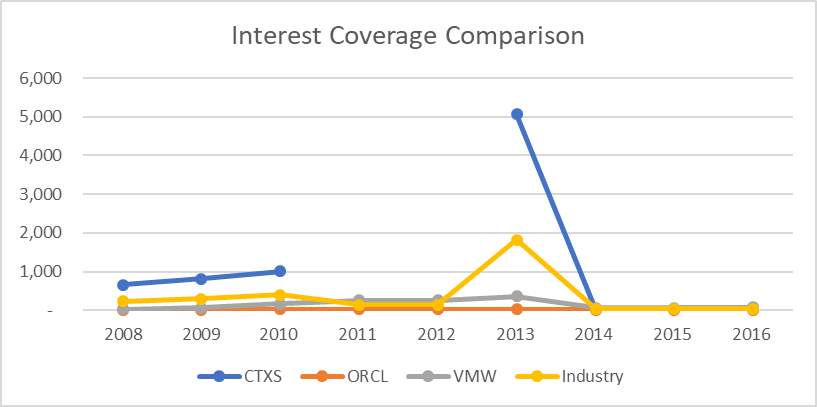
During 2011 and 2012 Citrix did not have any interest expense thus, no Interest Coverage Ratio (ICR) was able to be determined. Citrix has the highest interest coverage when compared to the competition. An overall industry average indicates they could be expanding their earnings through leverage.
SUSTAINABLE GROWTH
Sustainable Growth Rate indicates the maximum rate that a company can grow while maintaining its policies and profitability unchanged. Below is a chart and graph showing the trends for Citrix, its competitors, and the industry average.
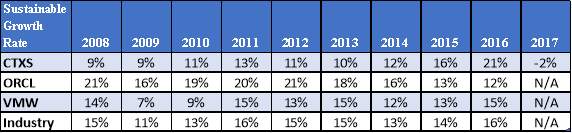
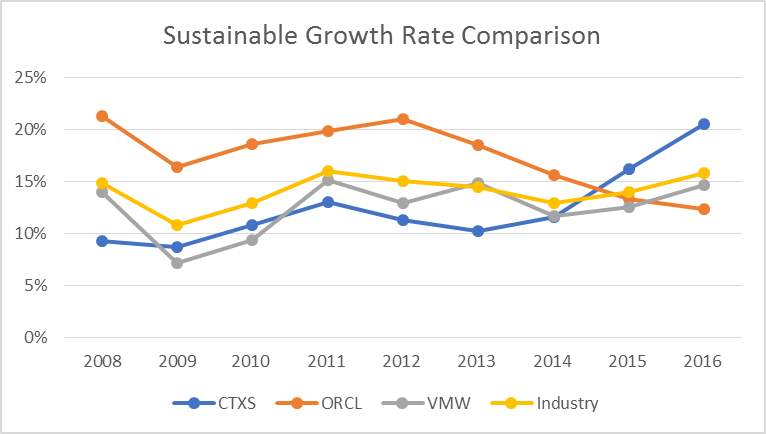
The industry average shows that these companies can safely grow at a 15% rate by using its revenues and still be sustained. Per sustainability, Oracle has maintained a constant growth until 2012, which rapidly declined. While Citrix was at 10% growth and has been increasing year after year to 20% in 2016. This sustainable growth has a lot to do with company structure, accelerated inventory and receivables turnover, and minimizing dividend payments.
FORECASTING
In order for companies to determine the direction of their expected future trends, the analysis of present and historical data is studied to forecast, and thus plan, the probable demand of their offered goods and services. Businesses use these decision-making tools to adjust how they propose to distribute their budgets while preparing for any additional expenses they may anticipate, in the future and estimate future growth.
In this section, we will evaluate the future of Citrix based, not only on its own present and historical data, but its Technology Sector & Software Industry positioning set against its two biggest competitors: Oracle and VMware. As one may note, of the three companies being compared, Oracle has outperformed its competitors by a large margin. This is due to ORCL having been established earlier (1977) and having significantly achieved greater financial, technical, sales & marketing and added resources available to them to thrive. Still, CTXS is hopeful that, as the markets for their products, solutions, and services continue to develop, they will gain a noteworthy market presence in the computer applications, software, cloud services and networking industries, and further increase competition.
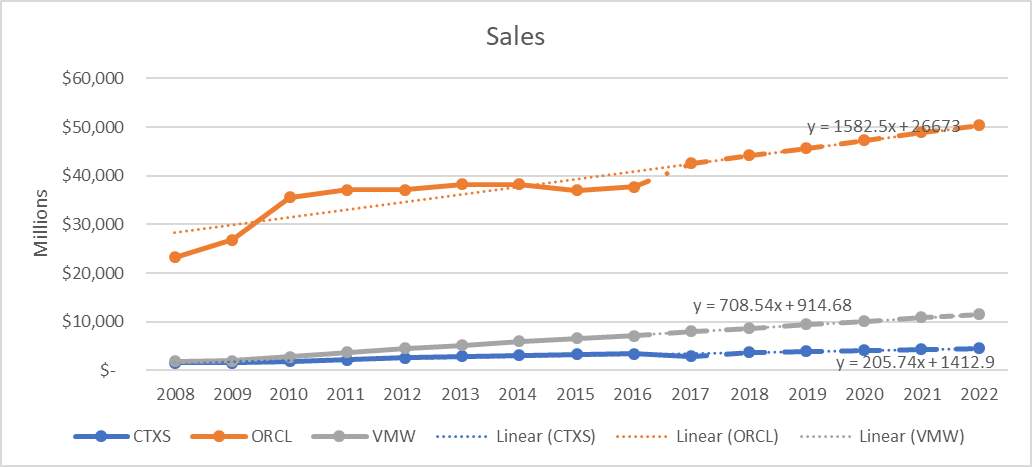
SALES
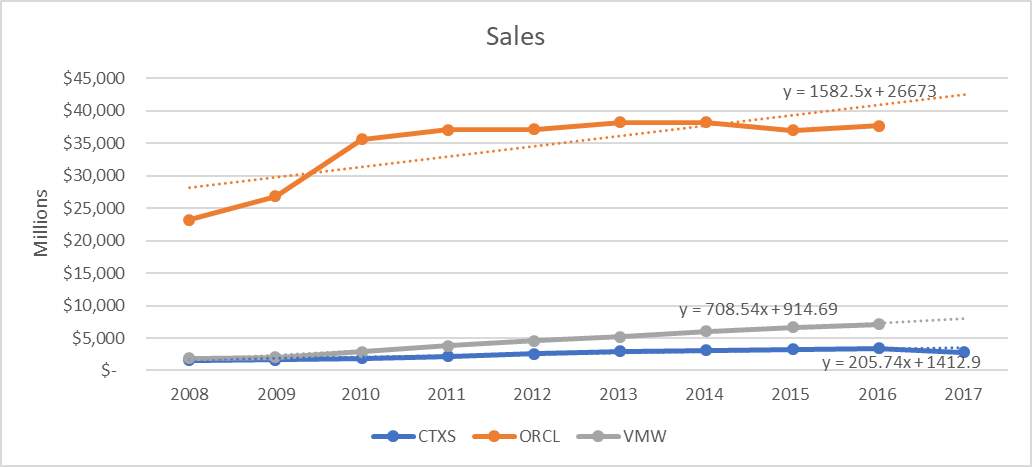
Sale projecting is a vital part of business managing. Without having an understanding of what future sales might be, companies cannot manage their inventory, cash flows or plan for future growth effectively. When studying the trend of the last ten years, CTXS has performed the most conventionally. In 2015, as more end users began relying more heavily on their Android and iOS-based smartphones and tablets instead of the usual standard Windows-based desktops and laptops, Citrix ‘tools’ that primarily focused on Windows-based computing systems were far less appealing to consumers. With demands ever-changing, the company has since then trimmed its product lines and tried packaging and re-packaging its technology in hopes of attracting a larger clientele. Still, since 2015 their inventory turnover has scored higher than both the industry average and ORCL. Based on a trend of the past five years, Citrix reported an average 11% growth rate. This constant steady sales growth signifies that the company understands how to manage inventory and reduce additional unnecessary costs, such as storage. We expect that keeping to the 11% growth already noted, sales will continue to gradually increase. In the past five years, the company has spent an average of $116.52M in R&D. CTXS main current focus includes their accelerated Workspace innovation with Microsoft applications and creating a more people-centric computing system. This focus to keep up with innovation, coupled with striving to stay competitive and stay true to their shareholders, assures observers that they will try their best to keep to this upward trend.
Also, in order to continue to be successful, the focus of their company business model is being redefined and is focused on shifting away from sales of continuous licenses to sales of subscriptions. Sales and renewals of license updates and maintenance solutions currently make up a large portion of their deferred income. The company is aiming to appeal and attain large business enterprise customers adding effective value-added distributors, system integrators, and other partners, as well as expanding direct sales teams and consulting services. Taking into account international conditions and being subject to the adverse risks of global and economic changes that may be imposed, the company has made International revenues accounted for approximately 46.3% of their net revenues for the year ended December 31, 2017, 46.3% of the net revenues for the year ended December 31, 2016 and 48.7% of the net revenues for the year ended December 31, 2015. With the uncertainty of the market, CTXS tries to stay ‘transparent’ and always includes disclaimers to their shareholders that, although striving to stay successful and a key player in the industry, there are always risks of the unknown future.

INCOME
When analyzing Income, profitability ratios are examined to measures a firm’s productivity by revealing how much profit a company generates with the money shareholders have invested. In particular, the return on common equity ratio for 2015 and on show a percentage equal or higher to both the industry average and its biggest competitor, ORCL. CTXS gross margin has shortened in the past five years resulting from the average revenue growth of 7.57% and a net income growth of 6.23%. As stated though, because of long life cycles and deferred income, smaller net income is recognized. Citrix’s most current margin of 15.9% appears to shadow this trend, signifying that earnings growth was probably motivated by a rise in revenue rather than better cost management. Margins are expected to become comparatively stable, with 3% in anticipated annual revenue growth and a forecasted 2.85% in annual net income progress.[20] CTXS’s projected ROE of 35.2% surpasses that of the predicted 13% ROE of the industry. As well, CTXS is able to meet its short-term obligations with its current cash holdings and other short-term assets. Yet, CTXS’s long-term commitments outdo its cash and other short-term assets.
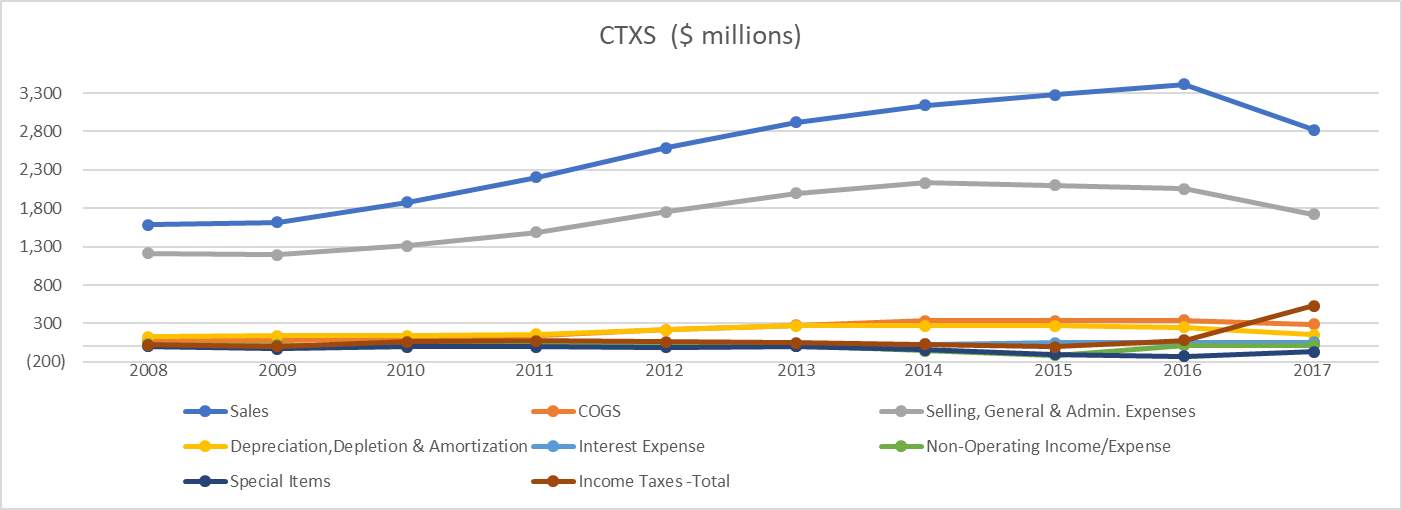
The above line graph represents the finances of CTXS for the last ten years. Sales have increased as Selling, General & Admin expenses have also risen, due to increased demand and change in company business to keep with changing times and strategy. Still, all other expected expenses have remained generally constant through the years. This demonstrates yet again, though the company seems to carry business with caution, they are stable and have control. Citrix is committed to operational efficiency and value creation.
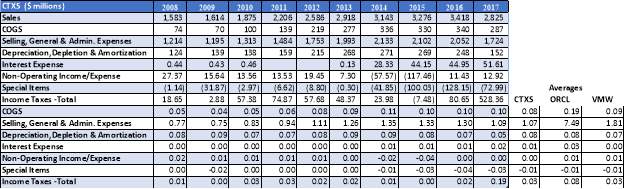
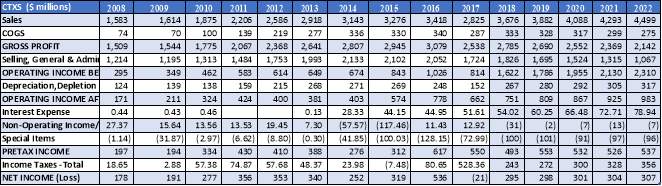
When analyzing the above table, CTXS averages are consistent with the industry and its competitors’ averages. As the amount of sales goes up, COGS slightly increases. Based on this, the following 5-year trend was calculated for COGS, Selling, General & Admin expenses, Depreciation, Interest and the other categories listed. Note that the interest expense is flat through most of the above ten years, with a minimal increase of .02 seen in 2017. An average of .08 was calculated for depreciation, depletion, and amortization.
The following table chart summarizes the next five-year forecast, taking in to account the averages calculated above.
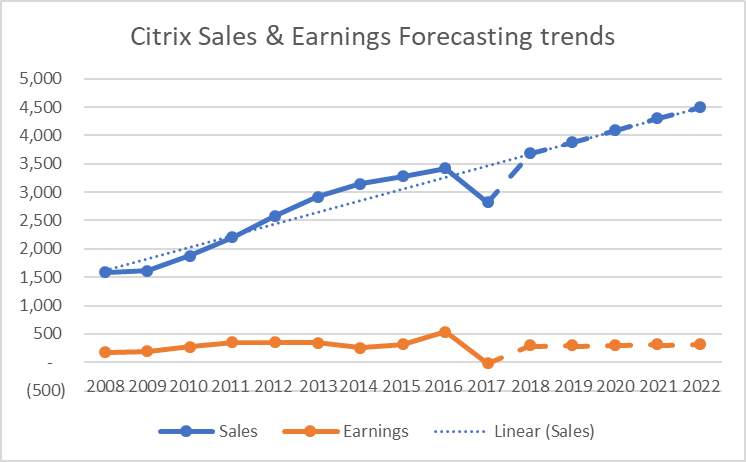
BALANCE SHEET
When comparing past, present and future sales versus earnings, there is an expected growth of sales while earnings are projected to not increase by much more than we now see. The main reasoning behind this is due to a large portion of their deferred income linked to its current sales and renewals of license updates and maintenance solutions. Even with the anticipated 11% growth, the company earnings activity will stay unchanged. The expected growth for the industry is approximately 14%. The company’s focus to attract larger dealings to ensure the company’s well-being. However, these big organizations will undoubtedly request contracts that include special pricing agreements. These longer sale cycle subscriptions will cover multiple years and will also include maintenance. By agreeing to these terms, CTXS may have to defer recognition of these revenues from such sales, consequentially reducing revenues and profits and not allowing themselves to predict accurately their revenue. Still, shown below the growth of sales reduced working capital – falling below the expected industry average. This rise in sales also promoted a gradual increase in Plant, Property & Equipment – where they met and slightly beat the industry average of .324. The one ‘sore thumb’ that definitely sticks out of the trend is the negative $20.7M loss in net income. As previously discussed, this was due to an increase in taxes.
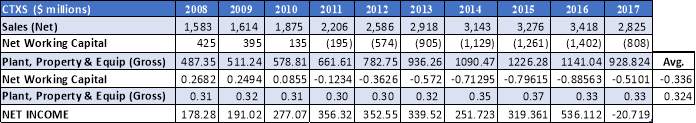
Below a forecast for Net Working Capital, Plant, Property & Equipment have been made using linear trend forecasting.

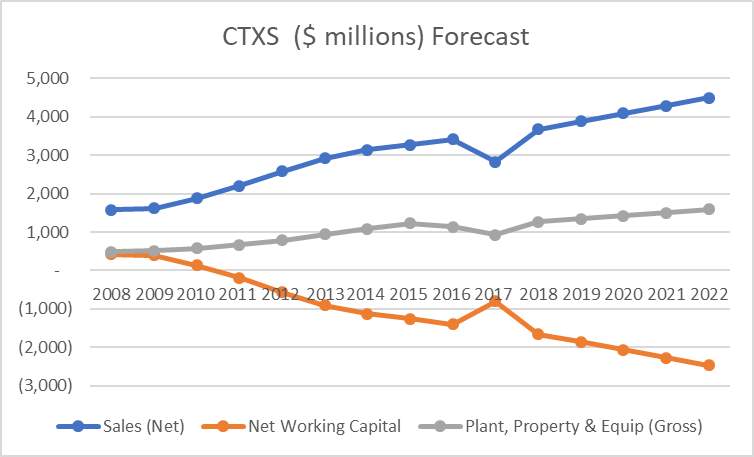
Citrix Net Working capital is forecasted to continue to decrease for the next 5 years, conflicting with the increase 11% growth in sales. This graph also shows how in 2017 Citrix Sales and Plant, Property and Equipment decreased, while Net Working Capital increased that year.
VALUATION
Valuation is the method of defining the current worth of a company. In order to find the value, the company’s management, a structure of capital, the prospect of future earnings and market value of assets are all taken into account. When reviewing the year over year results, Citrix Systems reported varied results through 2017, following a strong 2016. The company established stable revenue growth through both 2016 and 2017. Still, rising operating and revenue costs caused lower margins through December 2017. Additionally, negative income was due to a higher tax expense for the year. However, the company demonstrated an average 11% growth overall. A change of business strategy, expected increased revenues in the company software-as-a-service (SaaS) are anticipated to continue to drive revenue growth. Similarly, services revenues also grew at a similar pace through the first half of the fiscal year, which eventually slowed down to single digits in the latter half. This trend is likely to continue through the current fiscal year as well
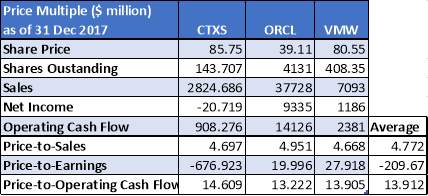
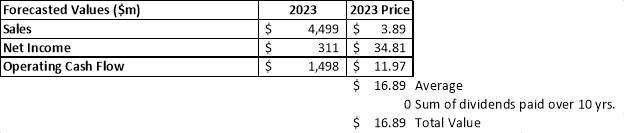
PRICE MULTIPLE
The most common valuation ‘multiple’ that is used to evaluate stock is the Price to Earnings (P/E) NTM. P/E relates the current share price against the industry expectations, in terms of Earnings Per Share. This multiple is used to compare a company’s market value with its earnings. Note that a company with a high P/E NTM is presumed to be overvalued. A company with a low P/E NTM is suspected to be undervalued. As shown below, the P/E NTM ratio for Citrix is significantly lower than both the average and its competitors. Other common multiples used in determining value include the Price to Sales and Price to Earnings. Based on the results, Citrix is considered to be undervalued. The main benefit of this technique is its uncomplicatedness.
Three most commonly used multiples that were identified and considered for this valuation model include Price-to‐Sales, Price‐to‐Earnings, and Price‐to‐Operating Cash Flow. The resulting data for CTXS and its two competitors are shown below accompanied by their respective averages for the identified multiples. CTXS scored below average for both Price-to-Sales and Price-to-Earnings, while scoring higher than average and both competitors when compared to Price-to-Operations Cash Flow.
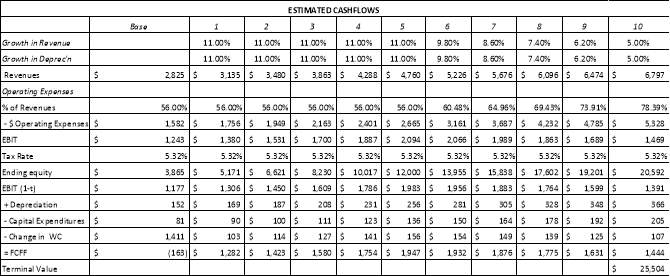
DISCOUNTED FREE CASH FLOW
The valuation method applied to measure the appeal of an investment opportunity is the discounted free cash flow method. This model is used to give investors an estimation of the returns they could receive from the investment adjusted for the time value of money. Future cash flow projections are used to determine present values estimates to help investors determine whether they would like to invest. If the results of the analysis are higher than the current cost of the investment, the opportunity is considered to be a good investment.
This model incorporates different sources of data into many assumptions seen in the below valuation chart:
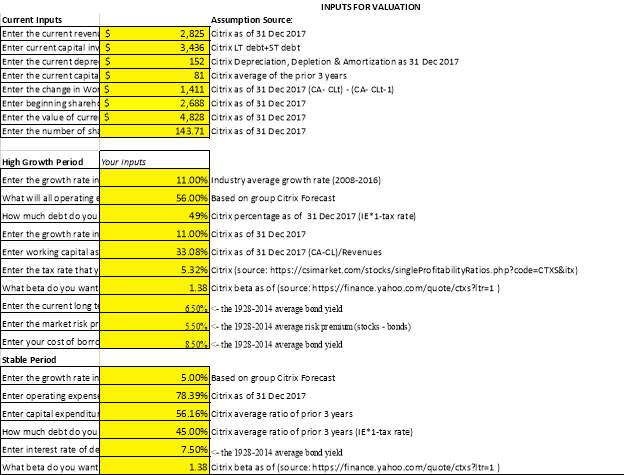
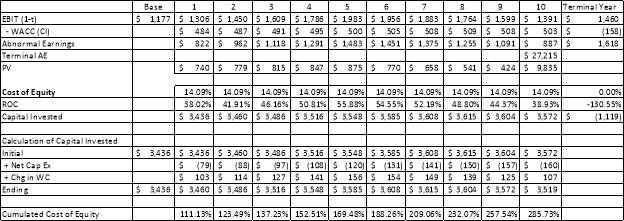
WACC TABLE
A firm’s cost of capital is determined by a calculation where each of its categories of capital is proportionately weighed using a weighted average cost of capital (WACC). All sources of capital, including common stock, preferred stock, bonds and other long-term debt are taken into account. The below table summarizes the cost of equity and capital, taking into account the value of the firm by year. With becoming a more established operation and being competitive and innovative, the WAAC has increased greatly from year to year, reaching an all-time high in 2017 as it more than doubled its amount from 2008 to 285.73%.
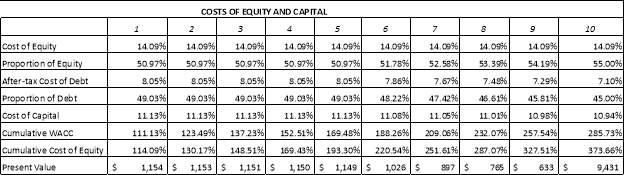
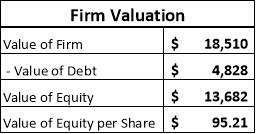
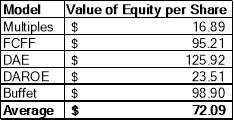
Based on our results, Citrix is a stock that investors should definitely consider financing. With a consistent cost of equity of 14.09%, the value of equity per share was calculated at $95.21 and value of the firm was $18,510. Note that the proportion of equity is stable at approximately 50.9%. The cost of capital is also steady at about 11.1%. Although the average YTD growth rate was around 11%, we project that future growth, due to their conservative nature of the business and reducing risk, and change in business strategy will be around 5%.
DISCOUNTED ABNORMAL EARNINGS
The following valuation model determines a company’s equity value based on book value and earnings. This method takes into account management decisions and whether those decisions helped the company perform better or worse than expected. DAE recommends that investors ought to pay more than the known book value if earnings are higher than expected and pay less than book value if earnings are lower than projected. Based on a consistent cost of equity, steady WAAC and amount of abnormal earnings, and other listed factors, the indicated price per share that was designed for CTXS was $125.95, and a firm value of $18,096. The invested capital from year to year was also stable, at about $3,500/year.
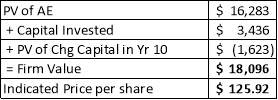
*Note that the indicated price per share of this model vs the discounted free cash flow model is pretty similar, with only a $30 difference (125 vs 95).
DISCOUNTED ABNORMAL RETURN ON EQUITY
?????…..
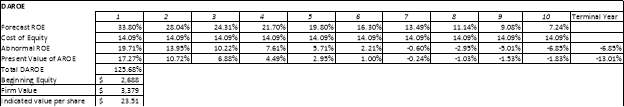
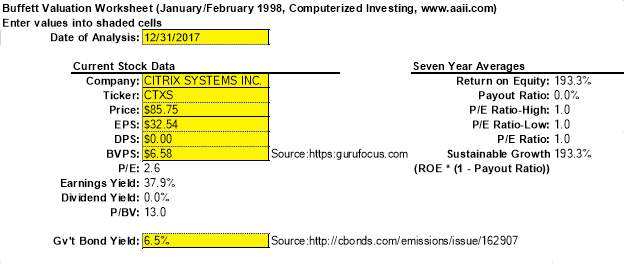
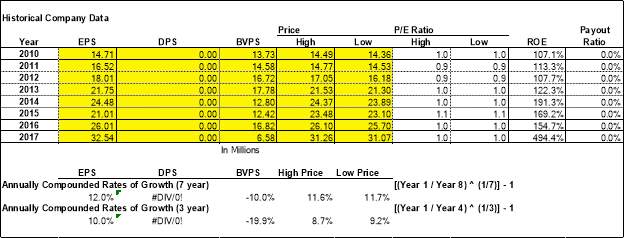
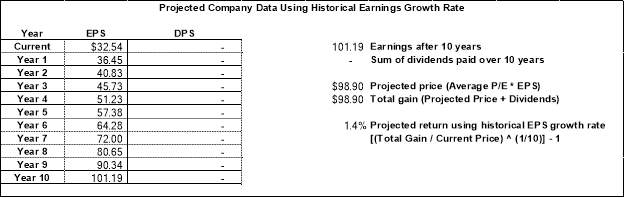
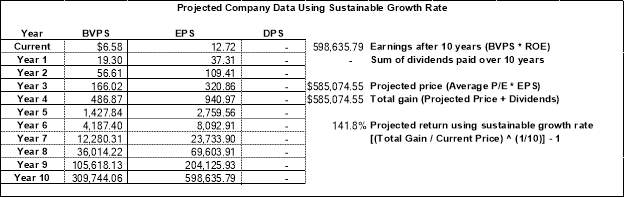
EARNINGS GROWTH (BUFFETT’S MODEL)
Warren Buffett is an American business entrepreneur, investor, and philanthropist who has been deemed one of the most successful investors of all time. This much-respected businessman has shared his business knowledge by creating valuation models and seeks out unique company markets and their success stories and reasonings. He investing style includes qualitative data. As for Citrix, the below summarizes Buffett’s Model. Due to the company’s lack of paying dividends to their shareholders, their rates of growth cannot be calculated with this model. Therefore, this model is not one that our analysis would be able to use/benefit from.
ASSESSMENT OF SOLVENCY
Solvency refers to the long-term financial ability of a business and its ability to cover its obligated long-term fixed expenses. In simple words, solvency is the ability of the company to meet short and long-term debts as they are due.
Solvency for Citrix is very concerning for their investors and creditors. Investors want to be certain that the company is in satisfactory financial standings and can continue to exalt their growth, profits and produce dividends. In other words, investors are looking to receive returns on their investment and, an insolvent establishment that has too much debt will not be able to generate these returns. Secondly, creditors, on the other hand, are more concerned with being continuously repaid. If Citrix can’t generate enough revenue to cover their current expenses, they more than likely won’t be able to pay off new obligations.
CALCULATION OF ALTMAN Z-SCORE MODEL
Altman’s Z-score is the output of a credit strength test that gauges a publicly traded manufacturing company’s possibility of bankruptcy. Below is the formula used to determine Citrix’s Z-core, as well as the Z-score for Citrix, as of now.
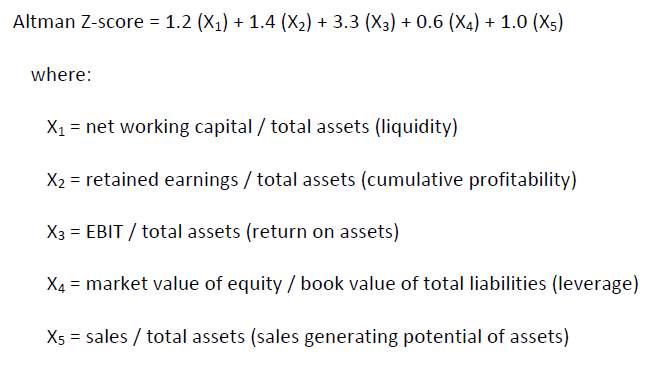
Citrix Systems has a Z-score of 4.01, demonstrating that they are in the safe zones. During the past 13 years, Citrix highest Z-score was 66.56 and the lowest was 2.5, with an average of 5.50. The z-score zones of discrimination are based on the following criteria:
- When Z-score is less than 1.81, it is in Distress Zones.
- When Z-score is greater than 2.99, it is in the Safe Zones.
- When Z-Score is between 1.81 and 2.99 it is in the Grey Zones
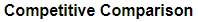
COMPETITIVE COMPARISON
Competitive companies are chosen from companies within the same industry, with headquarters located in the same country, with closest market capitalization; x-axis shows the market cap, and the y-axis shows the term value; the bigger the dot, the larger the market cap.
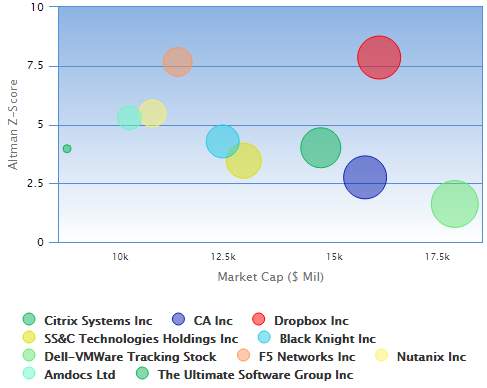
DEBT RATING
Debt rating is a system for measuring a company’s ability to pay back short and long-term debts, as well as the interests on those debts. Most companies are usually rated by three institutions: Moody’s, Standard and Poor & Fitch. The source we will use to gather our debt rating for Citrix will come from Standard and Poor being that they are the most reliable and updated platform for most companies. Debt is ranked from AAA being the best to D being the worst.
According to S&P Citrix was originally rated BBB. This rating is not the best yet, it is also not the worst. This shows that Citrix business risk profile reflects a successful trend of profitable operations and great long-term growth. Even though Citrix has a good position in the market. They are still being threatened by their competitors who are greater and more diversified. If they would like a higher rating they would need to be more diverse in their products while still having exalting profitable operations.
CONCLUSION
Citrix is an innovative company known for helping consumers attain lesser operating costs and better security boundaries by supporting virtual computing over networks. They accomplish this by facilitating virtual experiences on remote devices permitting more workers in different locations to use corporate networks and applications at the same time. As discussed in this report, CTXS is growing steadily, generating a higher return on investments, establishing higher cash flow per share and, because of their cautions business decisions, reflect lower financial risk. We are impressed by the company’s efforts to expand its customer and product portfolio – improving operational performance and efficiencies. Citrix has an ROE of 45.2%, a lot better than the industry average of 30.3%. This shows that the company reinvests its cash more efficiently. Citrix should be able to balance its core businesses by giving them more time and R&D dollars to continue innovating and becoming a stronger competitor in the industry. For this reason, we believe that, for now, with the transitioning of business strategy and a challenging FY 2017, that at this time we would HOLD company stock.
[1] “Citrix Systems.” International Journal of Advanced Research in Computer and Communication Engineering, vol. 7, no. 3, Mar. 2018
[2] en.wikipedia.org/wiki/Citrix
[3] https://investors.citrix.com/sec-filings/sec-filing/10-k/0000877890-18-000025
[4] “Technology Sector Scorecard.” Technology: Industries: PwC, PricewaterhouseCoopers, 1 Dec. 2017, www.pwc.com/gx/en/industries/technology/publications.html.
[5] Sallomi, Paul. “2018 Technology Industry Trends | Deloitte US.” Deloitte United States, Deloitte Development LLC, 13 Feb. 2018, www2.deloitte.com/us/en/pages/technology-media-and telecommunications/articles/technology-industry-outlook.html.
[6] Technology Sector Scorecard.” Technology: Industries: PwC, PricewaterhouseCoopers, 1 Dec. 2017, www.pwc.com/gx/en/industries/technology/publications.html.
[7] “Institute for Strategy & Competitiveness.” Strategic Positioning – Institute for Strategy and Competitiveness – Harvard Business School, www.isc.hbs.edu/strategy/business-strategy/Pages/the-five-forces.aspx.
[8] “Citrix 2017 Annual Report.” Citrix, Inc., https://investors.citrix.com/static-files/35908e75-270b-4412-9057-f7d302018858.
[9] “Oracle Fiscal Year 2017 10-K Annual Report.” Oracle Corporation, http://investor.oracle.com/financial-reporting/sec-filings/sec-filings-details/default.aspx?FilingId=12146857.
[10] “VMware, Inc. 2017 Annual Report.” VMware, Inc., http://s2.q4cdn.com/112802898/files/doc_financials/2017/VMWare-2017-Form-10K.pdf.
[11] “Microsoft 2017 Annual Report.” Microsoft Corporation. https://www.microsoft.com/investor/reports/ar17/index.html.
[12] “Oracle Corp. (ORCL) Summary of Investments.” Stock Analysis on Net (Oracle Corporation), https://www.stock-analysis-on.net/NYSE/Company/Oracle-Corp/Analysis/Investments#Accounting-Policy.
[13] https://wrds-web.wharton.upenn.edu/wrds/ds/comp/fundafinstat/index.cfm?navId=92
[14] Henshall, David. “Q3’17 Financial Results & Multi-Year Business Transformation.” Citrix, 25 Oct. 2017, investors.citrix.com/static-files/4967cbed-8cc2-4697-8ff8-7e0cd9c3bd59.
[15] “Annual Report 2014.” Citrix, https://investors.citrix.com/static-files/a06ce992-526e-412e-8f2d-e83bb3d4d65a.
[16] Annual Reports, www.annualreports.com/HostedData/…/c/NASDAQ_CTXS_2014.pdf
[17] “Oracle Financial Services Software Limited Annual Report”, Oracle Financial Services, http://www.oracle.com/us/industries/financial-services/ofssl-annual-report-2014-15-2628306.pdf.
[18] “Operating Cash Flow Ratio”, Investopedia Staff , https://www.investopedia.com/terms/o/ocfratio.asp.
[19] “Annual Report 2014.” Citrix, https://investors.citrix.com/static-files/a06ce992-526e-412e-8f2d-e83bb3d4d65a.
[20]“What is driving earnings margins.” SimplyWall, https://simplywall.st/stocks/us/software/nasdaq-ctxs/citrix-systems/news/citrix-systems-inc-nasdaqctxs-what-is-driving-earnings-margins/
Cite This Work
To export a reference to this article please select a referencing stye below:
Related Services
View all


Related Content
All TagsContent relating to: "Finance"
Finance is a field of study involving matters of the management, and creation, of money and investments including the dynamics of assets and liabilities, under conditions of uncertainty and risk.
Related Articles

DMCA / Removal Request
If you are the original writer of this dissertation and no longer wish to have your work published on the UKDiss.com website then please: