A Bayesian Approach to Detect the Firms with Material Weakness in Internal Control
Info: 3885 words (16 pages) Dissertation
Published: 17th Dec 2019
Tagged: Accounting
Abstract
Capturing of relevant patterns in company’s financial data and the implications on the reporting are important for various financial statement users to identify the triggers of the significant deficiencies and material weaknesses. The objective of this study is to construct a company-specific risk score for the companies’ internal weaknesses, as well as to uncover the conditional relations between the independent predictors of firms’ material weaknesses. To do so, Tree Augmented Naive Bayes Network (TAN) algorithm is employed to analyze the data obtained from COMPUSTAT (Research Insight) for one year before the Material Weakness in Internal Control (MWIC) disclosure on several operating and financial ratios such as total asset turnover, profitability, capital intensity, size, current ratio, and operating performance. The proposed TAN method provides novel information on the interactions among the predictors and the conditional probability of MWIC for a given set of relevant firm characteristics.
Keywords
Data mining, Machine learning, Bayesian belief network, Logistic regression
1. Introduction
In recent years, internal controls have played a crucial role within corporate governance for both companies and auditors alike[1–4]. A lapse in systematically securing and double checking these controls can be very costly to companies, both financially and to its reputation; to curb this, Congress mandated compliance to ICOFR reporting for companies[5, 6]. This mandate, SOX, was put in place to protect investors from fraud, loss of investments, and the restoration of investor confidence. SOX also serves as a tool to improve the reliability of financial reporting, for which, to guarantee investor confidence, the full financial health, including all material weaknesses a certain company has by year-end will be fully disclosed[5]. A recent example of the cost of a sub-standard reporting control was that of Wells Fargo, which led to the opening of two million dummy accounts, an infraction which cost the bank over $185 million in fines and inestimable damage to the Wells Fargo brand[7].
Wagner and Dittmar[8] discussed that most companies were surprised at the weaknesses SOX reviews and assessments exposed in their organizations. This was due to a lack of a more comprehensive view of the complete financial picture, which excluded potential weaknesses and patterns as such. To this token, the study of underlying internal control weaknesses and significant deficiencies within a company or organization cannot be overlooked; it enables the capture of significant patterns in a company data, and the implications of reporting such lapses and weaknesses will help those privy to the financial statements an opportunity to identify significant material weaknesses pertinent to them.
In this study, we develop machine learning algorithms to predict MWIC firms. Our objective is to answer the following questions: What is the best performing model as far as interpretation is the concern? Can we predict MWIC firms before their disclosure? What kind of dependency structures exists among the variables?
The rest of this paper is organized as follows: in section 2, data analytics methodology is introduced and the steps in the methodology are explained. In section 3, classification results are discussed. Lastly, a brief conclusion is provided in the final section.
2. Methodology
In this study, a business analytics approach consisting of 3 main steps has been proposed. In the first step, the data is obtained from the COMPUSTAT database and the observations with missing values and outliers are eliminated. In the second step, one machine learning Bayesian belief network model and traditional statistical model logistic regression are employed to predict the firms with MWIC. In step 3, the best performing model in terms of performance metrics is determined and used to explore relationships among the variables as well as predicting firms with MWIC.
2.1 Data Acquisition
As mandated by SOX[6], firms need to disclose the material weakness in internal control. In this study, the data consisting of such firms that had disclosed MWIC and a control group of firms that had not disclosed MWIC were used. 395 firms were randomly selected from a population of firms that had disclosed MWIC as identified by Doyle et al[9], while a control group of 395 firms that had not disclosed MWIC was randomly selected from Yahoo finance website. Indicator variables such as Tobin’s Q, total asset turnover, LNsale, etc. were collected for each firm using the COMPUSTAT (research insight) database. It should be noted that these indicators for the firms were obtained one year before the MWIC disclosure.
2.2 Data Understanding and Preparation
After the collection of the data, we removed outliers and missing values in the variables which in turn gives us the data with 605 observations and 23 variables. Moreover, to be able to fit the TAN model some steps are taken as the TAN model requires categorical variables to explore the relation between the response variable and the covariates[10]. In order to satisfy the categorical variable requirement, all numerical variables in the data must be categorized. However, categorization of the numeric variable, especially the variable with decimal places, causes to have as many categories as the number of observations in the data. When this situation exists as in our case, TAN model cannot find any structure to set a Bayesian belief network. In order to overcome this issue, we then first round the variables after which the TAN model is fit the data. In the table 1, the description of variables is given.
Table 1. Description of the Data
| Variables | Description |
| X1-year total return | Total Return concepts are annualized rates of return reflecting price appreciation plus reinvestment of monthly dividends |
| Auditor Opinion | This item contains the code that indicates whether the auditor’s opinion is qualified or unqualified. |
| Dividend Payout | Dividend payout ratio |
| Employees | Number of company employees |
| Total Inventory | Represents merchandise bought for resale and materials and supplies purchased for use in production of revenue |
| Price to Book ratio | Price to Book ratio |
| Price to Earnings ratio | Price to Earnings ratio (PE ratio) |
| Return on Assets | Return on Assets is Income Before Extraordinary Items – Available for Common, divided by Total Assets |
| EPS – Basic | This item represents Basic earnings per share before extraordinary items and discontinued operations |
| Extra Items | This item represents unusual items designated by the company as extraordinary |
| Current Ratio | Current assets / Current liabilities |
| Inventory Turnover | Inventory Turnover is Cost of Goods Sold divided by the average of the current year’s Total Inventories and the prior year’s Total Inventories. |
| Return on Equity | Income Before Extraordinary Items divided by common equity |
| Total Asset Turnover | This item is Net Sales divided by the average of the current year’s Total Assets and prior year’s Total Assets. |
| Gross Margin | Gross profit / Net sales |
| LNEMP | Natural Logarithm of Number of Employees |
| LNTA | Natural Logarithm of Total Assets |
| LNSale | Natural Logarithm of Sales |
| IntanTA | Intangible Assets / total assets |
| Tobin’s Q | [T. Assets + Market value of Equity – Book value of Equity]/ T. Assets |
| CapInt | Capital expenditure / Net Property Plant Equipment |
| Inv.CA | Inventory / Current Assets |
2.3 Classification Models
Classification models try to draw a conclusion from the observed values and then are used to predict a categorical target variable. In this study, we have used two classification methods called Logistic Regression and TAN. A brief description of these methods is given in the below sections.
2.3.1 Logistics Regression
The Logistic regression is a member of the generalized linear models (GLM) and a statistical method to model the existing relationship between a dichotomous response variable and a set of explanatory variables[11]. If the response variable has a binary outcome, GLM uses the logit link function to model log of an odds[12]. This special case of GLM is called logistic linear regression. The mathematical definition of the logistic regression is

Where  is success probability of the response variable at the value of x,
  and
and  are the coefficients of the logistic regression model.
2.3.2 Tree Augmented Naive Bayes
A probabilistic graphical model that uses a directed acyclic graph(DAG) to describe a set of variables and their conditional dependencies is called Bayesian network[13]. Bayesian network is constructed by interconnected nodes, where interconnected nodes represent random variables and connecting edges(arcs) show how these variables are related to each other[14]. The set of parents for each  is shown by
  and mathematical representation of the Bayesian Network chain rule is[15]:

In Bayesian Belief, Naive Bayes model can be used to learn existence Bayesian structure. However, Naive Bayes assumes independency among the predictors which is an unrealistic assumption in real life. This situation can be overcome by using the TAN model which relaxes independency assumption by augmenting a tree structure in which variables depend on a target variable and one non-target predictor variable. In order to embed dependency among the nodes, TAN model sets parent and child relation between the variables, where child node (variable) effect on the model decision is dependent on its parent[10].
2.4 Performance Evaluation Metrics
To assess the model performance, four different performance metrics; sensitivity, specificity, accuracy and AUC are used. Definition of each metrics is as follows: sensitivity is the measure of the ability of the model in detecting MWIC firms when they in fact are MWIC (true-positive). In that vein, specificity is the measure of the model’s ability to detect not MWIC firms when they in fact are not MWIC (true-negative). Accuracy measures how many times the model correctly classifies the firms as an MWIC or not. Finally, AUC shows how the model performs in classification when different decision threshold is introduced. In this study, since we have a small sample size, accuracy and AUC metrics are used to evaluate the model performance.
3. Results
3.1 K-Fold Cross Validation
It is customary to split data to validate the model performance[15–20]. However, the random splitting of the data can introduce a bias into the model outcomes. In order to circumvent the bias, researchers are inclined to used k-fold cross-validation technic[22]. The formula of the cross validation technic is as follows[18]:
Where CVA stands for cross-validation accuracy and performance measure for each fold and the number of fold used are represented by PM and k, respectively.
3.2 Classification Results
TAN model and Logistic regression model are trained and their performances are evaluated on the test sets. It can be observed from Table 2 that the TAN model outperforms the Logistic regression model in terms of accuracy (0.7206612) and sensitivity (0.7539683) metrics. The Logistic regression model gives slightly better AUC (0.8015806) results than does the TAN model. Likewise, the Logistic regression model beats the TAN model in terms of specificity (0.7343254) metric. Here, since we have a small sample size we choose the accuracy metric to make a decision on the better performing model. Therefore, we go on to explore the TAN model in the following section in depth. With that in mind, besides its high performance, the TAN model allows us to explore dependency not only between the response and explanatory variables as in the logistic regression model but also allows us to explore casual dependency among the variables.
Table 2. Performance Results of TAN and Logistic Regression Models
| TAN | ||||||
| Fold no. | Confusion matrix | Accuracy | Sensitivity | Specificity | AUC | |
| 1 | 40 | 14 | 0.7355372 | 0.7777778 | 0.6896552 | 0.8071976 |
| 18 | 49 | |||||
| 2 | 42 | 17 | 0.7272727 | 0.7301587 | 0.7241379 | 0.773399 |
| 16 | 46 | |||||
| 3 | 40 | 15 | 0.7272727 | 0.7619048 | 0.6896552 | 0.7906404 |
| 18 | 48 | |||||
| 4 | 36 | 15 | 0.7024793 | 0.765625 | 0.6315789 | 0.8007127 |
| 21 | 49 | |||||
| 5 | 39 | 17 | 0.7107438 | 0.734375 | 0.6842105 | 0.8337445 |
| 18 | 47 | |||||
| Mean | 0.7206612 | 0.7539683 | 0.6838475 | 0.8011388 | ||
| Std. dev. | 0.0135799 | 0.02071564 | 0.03325248 | 0.02224711 | ||
| Logistic Regression | ||||||
| Fold no. | Confusion matrix | Accuracy | Sensitivity | Specificity | AUC | |
| 1 | 52 | 19 | 0.7459016 | 0.6724138 | 0.8125 | 0.8485991 |
| 12 | 39 | |||||
| 2 | 44 | 16 | 0.7083333 | 0.7192982 | 0.6984127 | 0.7889167 |
| 19 | 41 | |||||
| 3 | 41 | 15 | 0.6916667 | 0.7368421 | 0.6507937 | 0.7816764 |
| 22 | 42 | |||||
| 4 | 40 | 20 | 0.6446281 | 0.6551724 | 0.6349206 | 0.7378216 |
| 23 | 38 | |||||
| 5 | 56 | 16 | 0.8032787 | 0.7241379 | 0.875 | 0.850889 |
| 8 | 42 | |||||
| Mean | 0.7187617 | 0.7015729 | 0.7343254 | 0.8015806 | ||
| Std. dev. | 0.05962042 | 0.03560388 | 0.1049395 | 0.04812439 | ||
3.3 Exploring the Relation in the Bayesian Belief Network
In the Bayesian network, random variables are represented by nodes. An arrow represents the conditional dependency between the nodes. The node at the starting point of the arrow is called the parent while the node at the end of the arrow is called the child node. Parent-child relation in the Bayesian network can be summarized as follows: the impact of child node on the model outcome (Firm.Type) is dependent on its parent, while the impact of parent node on the model outcome is independent of its child. As seen in Figure 1, the contribution of all variables except X1.year.total.return depends on other variables. In other words, these variables do not have a direct effect on the model outcome, while X1.year.total.return has. Also, X1.year.total.return is the parent of two variables Total.Asset.Turnover and CapInt. This is to say that effect of Total.Asset.Turnover and CapInt on the model outcome is conditional to the X1.year.total.return. Similarly, Return.on.Assets is the parent of CFsale variable. Namely, the impact of CFsale variables on the model outcome depends on Return.on.Assets. Figure 1 can be investigated more meticulously by a domain expert in order to gain a deeper insight into interactions between the variables.
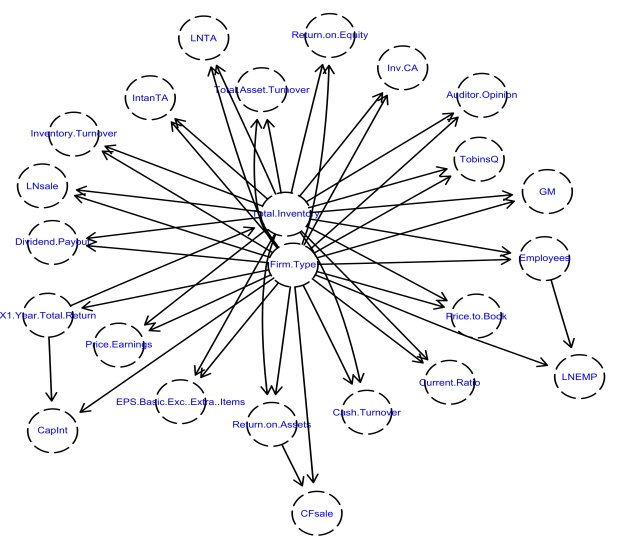
Figure 1: Bayesian Network
4. Conclusion
In this study, we have formulated a data mining methodology to provide investors, auditors and analysts with better accurate financial reports by enabling firms to utilize available resources more efficiently. Our study has contributed to the existing body of knowledge by; 1) applying machine learning models for predicting MWIC so that firms can avoid from bankruptcy and 2) displaying dependency and causality relationships among the predictors. Most importantly, the methodology can be used to influence decisions made by experts. These experts can evaluate the patterns and factors from the data mining methodology to make better informed decisions. This leads to a better a timely-red-flag indication for firms likely to declare MWIC in the future, which in turn can aid in reducing the bankruptcy rates for firms.
References
[1] COSO, “Committee of Sponsoring Organizations of the Treadway Commission (COSO). (2013).The 2013 COSO Framework: Internal Control Integrated Framework. Jersey City, NJ.,” 2013. .
[2] “American Institute of Certified Public Accountants (AICPA). (1988). Consideration of Internal Controls in Financial Statement Audit. Statement on Auditing Standards No. 55. New York, NY: AICPA.”
[3] “American Institute of Certified Public Accountants (AICPA). (1995). Consideration of Internal Controls in Financial Statement Audit. Statement on Auditing Standards No. 78. New York, NY: AICPA.”
[4] “American Institute of Certified Public Accountants (AICPA). (2001). The Effect of Information Technology on the Auditor’s Consideration of Internal Control in a Financial Statement Audit.”
[5] PinerK, “PCAOB Release – An Audit of Internal Control Over Financial Reporting Performed in Conjunction with an Audit of Financial Statements,” 2002.
[6] “U.S House of Representatives. (2002). The Sarbanes-Oxley Act of 2002. Public Law 107-204 [H.R. 3763].Washington, DC: Goverment Printing Office.” Washington, DC: Goverment Printing Office., 2002.
[7] “Rapoport, M. (2016). Wells Fargo: Where was the auditor? The Wall Street Journal, November 1.”
[8] S. Wagner and L. Dittmar, “The unexpected benefits of Sarbanes-Oxley.,” Harv. Bus. Rev., vol. 84, no. 4, p. 133–40; 150, Apr. 2006.
[9] J. T. Doyle, W. Ge, and S. McVay, “Accruals Quality and Internal Control over Financial Reporting,” Account. Rev., vol. 82, no. 5, pp. 1141–1170, Oct. 2007.
[10] F. Zheng and G. I. Webb, “Tree Augmented Naive Bayes,” in Encyclopedia of Machine Learning, Boston, MA: Springer US, 2011, pp. 990–991.
[11] D. W. Hosmer and S. Lemeshow, Applied Logistic Regression, no. 1. 2000.
[12] A. Agresti, Categorical Data Analysis, vol. 45, no. 1. 2002.
[13] A. Dag, A. Oztekin, A. Yucel, S. Bulur, and F. M. Megahed, “Predicting heart transplantation outcomes through data analytics,” Decis. Support Syst., vol. 94, pp. 42–52, Feb. 2017.
[14] J. Pearl, “Bayesian networks: A model of self-activated memory for evidential reasoning,” 1985.
[15] D. Koller and N. Friedman, Probabilistic graphical models : principles and techniques. MIT Press, 2009.
[16] O. Hatice, S. Simsek, K. Ugur, K. Eyyub, and D. Ali, “A Machine Learning-Based Holistic Approach to Predict the Survival of Breast Cancer Patients,” 2018.
[17] E. Kibis, E. Buyuktahtakin, and A. Dag, “Data analytics approaches for breast cancer survivability: comparison of data mining methods,” Proc. 2017 Ind. Syst. Eng. Conf.
[18] K. Topuz, F. D. Zengul, A. Dag, A. Almehmi, and M. B. Yildirim, “Predicting graft survival among kidney transplant recipients: A Bayesian decision support model,” Decis. Support Syst., vol. 106, pp. 97–109, Feb. 2018.
[19] O. Genç and A. Dağ, “A machine learning-based approach to predict the velocity profiles in small streams,” Water Resour. Manag., vol. 30, no. 1, pp. 43–61, Jan. 2016.
[20] D. Delen, R. Sharda, and P. Kumar, “Movie forecast Guru: A Web-based DSS for Hollywood managers,” Decis. Support Syst., vol. 43, no. 4, pp. 1151–1170, Aug. 2007.
[21] A. Oztekin, D. Delen, and Z. (James) Kong, “Predicting the graft survival for heart–lung transplantation patients: An integrated data mining methodology,” Int. J. Med. Inform., vol. 78, no. 12, pp. e84–e96, Dec. 2009.
[22] A. Dag, K. Topuz, A. Oztekin, S. Bulur, and F. M. Megahed, “A probabilistic data-driven framework for scoring the preoperative recipient-donor heart transplant survival,” Decis. Support Syst., vol. 86, pp. 1–12, Jun. 2016.
Cite This Work
To export a reference to this article please select a referencing stye below:
Related Services
View all


Related Content
All TagsContent relating to: "Accounting"
Accounting is the profession or activity of keeping financial records and statements. In business this usually includes bookkeeping, the preparation of financial statements including profit and loss, balance sheets and management accounts.
Related Articles

DMCA / Removal Request
If you are the original writer of this dissertation and no longer wish to have your work published on the UKDiss.com website then please: