Australian Wheat Industry Evaluation
Info: 12616 words (50 pages) Dissertation
Published: 4th Feb 2022
Tagged: MarketingAgriculture
Abstract
Indonesian mills primarily use American soft white wheat (SWW) to make the flour for the large and growing cake and biscuit market. Following recent research, it is believed that Australian Noodle Wheat 2 (ANW2) has similar functionality when milled, and may compete strongly in this market. However, Indonesian mills may be reluctant to switch from using SWW to ANW2, due to limited storage capacity and uncertainties in wheat price, flour yield and the effect on flour quality. This project aims to apply the Real Options Approach to examine the decision-making rationale for Indonesian mills switching from SWW to ANW2, given the uncertainties associated with using ANW2. The findings suggest that Indonesian mills are willing to bear a cost in learning and delaying the purchasing decision in order to resolve uncertainty over the quality of ANW2. However, earlier access to ANW2 is indicated when the wheat price differential is significant. Mills with higher storage capacity are better placed to switch earlier. These results identify target mills for grain marketers. This study provides the Australian wheat industry with a better understanding of the drivers that influence mills to switch wheat supply, which will assist marketers in developing strategies to influence or promote? the purchase of Australian wheat.
Contents
1. Introduction
2. Material and Method
2.1 The Real Options Milling model (ROM)
2.1.1 Net present value (NPV)
2.1.2 Option Value (OV)
2.2 Data
2.3 Software
2.4 Correlation matrix
2.5 Distribution fitting
2.6 Personal conversation
3. Results and Discussion
3.1 Correlation matrix
3.2 Distribution fitting
3.2.1 Wheat price
3.2.2 Flour price
3.4 Personal conversation results
3.4.1 Cost of learning
3.4.2 Scenarios
3.5 The Real Options Milling model (ROM)
3.5.1 Mills’ decisions are influenced by flour yield and storage capacity
3.5.2 Mills’ decisions are driven by the wheat price differential
3.5.3 Mills’ decisions are more driven by the wheat price differential or wheat quality?
3.6 Option Value (OV)
3.7 Willingness to pay (WTP)
4. Conclusion and future implications
Appendix 1
Appendix 2
References
1. Introduction
Australian Noodle Wheat (ANW) is a wheat class that Japan and South Korea demand for udon noodle production due to its specific starch gelatinisation characteristics. In order to be classified as ANW1, wheat receivals need to fall within a tight protein window of 9.5-11.5% (Grain Trade Australia, 2016). Weather fluctuations and the range of farming practices impose variability risks on farmers and they cannot guarantee that their wheat’s protein level will always lie in this range. Grain that falls outside of the 9.5-11.5% protein range is classified as ANW2 (Grain Trade Australia, 2016).
The price of ANW2 shows higher variance than the other comparable wheat classes. For example, in February 2014 the price obtained for ANW2 was nearly equivalent to the high quality ANW1, but by August to October in the same year the price offered to farmers for ANW2 was below the feed wheat price, with feed wheat generally considered the lowest quality wheat (Siah et al., 2016). This price volatility is primarily due to limited direct demand as there are currently no end-products that specifically require ANW2 quality wheat (Siah et al., 2016). The Australian Export Grains Innovation Centre (AEGIC) has identified a potential of ANW2 for the production of cake and biscuits for Indonesia and research is underway to confirm this opportunity. For the purpose of this thesis the assumption has been made that ANW2 is suitable for this market.
Indonesia is the largest importer of Australian wheat, with a value of $1.29 billion in 2015, accounting for 21% of total Australian grain exports in that year (Australian Export Grains Innovation Centre, 2015). Australian wheat generally accounts for 40-69% of annual Indonesian wheat imports (Grain Growers, 2016). In particular, Indonesian buyers consider Australian white wheat as a superior choice for noodles, with its colour, colour stability and texture properties highly valued (Grain Growers, 2016).
In Indonesia, approximately 52% of flour goes into the production of noodles, 22% for breads, 4% for biscuits and 2% for cakes (Welirang, 2017). The consumption of cake and biscuit products in Indonesia is growing steadily, by approximately 1,000 tonnes a year since 2011 (Euromonitor, 2016). This is largely driven by the wider distribution networks of manufacturers and the rapid expansion of retail outlets across the country, especially the rise of convenience stores. Urban consumers are living increasingly busy lives and prefer to consume ready-to-eat and convenient breakfast items and/or snacks between meals or both (Euromonitor, 2016). This, includes many types of baked goods (Euromonitor, 2016).
Currently, Indonesia’s soft wheat market is dominated by the United States, where Soft White Wheat (SWW). American SWW is used in production of flour destined for Indonesian cake and biscuit products. It has been reported that Indonesia purchased 345,400 tonnes of U.S. wheat in 2103/14 (June/May) and 59% was soft white wheat (Pastor and Scoville, 2013). While the Indonesian mills are currently using SWW, Australia is positioned to supply ANW2 into the Indonesian market at a competitive price. ANW2 has similar quality attributes to SWW (Siah et al., 2016).
Despite the possibility of price and freight advantages inherent in a switch to ANW2, other factors influence the decision to continue using SWW. This behaviour could be interpreted as the action of a risk averse agent, or accepting the cost of holding an option to switch to ANW2 at a later date when uncertainty regarding supply, freight and price are resolved. There is currently a research gap in understanding the key drivers of this decision. The current understanding is that these key drivers are not always fixed values. The price differential between the two classes is variable, as is supply, as is quality.
A flour mill’s approach to managing risk and the costs of purchasing wheat from a new origin can be analysed using economic models. Mill managers can build a management economic model in Microsoft Excel spreadsheets and parameterise the models, for example making specific changes in the mill’s input cost structure to analyse the effects on mill efficiency, earnings, and returns (Elieser S. Posner and Hibbs, 2005). The real options approach (ROA) is a recent method, applicable to this type of problem and extends risk analyses to more difficult choices, such as whether to accept or defer new investments, expand or abandon the operation, and switching inputs or outputs (Hertzler et al., 2013). ROA is often used when expected returns are variable and costs are indivisible and irreversible (Featherstone and Kastens, 2000; Hertzler et al., 2013). This project has selected the ROA, because the shipment cost of wheat to a mill is largely indivisible. Mills purchase a ship load of wheat (or a hatch), which could be 10,000 to 60,000 tonnes at a time, due to the irreducible size of the ship. Another example of the appropriateness of ROA is when quality differences require significant investment costs to recalibrate the infrastructure, which may be partially or completely irreversible, and there is a real effect on the quality of the product and on the market for that product. For these reasons, this project has selected the ROA to identify the conditions under which an Indonesian mill is likely to switch from American Soft White Wheat (SWW) to Australian Noodle Wheat (ANW2).
Hypothesis: Indonesian millers choose to accept a known cost, to delay the decision on whether to switch from purchasing SWW to ANW2, with which to supply their customers with flour suitable for cake and biscuit making. To paraphrase, in order to resolve uncertainty over the quality of ANW2, millers are willing to bear a cost in learning, prior to committing to purchase.
2. Material and Method
2.1 The Real Options Milling model (ROM)
The Real Options Milling model (ROM) is an economic model developed for this study. It has been adjusted based on the ‘Flour Milling Feasibility Template’ designed by Oklahoma State University (Rodney and Holcomb, 2004). While the original model was developed using units of ‘bushels’ and ‘$/bu’, for the purpose of this study the values in the model have been converted to ‘tonnes’ and ‘$/t’ by multiplying the values by 36.743 (U.S Wheat Associates, 2017). The ROM had five main components: management options, control functions, input values, variable cost, fixed cost, calibration cost, output values and financial outcome (Figure 1).
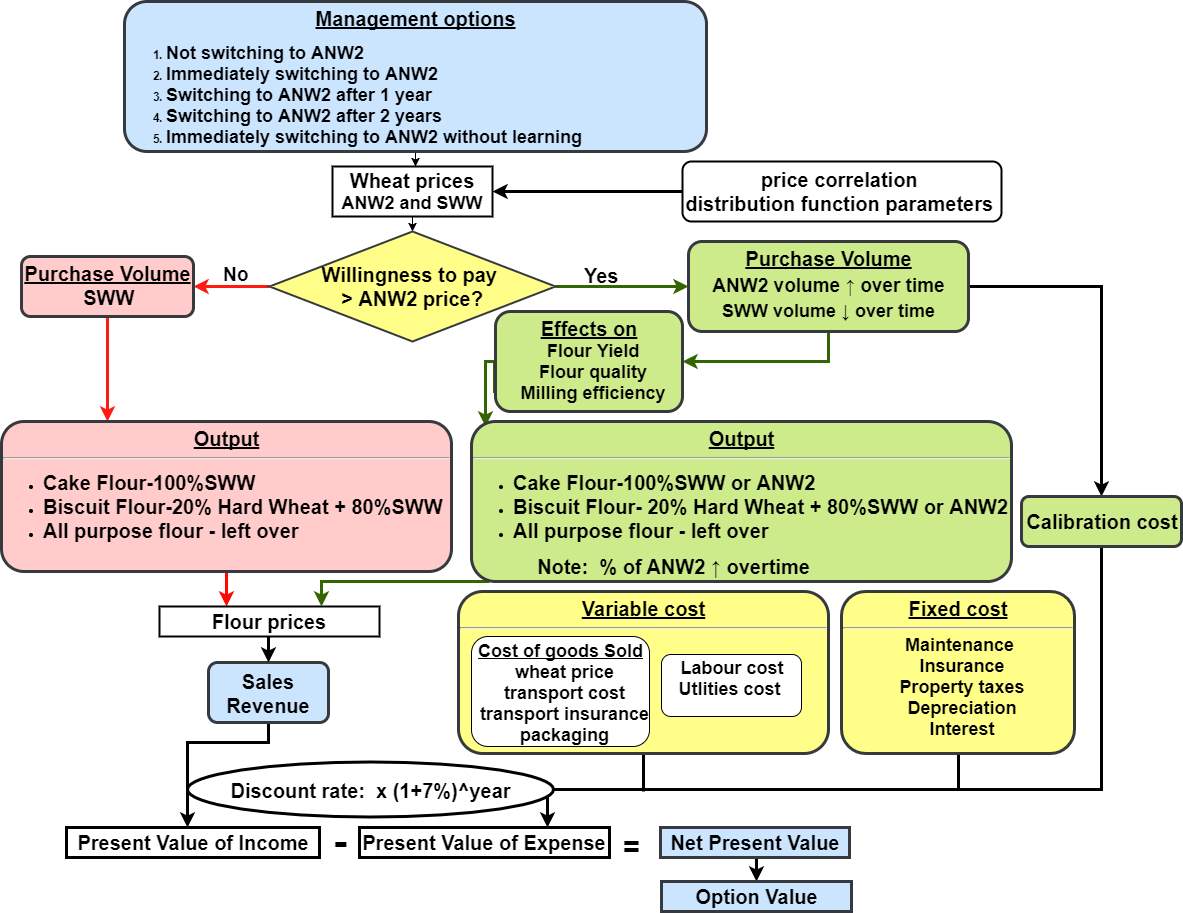
Figure 1. The flow chart of applying the Real Options Approach in modelling Indonesian mills’ decisions. Willingness to Pay (WTP) is the maximum amount the investor accepts to pay for the investment (Le Gall-Ely, 2009). A $10 WTP means that the mill is only willing to switch, if ANW2 is at least $10 cheaper than SWW.
The management options available to the mill were whether to accept, delay, or suspend the opportunity of switching to ANW2. Control functions included the mills’ willingness to pay, and willingness to invest in learning about how to use ANW2 (calibration cost). Low storage capacity means that the mills have limited storage and it is costly for mills to switch back to SWW after purchasing ANW2, hence an element of irreversibility. High storage capacity means that the mills can have multiple switches between SWW and ANW2 as long as the price differential exceeds their willingness to pay (WTP). Quality differences will affect flour yield, flour quality and milling efficiency.
Input values included wheat prices, and purchasing volume. Minor adjustments have been made on the variable and fixed costs stated in the original template so that the ROM will reflect the costs in Indonesia. The calibration cost has been assumed as a calculated cost that includes the additional labour and utility costs generated from re-calibrating mill settings and the cost of training on how to optimise the ANW2’s flour performance in making cake and biscuits. The calibration cost is included when the mill first considers using ANW2. The cost will last for a three-year period but decreases each year. The effect of the calibration and learning is uncertain, but there is a higher probability (60%) that the mill will be more efficient in using ANW2 if the calibration cost is accrued.
As this project focused on wheat that is well suited to making cakes and biscuits, the outputs in the ROM were cake flour, biscuit flour and all-purpose flour, priced from highest to lowest respectively. The ‘output’ box Figure 1’s has outlined the composition of each flour. As weekly flour price data was not available, the flour prices were collected from the Alibaba site of PT. Bungasari Flour Mills Indonesia (Alibaba, 2017). Alibaba is a leading global online trading platform that has been operating since 1999. Therefore, the prices on the website are suitable for making assumptions on flour price.
The financial outcomes calculated from the ROM were the Net Present Value (NPV) (see Section 2.1.1 Net present value (NPV)) and Option Value (OV) (see Section 2.1.2 Option Value (OV)). The ROM collated the data from the Monte Carlo simulation. The Monte Carlo simulation calculated the results through completing 5000 iterations, each time sampling a different set of random values that lie within the probability distributions for each stochastic input. In the end, the Monte Carlo simulation produced a distribution of the possible outcome values and indicating the NPV’s mean for each management option (Palisade Corporation, 2017; Petersen et al., 2010). The OV is the NPV difference between an option that includes the cost of learning (Figure 1 ‘Management options’ no.2, 3 and 4) with the NPV of immediately switching without learning how to optimise the ANW2’s flour performance (Figure 1 ‘Management options’ no. 5).
2.1.1 Net present value (NPV)
NPV is widely used in the agriculture industry as it is a valid approach to assess and compare the return of available investments (Maart-Noelck and Musshoff, 2013). NPV is consistent with the company’s objective of maximising shareholders’ wealth (Brealey, 2016). The NPV calculates the estimated profitability of an investment by considering the current value of future cash flows (Newbery, 1981; Ryan, Patricia A and Ryan, 2002).
| NPVt=-CF0+∑i=1nSCFt(1+r)2 | ( 1 ) |
Where,
r is the interest rate (%)
CF0
is the initial investment
CFt
is the cash flow at terminal node t
The management option that has the highest Net Present Value (NPV) generates the greatest profit for the mill. However, options with the highest NPV does not necessary mean that it is the best option for the mill. In this project, the ROM has built uncertainty into the NPV methodology by considering flexibility or uncertainty in the timing of the wheat switching investment, which is illustrated by the Option Value (OV) (see Section 2.1.2 Option Value (OV)).
2.1.2 Option Value (OV)
Option Value evaluates the profit Indonesian mills will gain from delaying and learning about ANW2, before purchasing. The strategic real options (SRO) for mills switching to ANW2 has been calculated using the following formulae (Kofman and Pinder, 2016; Pažek and Rozman, 2012):
| OV =
NPVtswithing to ANW2- NPVtno option |
( 2 ) |
| NPVSRO= NPVt+OV | ( 3 ) |
Where,
OV is the option value ($)
NPVt
is the Net present value at t number of years ($)
NPVSRO
is the Net present value of the strategic real options
When
NPVtswithing to ANW2> NPVtno option, the option value is positive, which indicates that there is an economic value in delaying and learning how to use ANW2. When
NPVtswithing to ANW2< NPVtno option, the option value is negative, however, if the
NPVSROis positive, mills should hold the learning option and not abandon it (Pažek and Rozman, 2012).
2.2 Data
For the purposes of this study, weekly prices of five wheat classes were collected from December 2013 to January 2017, including three types of Soft White Wheat (SWW), ANW2 and Soft Red Winter (SRW) as the nominal world price (Table 1). Mills can contract the suppliers and specify the wheat variety that has a protein content desired by the mill. A higher price is paid for SWW that has a lower protein percentage, as a lower protein content is preferred for biscuit and cake flour (Elieser and Hibbs, 2005).
Table 1. Comparison of soft wheat classes’ protein content.
| Wheat Classes | Wheat protein content |
| American Soft Red Winter (SRW) | Protein content is 8-11% |
| Soft White Wheat unspecified (SWWunspecified) | Protein content is unspecified |
| Soft White Wheat 10.5% (SWW10.5%) | Maximum protein content is 10.5% |
| Soft White Wheat 9.5% (SWW9.5%) | Maximum protein content is 9.5% |
| Australia Noodle Wheat 2 (ANW2) | Protein can be lower than 9.5% or higher than 11.5% |
In a soft wheat context, the relevant world price will be the SRW price, determined when there is trade in Chicago SRW Future Contracts on the Chicago Mercantile Exchange group (Australian Securities Exchange, 2016; CME Group, 2015). The US exchange for SRW are the dominant markets used by all the major traders to hedge their positions when trading wheat, and they strongly influence the world price (CME Group, 2015)
The SRW and SWW prices were reported in bushels whereas ANW2 prices were reported in metric tonnes. Thus, to compare the wheat prices, the bushel unit and have been converted to metric tonnes with a conversion rate of 36.743 : $/bu × 36.743 =$/t (U.S Wheat Associates, 2017). The ANW2 prices have been collected by Matt Yamamoto, Program Manager, AEGIC referring to Plum Grove’s dataset (Yamamotto, 2017). The different price point between the ANW2, SRW and SWW have been converted to the price of landing in Indonesia with the following formula:
| FIS + Port out turn cost = FOB | ( 4 ) |
| FOB + Shipping cost + Insurance = Price landed in Indonesia | ( 5 ) |
Where,
FIS = Free in store price, which is the cost before the wheat is loaded onto the boat. FIS includes the farm gate price and the freight from farm-gate to the port.
Port out turn cost = $21.9/t, which is the Cooperative Bulk Handling (CBH) group port cost, as ANW2 is only grown in the west coast and most likely handled by the CBH group (Stretch et al., 2014).
FOB = Free on board, which is the price after the wheat is loaded onto the ship.
Shipping cost to Indonesia = $9 – $42 (Table 2)
Global insurance = 4.5% of the shipping cost (Grains and Estimates, 2017)
Table 2. Estimated shipping rates to Indonesia for ports in Australian and US (Stretch et al., 2014).
| Australia (WA) | US (Pacific North West) | US Gulf | |
| Wheat Variety | ANW2 | SWW | SRW |
| Shipping cost to Indonesia (USD$/t) | 9 | 31 | 42 |
2.3 Software
The Real Options Milling model is a built feature in Microsoft Excel. In order to better address the rationale for Indonesian mills switching from SWW to ANW2, this study has selected to use a set of Excel add-ins developed by Palisade. The Palisade add-ins that have been incorporated in the Real Options Model include StatTools for data analysis and @RISK, which performs risk analysis using Monte Carlo simulation to indicate the decision-making process in the spreadsheet model. Monte Carlo simulation is commonly applied in business, finance and agricultural economics. It models the probability of different outcomes by repeatedly sampling values for a set of random variables and inputs from a probability distribution, and collecting the output from each iteration (Palisade Corporation, 2017; Petersen et al., 2010).
2.4 Correlation matrix
This project has applied Palisade’s StatTools to generate correlation matrixes for the price series and obtain correlation coefficients. The coefficients have been entered into the Real Options Milling model to ensure that during modelling, the SWW and ANW2 price movements are in the general direction or in a predictable manner, where there is a high correlation.
2.5 Distribution fitting
The project has applied Palisade’s @RISK to find the best distribution fits for the wheat prices before and after eliminating the SRW prices. The distribution fitting process used a parametric approach to generate a function that predicts the price series and control the price movement within a maximum and minimum price. @RISK has defined the best distribution fitting, based on the Akaike Information Criterion (AIC). AIC estimates the efficiency of statistical distribution fitting models and penalise distributions with greater number of parameters, thus selecting a fitted model that minimises over-fitting and extends the distribution fitting model’s ability to encounter all possible data (Akaike, 2011; Vanneck, 2016).
A parametric approach is commonly used in defining a price series with the following distributional relationship (Featherstone and Kastens, 2000):
| y=(x,e, β) | ( 6 ) |
Where,
y
is the variable that will be simulated
x
are the observed variables
e
are the unobserved variables (or error variable)
β
are the parameters
In this project
eis a value independent from the world price and it is a value that cannot be explained, which may be referred as the external factors that influence wheat price:
| P0 = Pw + e | ( 7 ) |
Where,
P0 is either the ANW2 or SWW prices
Pw is the world price (ie. SRW)
and hence
| e = P0 – Pw | ( 8 ) |
Where the error term is the spread between the world price and the tested class’ price.
2.6 Personal conversation
AEGIC’s staff have conducted interviews with Indonesian mills and AEGIC’s millers. Personal conversation with AEGIC’s staff has added insights of Indonesian mills’ purchasing and operation process to this project. Where possible the Real Option Milling model has been built on realistic assumptions. This, extends the model’s ability to mimic individual variables in the real world with some consistency.
3. Results and Discussion
3.1 Correlation matrix
The correlation matrix in Table 3 examined the relationship between the wheat classes’ price series. It has been observed that the correlations are larger than 0.7 indicating that the correlation between the prices of ANW2 and the three SWW wheat varieties are strong and moves in the same direction (Table 3). This strong correlation may be spurious due to the effect from world price. Therefore, the correlation matrix in Table 4 examined the relationship between the wheat classes’ price series after eliminating the world price.
Table 3. The correlations between the prices of ANW2 and the three SWW wheat classes before eliminating the world price (P value < 0.0001).
| Wheat classes | Correlations coefficients |
| ANW2 vs SWWunspecified | 0.932 |
| ANW2 vs SWW10.5% | 0.931 |
| ANW2 vs SWW9.5% | 0.815 |
| SWWunspecified vs SWW10.5% | 0.975 |
| SWWunspecified vs SWW9.5% | 0.887 |
| SWW10.5% vs SWW9.5% | 0.919 |
Table 4. The correlations between the price series of ANW2 and the three SWW wheat classes after eliminating the world price (i.e. ANW2`=ANW2-SRW) (P value < 0.0001).
| Wheat classes | Correlations coefficients |
| ANW2` vs SWWunspecified` | 0.079 |
| ANW2` vs SWW10.5%` | 0.250 |
| ANW2` vs SWW9.5%` | 0.372 |
| SWWunspecified` vs SWW10.5%` | 0.454 |
| SWWunspecified` vs SWW9.5%` | 0.077 |
| SWW10.5%` vs SWW9.5%` | 0.779 |
After eliminating the SRW prices, the correlations between ANW2 and the three SWW wheat varieties were much weaker (Table 4), which indicates that the ANW2 is not strongly influenced by American soft wheat prices but instead influenced by the world price and external factors, such as the local market supply and demand, logistics, local weather and crop conditions (Australian Securities Exchange, 2016; Blakeney et al., 2009). SWW exports are responsive to changes in world wheat supply-demand balances and the world price is also influenced by factors including global macroeconomic drivers, global supply and demand, and fund activity (Australian Securities Exchange, 2016). After eliminating the world price, spurious correlation is reduced and the price series will be less volatile (see Appendix ). When inputting the price into the Real Options Milling model (ROM) after eliminating the world price, uncertainties are minimised and produce a more accurate analysis on how the SWW and ANW2 price differential influence mills’ making decision on whether to immediately accept or delay the investment.
The prices of SWW9.5% and SWW10.5% continued to display a strong correlation of 0.779 (Table 4). Before eliminating the world price, prices of SWW are highly correlated irrespective of protein content (Table 3). However, after eliminating the world price, there was a dependant relationship between SWW9.5% and SWW10.5%. This relationship is likely influenced by the protein content. AEGIC’s personal conversation with the Indonesian mills have indicated that if the protein content is 1% lower, the soft wheat price will be $5-10 higher. Protein content is an important price determinate in wheat trading as it is an indicator of wheat functionality. A lower protein soft wheat will have a moderately higher price, which is the additional price on top of the base price set through supply and demand conditions (Carver, 2009).
3.2 Distribution fitting
3.2.1 Wheat price
This project has shifted the focus from the actual wheat price to a mixture of non-constant error variables that define the distribution of wheat prices, as wheat prices are sensitive to unknown external factors (Goodwin et al., 2000). For example, changes in the market conditions may shift the price series’ distribution, thus wheat prices may have unexplained characteristics that are unlikely to fit into a normal distribution (Goodwin et al., 2000). Normal distributions have unbounded upper and lower limits, which for a price series is unpalatable, as wheat price cannot? be negative.
@RISK (based on the AIC) has identified that the error variable (Section 2.5 Distribution fitting( 8 ) follow a Beta General relationship (Figure 2) (Gupta and Nadarajah, 2004):
| fe=e-ap-1b-eq-1Bp,qb-ab-ap=q-1 a≤e≤b;p,q>0 | ( 9 ) |
| Bp,q=∫01ea-1(1-x)b-1dx | ( 10 ) |
Where,
a
and
bare the minimum and maximum bounds
p
and
qare the shape parameters
p>2, q>2
: The distribution is bell-shaped
1
: The distribution is unimodal, negatively skewed to the left
Price difference between SWW9.5% and ANW2 is the highest, followed by the price difference between SWW10.5% and ANW2. The price difference between SWWunspecified and ANW2 is the lowest (Figure 2).
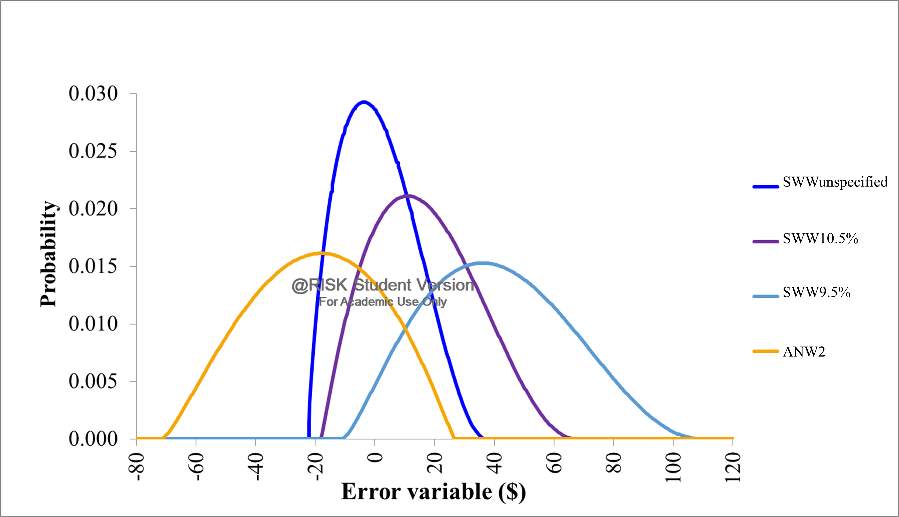
Figure 2. The Beta General curve that describes SWW and ANW2’s error variables.
The Beta General distribution for the classes of wheat are defined by the following parameters (Table 5):
Table 5. The parameters identified from the detrended wheat price series’ Beta General Distribution function.
| p | q | Minimum (a) | Maximum (b) | |
| SWW | 1.873 | 2.91 | -22.15 | 37.75 |
| SWW10.5 | 2.1006 | 3.14 | -18.24 | 67.88 |
| SWW9.5 | 2.4282 | 3.26 | -11.06 | 110.61 |
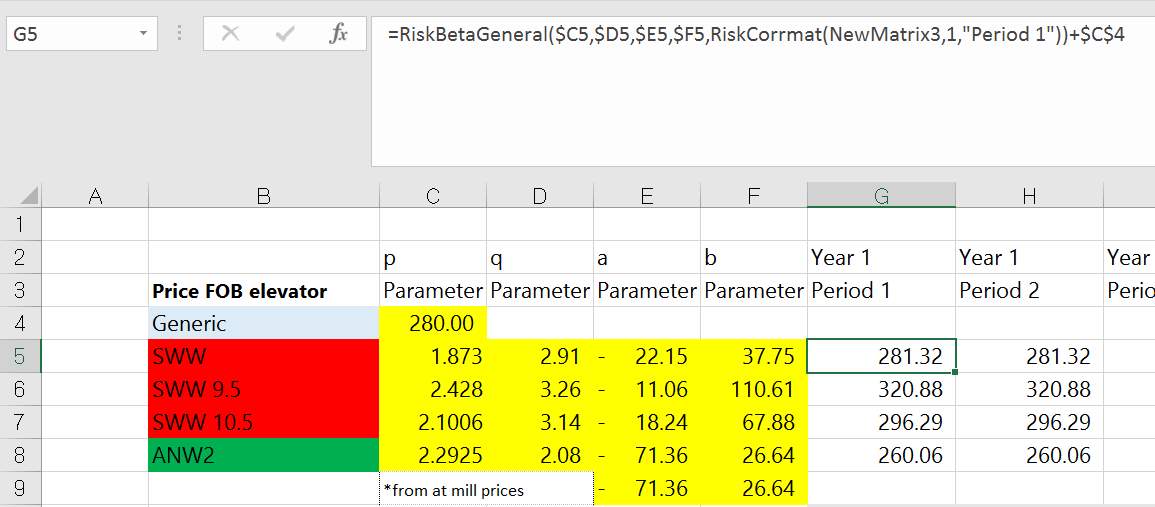
| ANW2 | 2.2925 | 2.077 | -71.356 | 26.638 |
The final wheat price function, input to the ROM is:
| fx=fe+x | ( 11 ) |
Where,
x = 250 USD, which is an indicative world price for soft wheat.
In the ROM model,
xis assumed to be deterministic and it functions as a fixed reference point for the wheat price of the other classes. Therefore, in the model, the price difference for each class is defined by the difference in correlated error variables instead of the actual wheat price.
3.2.2 Flour price
In the ROM model, flour prices for cake and biscuits, were assumed to be deterministic, so that flour price volatility were eliminated. The output prices were fixed so that the focus was making decision on whether to immediately accept or delay the decision based on the input costs (Pažek and Rozman, 2012). Furthermore, the changes in flour price can be eliminated because of the presence of vertical Asymmetric Price Transmission (APT) in the Indonesia Milling Industry (Varela and Taniguchi, 2014). The vertical APT is also known as flour’s ‘sticky price’, which means that when the international wheat price increases, the flour price in Indonesia will also increase, but if the international wheat price decreases, the flour price is resistant to downward movement. Anecdotal evidence has shown that one of the main causes of the ‘sticky price effect’ is that the concentration of the market share is controlled by only a few dominating flour mills (Varela and Taniguchi, 2014).
3.4 Personal conversation results
AEGIC’s staff have conducted interviews with Indonesian mills and AEGIC’s millers. Personal conversations with AEGIC’s staff, have identified the main variables that influence the mills’ adoption of ANW2 for use in cake and biscuit flour. These variables include flour quality, flour yield, storage capacity, wheat price, willingness to pay and the cost of learning. Realistic assumptions on these variables have been built into the ROM which extends the model’s ability to replicate the financial outcomes of the mill, in the real world with constancy. As ANW2’s flour performance can vary depending on mills’ existing milling capability, product testing method, formulation and quality preferences, the ROM has modelled both possibilities, SWW’s flour performance is higher or lower than ANW2. For more description on each assumption see Appendix 1.
3.4.1 Cost of learning
The management options were whether to immediately exercise, delay or reject the opportunity of switching to ANW2. There were two variants to ‘immediately exercise the option: immediately switching to ANW2 with calibration cost and learning costs; and the other is immediately switching without learning. In the first of these variants, immediately switching to ANW2 and accepting the calibration cost meant that mills will receive a three-year-ongoing training from Australia on how to optimise the ANW2’s flour performance in making cake or biscuit flour. In the second of these variants, if mills were to immediately switch without learning, they will produce lower volumes of the high quality (cake) flour, as they are unable to optimise ANW2’s milling and flour performance. Delaying the option also meant that the mills will receive trainings beforehand the negative effect on cake and biscuit flour will be minimised more significantly comparing to immediately using the ANW2.
3.4.2 Scenarios
This study considered the likely scenarios faced by the Indonesian mills including high or low flour yield, high or low storage capacity, and whether ANW2’s flour performance was higher or lower than SWW.
Table 6 The scenarios tested in the Real options milling model.
| Scenario 1 | Scenario 2 | Scenario 3 | Scenario 4 | |
| Storage capacity | Low | High | Low | High |
| Flour yield | Low | High | High | High |
| ANW2’s flour performance | Low | Low | High | High |
Both flour yield and storage capacity are important components that determine mills’ profitability. Flour yield is the most crucial technical and economic factor for mills and also influences mills’ buying decision (Posner and Hibbs, 2005). A lower price is paid to wheat with lower flour yields, as low flour yield wheat will demand higher volume of wheat to be processed, to generate the same amount of flour. A comparison study has found that a flour yield of 76% has generated the highest net income (Liu et al., 1992; Posner and Hibbs, 2005). Thus, this analysis has compared two levels of flour yield, 71% and 75%.
In this analysis, low storage capacity meant that the mills have limited storage and the switch to ANW2 is effectively irreversible once enacted. Mills cannot switch back to SWW after purchasing ANW2 without additional cost. High storage capacity meant that the mills have a storage capacity that allows them to have multiple switches between SWW and ANW2.
When switching from SWWunspecified, SWW10.5% or SWW9.5% to ANW2 the WTP was assumed to be $22.4, $39.9 and $72.0, respectively.
3.5 The Real Options Milling model (ROM)
The management option that has the highest Net Present Value (NPV) will generate greatest profit for the mill. After testing the scenarios outlined in the previous section (Table 6), different management options presented the highest NPV, depending on whether the mill is switching from SWWunspecified, SWW10.5% or SWW9.5% to ANW2[1] (Figure 3-Figure 6).
In the case where ANW2’s flour performance was lower than SWW, if the mill was restricted by low storage capacity and low flour yield, there was a higher value ($4.18M) in selecting the ‘Delay 2 years’ option than the ‘Immediately switching without learning’ option (Figure 3A). Furthermore, ‘Immediately switch without learning’ had a lower NPV than ‘Not switching’. This was the scenario where the uncertainties were high and there was a value in delaying the decision to resolve uncertainties over the quality difference of ANW2, prior to committing to purchase.
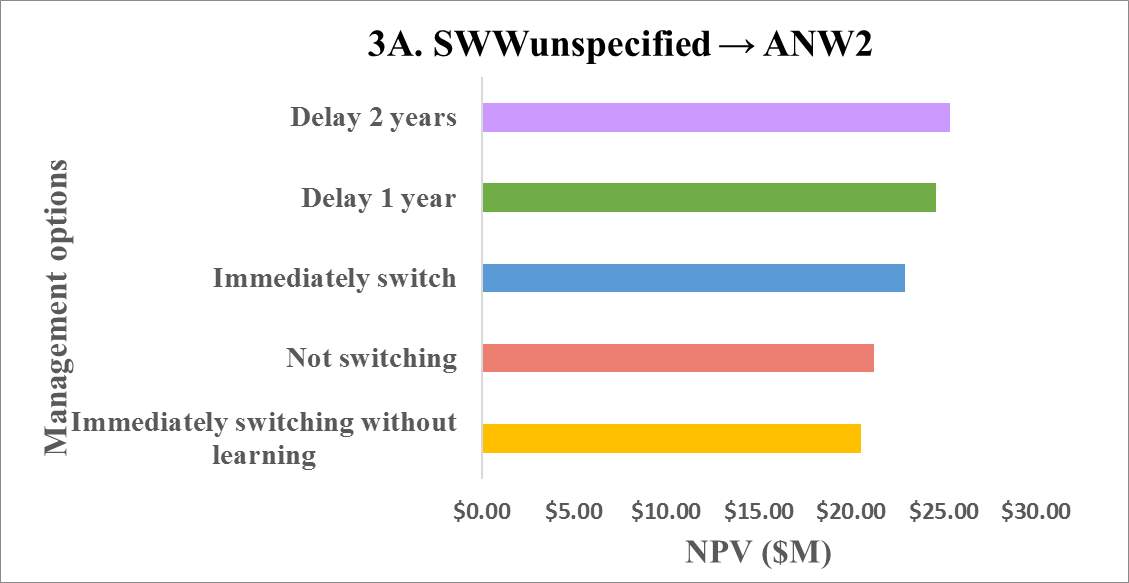
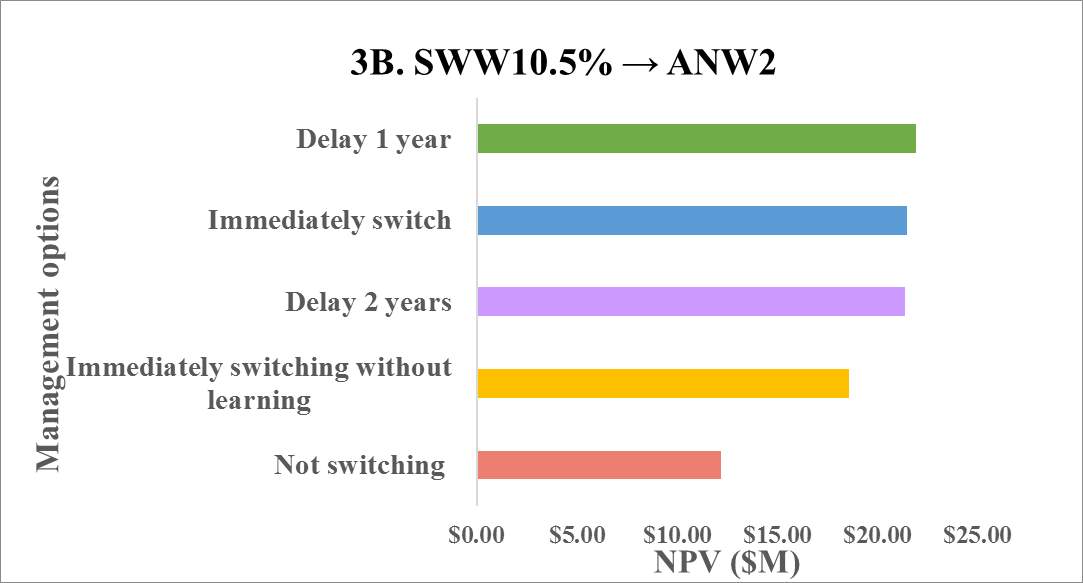
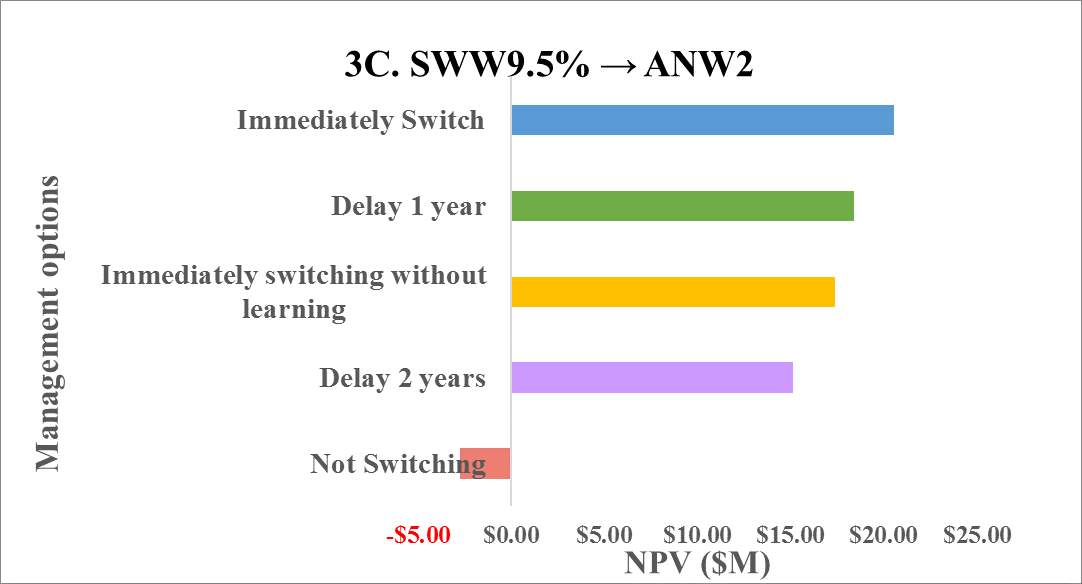
Figure 3. Comparison of Indonesian mills’ management options when the mill has low storage capacity. ANW2 has a lower flour yield (71%) than SWW (75%) and the ANW2’s flour performance is lower than SWW.
Mills decisions are driven by wheat price differential. When ANW2’s flour performance were lower than SWW, if the mill had low storage capacity and was choosing between SWW10.5% and ANW2, the higher difference in wheat price encouraged an earlier switch (Figure 3B). Similarly, if choosing between SWW9.5% and ANW2, an immediate switch was suggested and the ‘Not switching’ option had a negative NPV. According to the NPV rule, only investments that have a positive NPV should be accepted, whereas a negative NPV will reduce the value of the firm (Brealey, 2016). Thus, the ‘Not switching’ option should be rejected, as the mills are not taking advantage of ANW2’s lower wheat price.
Mills’ decisions are also driven by wheat storage capacity. If the mill did not have storage capacity constraint, immediately switching attracted the highest NPV ($29.69M) (Figure 4A). Even if the mill delays the switch, it will gain $8.03M over the ‘Not switching’ option (Figure 4A). There was no penalty to switching, as the mills took advantage of the lower priced grain class when possible.
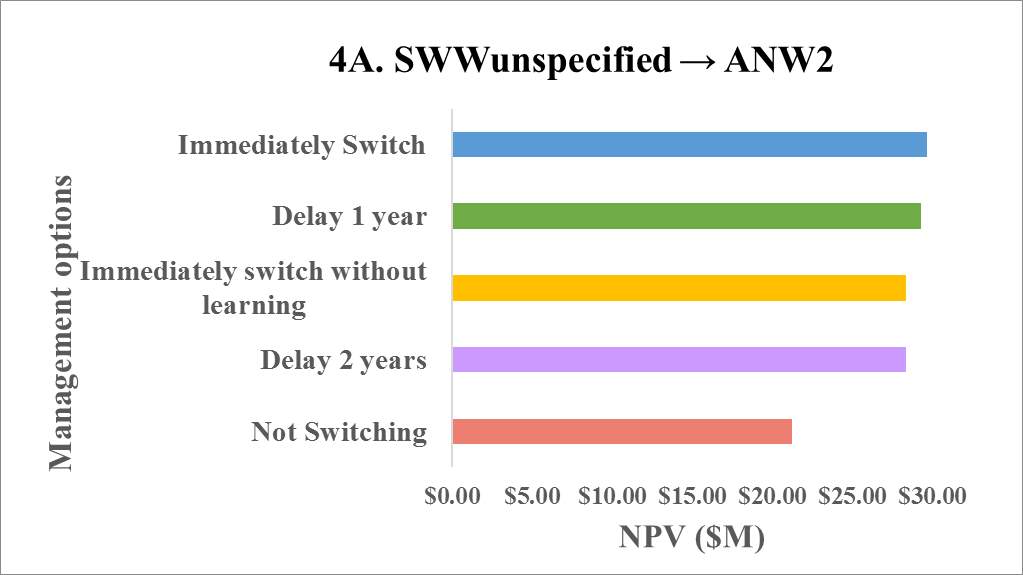
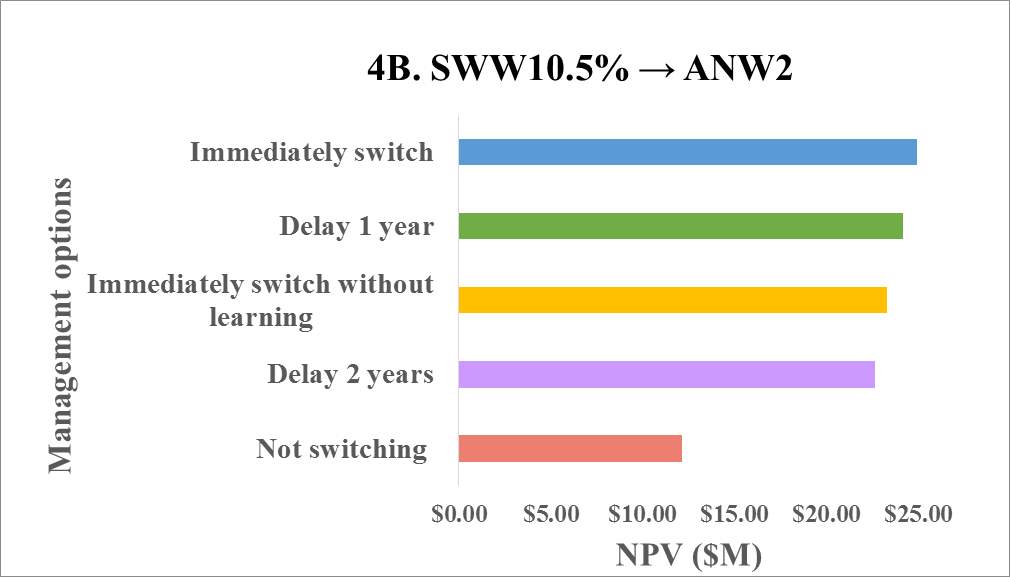
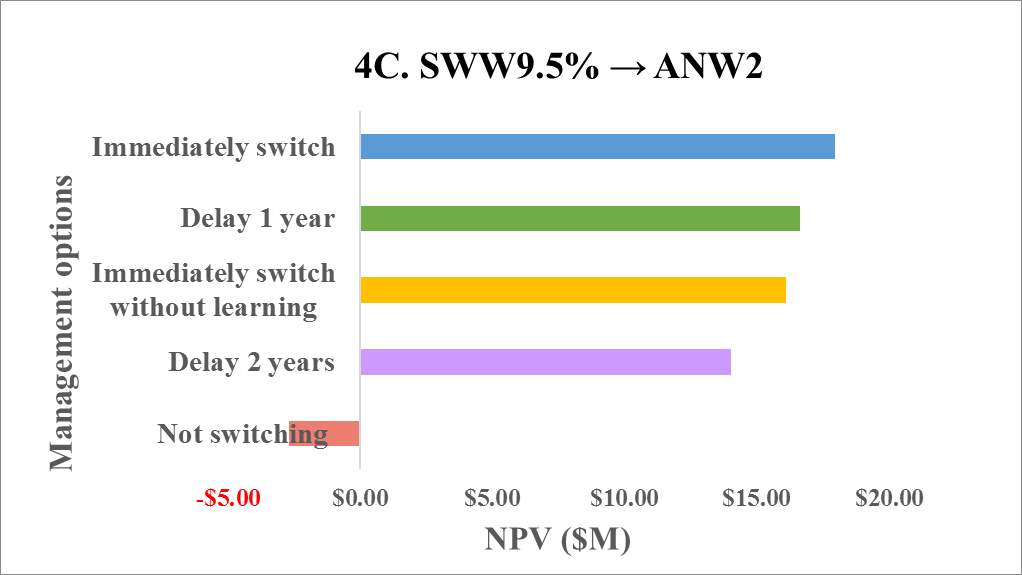
Figure 4. Comparison of Indonesian mills’ management options when the mill has high storage capacity. ANW2 has a high flour yield (75%) that is equivalent to SWW (75%) but ANW2’s flour performance is lower than SWW.
In the case where ANW2’s flour performance was higher than SWW, even though the mill was restricted by low storage capacity, the ‘Immediately switching’ option attracted the highest NPV ($31.92M) (Figure 5A). There was a higher value ($0.70M) in selecting ‘Immediately switching’ than the ‘Immediately switching without learning’ option (Figure 5A). This indicated that even without quality penalties, the decision is dominated by the price difference and the flour output in the first year. Thus, Indonesian millers are willing to bear a cost in learning, prior to committing to purchase.
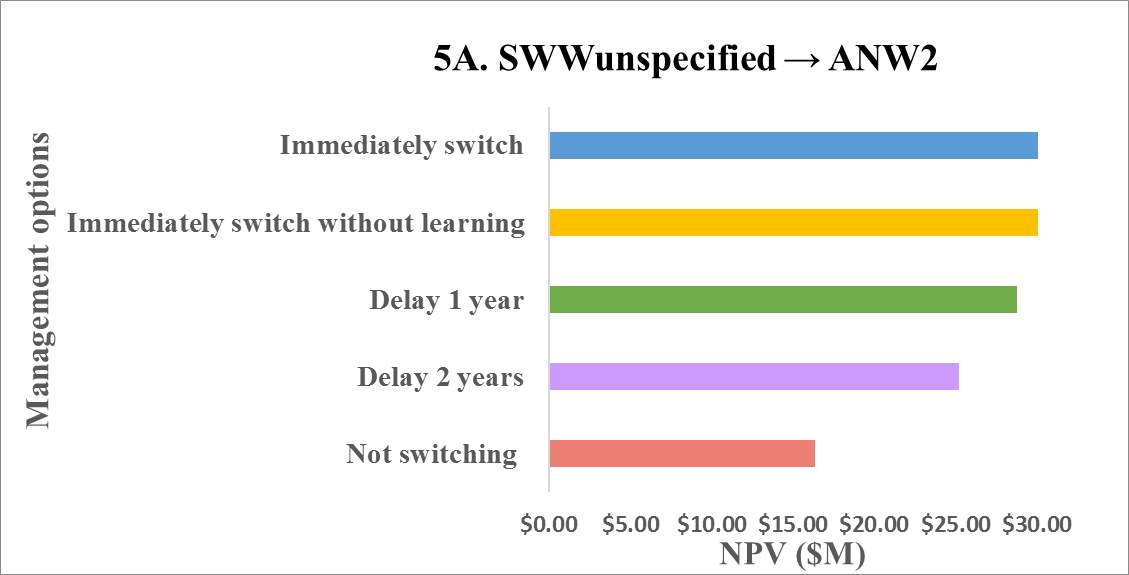
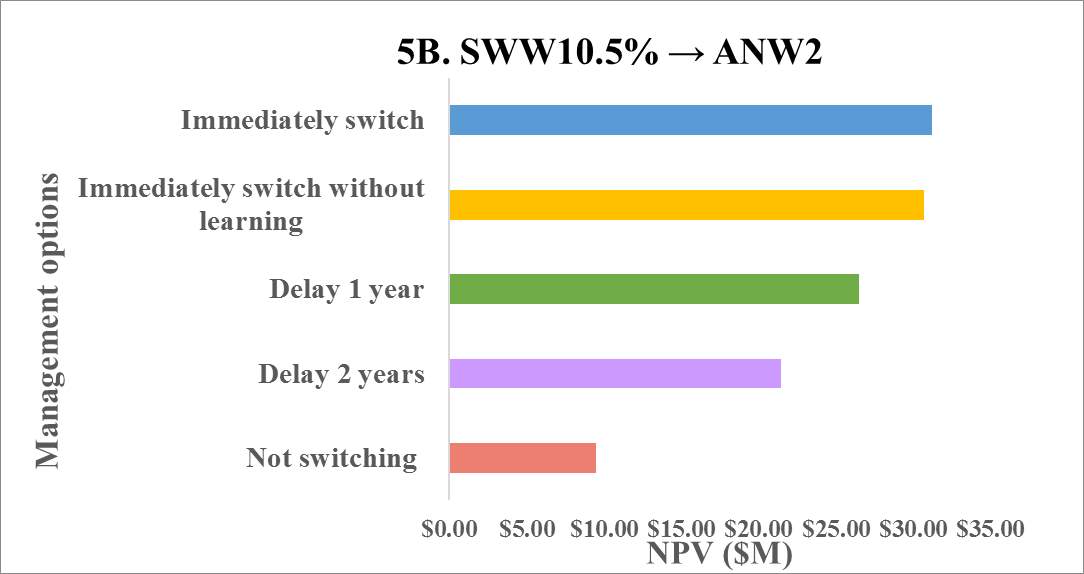
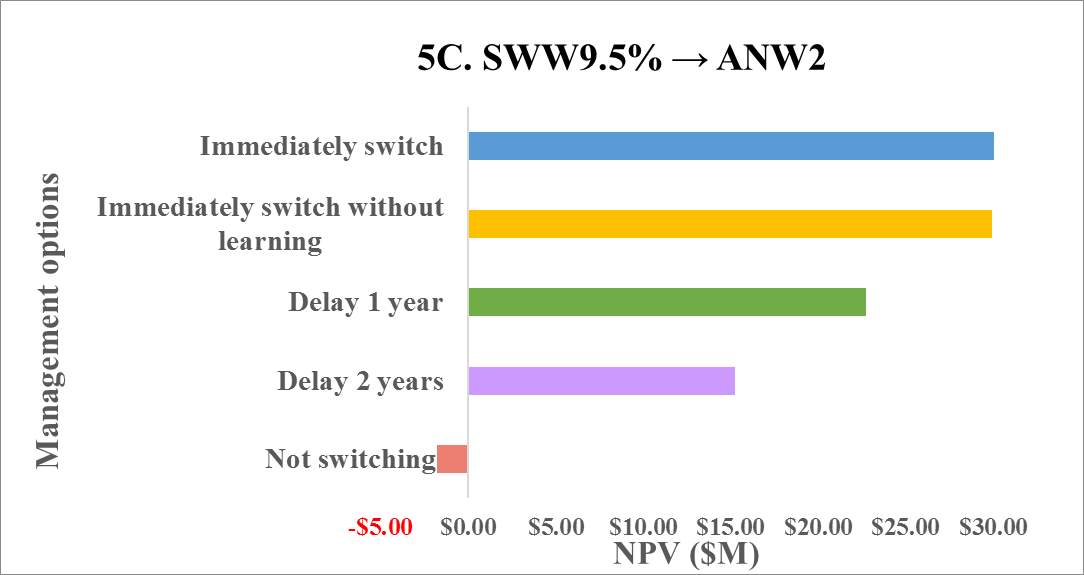
Figure 5. Comparison of Indonesian mills’ management options when the mill has low storage capacity. ANW2 has a high flour yield (75%) that is equivalent to SWW (75%) and ANW2’s flour performance is higher than SWW.
In the case where ANW2’s flour performance was higher than SWW, if the mill had high storage capacity and was choosing between SWW9.5% and ANW2, there was a higher value ($0.34M) in selecting ‘Immediately switching without learning’ than the ‘Immediately switching’ option (Figure 6C). This reinforced that ANW’s high quality and lower price had offset any additional input cost or uncertainties when switching to ANW2.
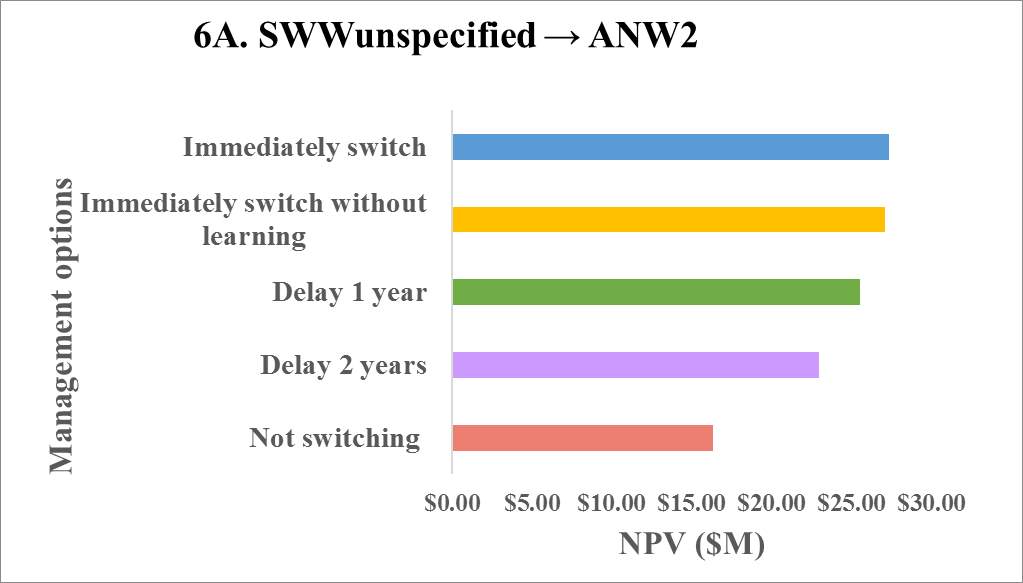
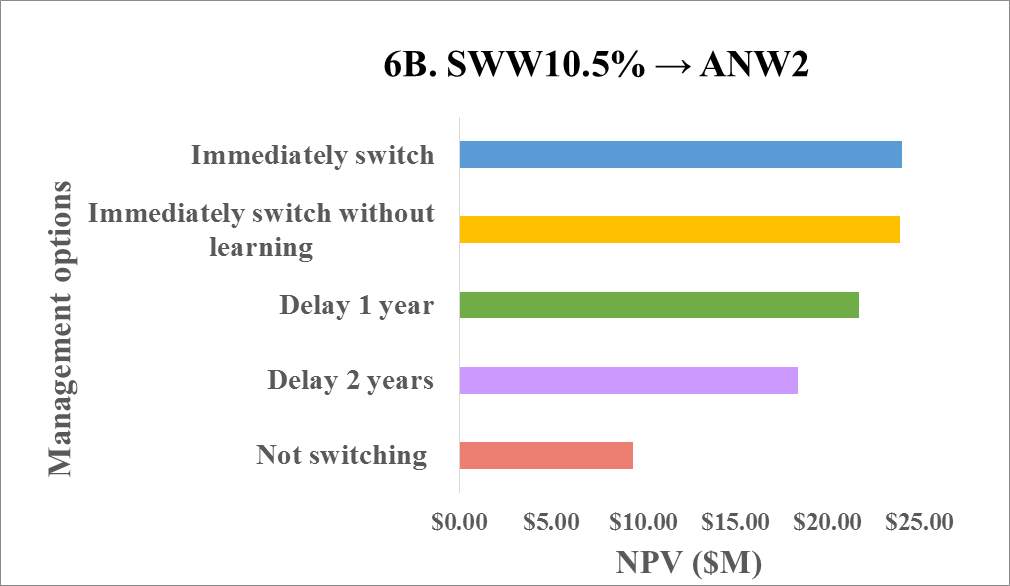
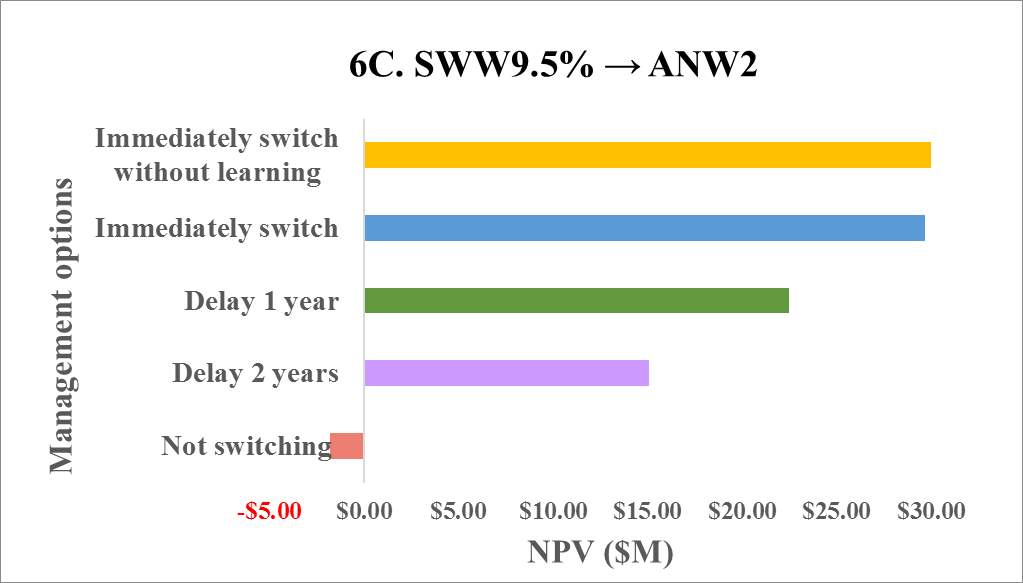
Figure 6. Comparison of Indonesian mills’ management options when the mill has high storage capacity. ANW2 has a high flour yield (75%) that is equivalent to SWW (75%) and ANW2’s flour performance is higher than SWW.
To summarise Figures 3-6, even though the model has heavily penalised the milling efficiency and flour performances when switching to ANW2, there were only two scenarios (Figure 3A and Figure 3B) that did not encourage ‘Immediately switching without learning’ over ‘Delay 2 years’. It could be concluded that ANW’s lower price has offset any additional cost and an earlier access to ANW2 will generate the highest profit for the Indonesian mill. According to Tauer (2006), there have been cases when producers will not make switching decisions until the price moves below the lower price bound, which indicates that price differential is a key influential in economics decision making process.
The literatures regarding decision makings has shown that a longer waiting time is considered when the new investment involves significant structural changes (Maart-Noelck and Musshoff, 2013; Sanderson et al., 2015; Tauer, 2006). For example, when switching production regimes, the decision time for switching from wheat production to sheep production is relatively long at 2.19 years (Sanderson et al., 2015). In comparison with switching production regimes, the risk to mills associated with switching the wheat of origin is not as significant. Thus, it is possible that mills will gain the highest profit when immediately having access to ANW2’s lower price. Furthermore, the personal conversation results have indicated that Indonesian mills are confident in using Australian wheat and they have a strong milling capacity that shortens the trial time required to adapt to ANW2 (AEGIC, 2017; Varela and Taniguchi, 2014).
3.5.1 Mills’ decisions are more driven by the wheat price differential, but, flour quality is also an important determining factor
Wheat price is a critical component in wheat trading and takes up 85% of the milling cost (McFall and Studer, 2010). However, flour quality is also a crucial factor. To further analyse whether mills’ decisions are more driven by the wheat price differential or wheat quality, the ROM has been used to compare the Indonesian mill’ management options when the price of ANW2 is similar to SWW. This is achieved by matching ANW2 and SWW’s price series parameters identified in the price distribution (Section 3.2 Distribution fitting). It is possible that in the future, the demand for ANW2 will increase which drives the price of ANW2 upwards and the price differential between ANW2 and SWW will be less significant.
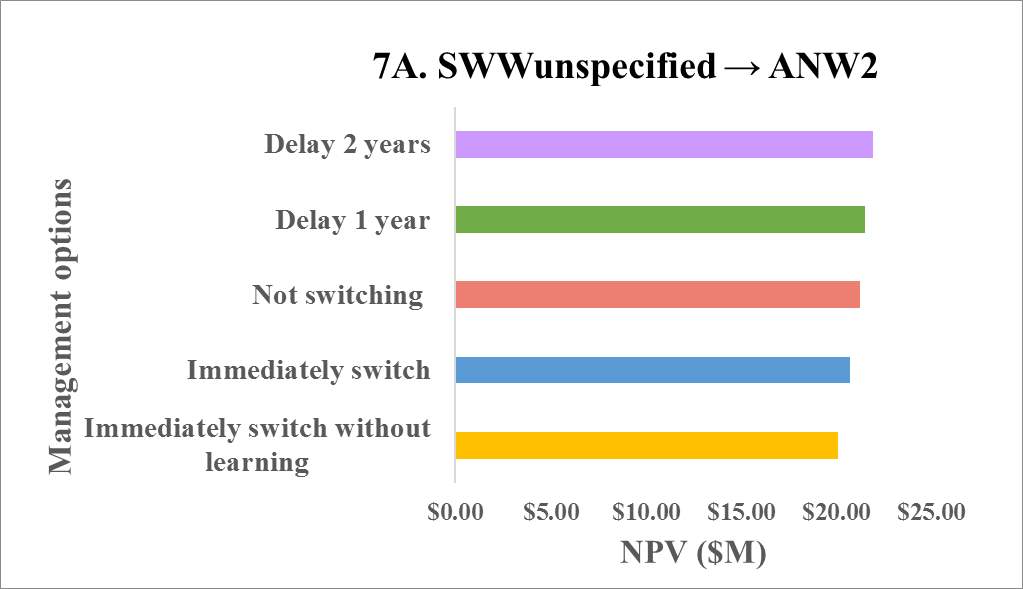
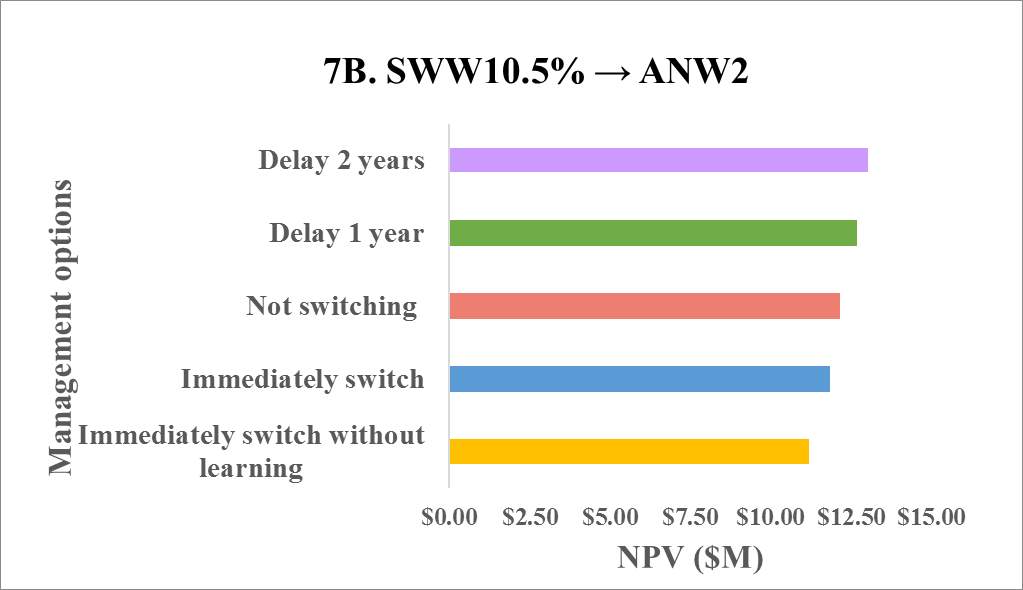
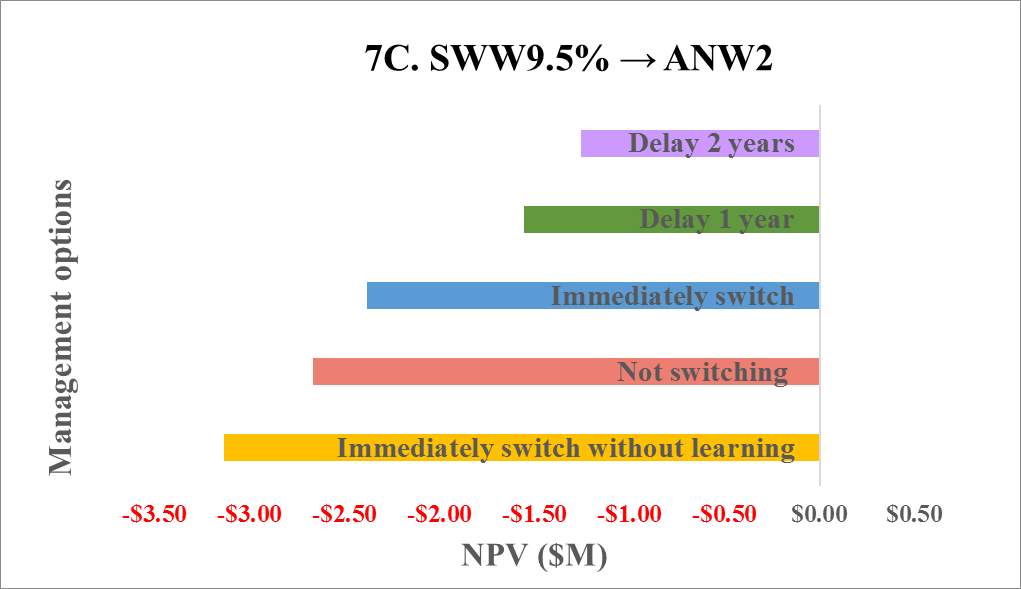
Figure 7. Comparison of Indonesian mills’ management options when the price of ANW2 is similar to SWW. The mill has high storage capacity. ANW2 has a high flour yield (75%) that is equivalent to SWW (75%) but ANW2’s flour performance is lower than SWW.
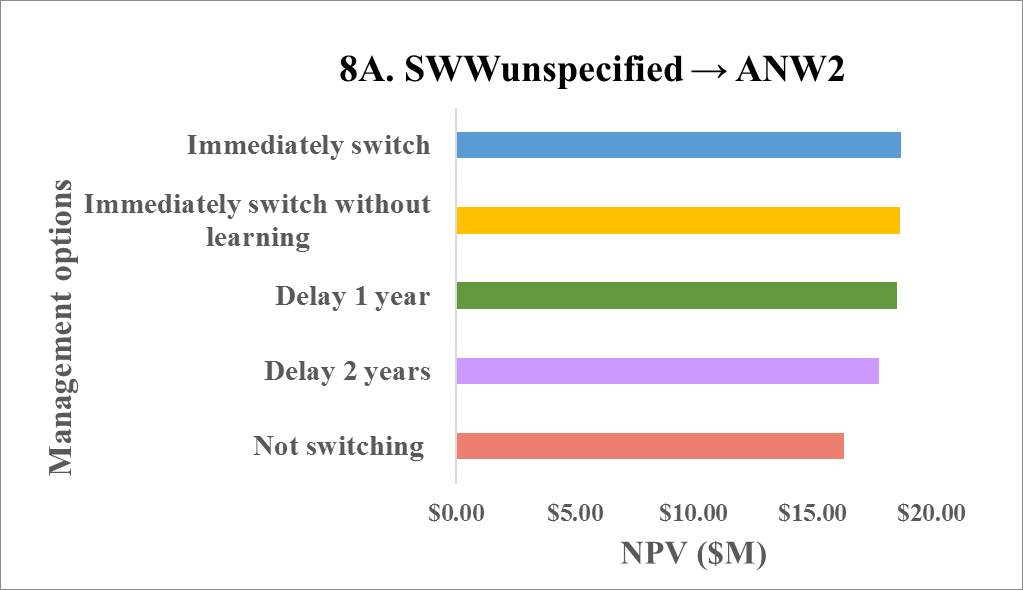
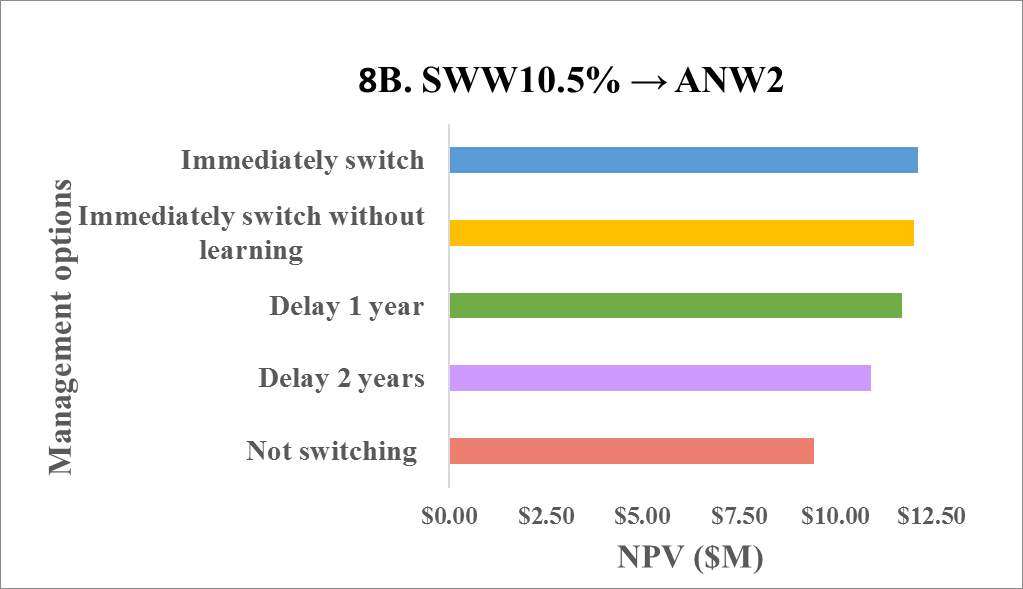
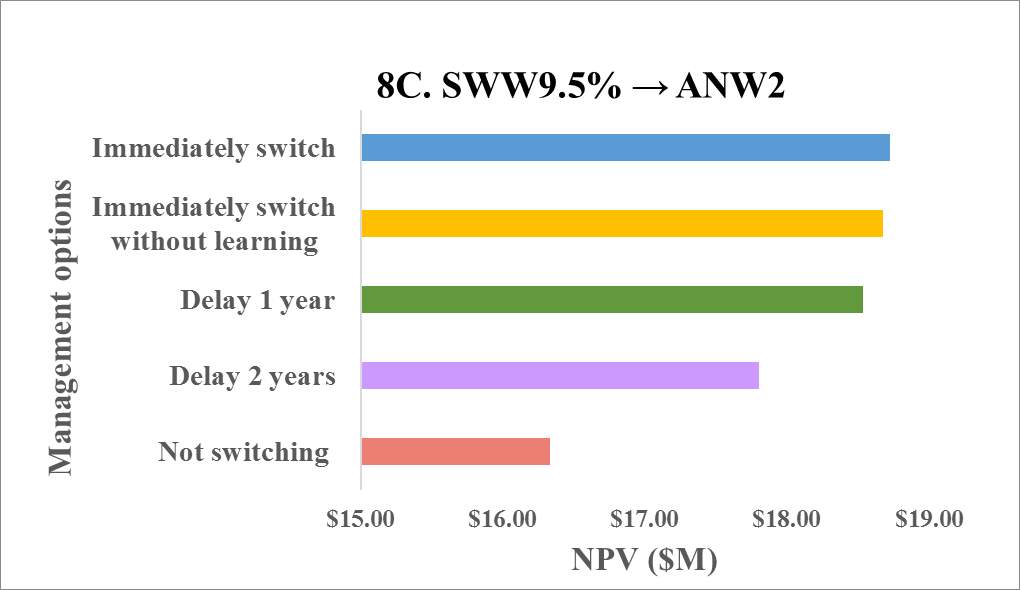
Figure 8. Comparison of Indonesian mills’ management options when the price of ANW2 is similar to SWW. The mill has high storage capacity. ANW2 has a high flour yield (75%) that is equivalent to SWW (75%) and ANW2’s flour performance is higher than SWW.
In the case where the mill had no storage capacity constraint and ANW2’s flour performance was higher than SWW, if the price of ANW2 was similar to SWW, ‘Immediately switch’ option generated a higher NPV than ‘Immediately switching without learning (Figure 8Figure 8B and Figure 8C). If the price differential between SWW9.5% and ANW2 was high, ‘Immediately switching without learning’ attracts the highest NPV ($30M) (Section 3.5 The Real Options Milling model (ROM), Figure 6C), but if the price differential between SWW9.5% and ANW2 was low, ‘Immediately switching’ attracted the highest NPV ($18.73M) (Figure 8C).
To summarise Figure 6C-8C, even though the quality of ANW2 is higher, mills are not receiving a lower price advantage so they are reluctant to take the risk in immediately using ANW2 without gaining training on how to use the wheat (Table 7). Thus, Mills’ decisions are more driven by the wheat price but they are also willing to accept a higher quality wheat if they will receive a three-year-ongoing training from Australia to optimise the use of ANW2.
Table 7. Summary of the management option with the highest NPV in scenarios that compares the wheat quality and price differential.
| Scenario 1
(Figure 6C) |
Scenario 2
(Figure 8C) |
Scenario 3
(Figure 7C) |
|
| ANW2’ quality | High | High | Low |
| Price differential between ANW2 and SWW9.5% | High | Low | Low |
| Management option with the highest NPV | Immediately switching without learning | Immediately switch | Delay 2 years |
3.6 Option Value (OV)
The option value (OV) is generated when the return from an uncertain investment will surpass a given level, which is known as the strike price (Cox et al., 1979). In the case of switching to ANW2, the strike price is the option where the mill does not switch to ANW2 and the OV is the NPV difference between scenario that the mills are switching to ANW2 and the ‘Not Switching’ option.
Figure 9 is a theoretical illustration of an Indonesian mill switching to ANW2. An initial assumption was that ‘Not switching’ option will generate a higher NPV than the ‘Immediately switching without learning’ option. This is because in an ‘Immediately switching without learning’ scenario, Indonesian mills will produce lower volumes of the high quality (cake) flour, as they are unable to optimise ANW2’s milling and flour performance. Hence, the revenue stream is reduced.
In this case, if Indonesia mills did not receive any training, then the option value will be negative:
OV =
NPVt Immediately swithing to ANW2 without learning- NPVtno option
If,
NPVt Immediately swithing to ANW2 without learning< NPVtno option
Then, OV<0
When Indonesia mills have received trainings, after a certain period, the option to switch will generate a NPV that surpasses the ‘Not switching’ option. Even though, in the first few years, the mill would be generating less profit than if they did not switch, they are still willing to accept that loss, because in the long term, they will generate a higher profit after switching to ANW2.
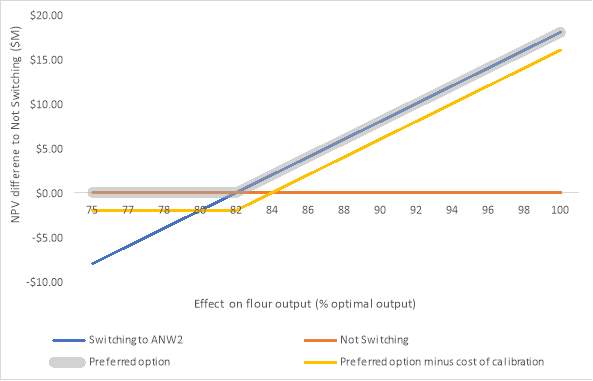
Figure 9 Theoretical illustration of an Indonesian mill’s flour output
The effect on flour output (Actual flour outputOptimal output %) can range from 75% to 100%. An optimal output means that the flour output generates the highest revenue. The assumption for an optimal output is if the mill is to produce 100 kiloton (kt) of soft wheat per year. Cake flour uses 60kt, biscuit flour uses 20kt and all-purpose flour uses 10kt.
Scenario 1: Due to the milling capacity and SWW’s flour quality, the Indonesian mill has been using 48kt of SWW in cake flour. Thus, the effect on flour output will be 48kt/60kt = 80% (Table 8).
Scenario 2: If the mill begins to use ANW2 without training, due to the difference in the ANW2’s flour performance, the mill cannot use 50kt of ANW2 in making cake flour. If the flour performance cannot be optimised to a level equivalent to SWW, the mill may not even be able to use 40kt. Thus, they will have to reduce the amount of ANW2 in cake flour to 35kt. Thus, the effect on flour output will be 45kt/60kt = 75% of the optimal output and resulting a revenue loss of -$2.6K (Table 8). In this case the mill’s preferred option is to not switch to ANW2 and continue using SWW (Figure 9’s the shaded section of orange line).
Scenario 3: If the mill has received training, once they start using ANW2 they can optimise ANW2’s flour performance so that the mill can use 5736kt ANW2 in cake flour. Thus, the effect on flour output will be 57.6kt/60kt =96% of the optimal output and resulting a revenue gain of $8.96K (Table 8). In this case the mill will prefer to use ANW2 (Figure 9’ the shaded section of the blue line). Additionally, as the mill have spent a learning cost, the current NPV ($12K) is lower than the expected NPV ($14K). Figure 9’s yellow line is the mill’s current NPV, and blue line is the expected NPV. However, in the long term, they will generate a higher profit that allows them to meet the expected NPV, as they will no longer need to pay the learning cost.
Table 8 Theoretical illustration of an Indonesian mill’s flour output in different scenarios.
| Optimal scenario | Scenario 1
Continue using SWW |
Scenario 2
Immediately switching to ANW2 without learning |
Scenario 3
Switching to ANW2 after learning |
|
| Soft wheat in cake flour (kt) | 60 | 48 | 45 | 57.6 |
| Soft wheat in biscuit flour (kt) | 30 | 24 | 22.5 | 28.8 |
| Soft wheat in all-purpose flour (kt) | 10 | 8 | 7.5 | 9.6 |
| Effect on flour output (% optimal output) | 100% | 80%
(48/60=80%) |
75%
(45/60 =75%) |
96%
(57.6/60 =96%) |
| Quantity× cake flour unit price $560/t =Sub total | 60 × 560 =$33.6K | 48 × 560 =$26.88K | 45 × 560 =$25.2K | 57.6 × 560 =$322.56K |
| Quantity× biscuit flour unit price $385/t =Sub total | 30 × 385 =$16.8K | 24 × 385 =$13.44K | 22.5 × 385 =$12.6K | 28.8 × 385 =$161.28K |
| Quantity× cake flour unit price $310/t =Sub total | 10 × 310 =$5.6K | 8 × 310 =$4.48K | 7.5 × 310 =$4.2K | 9.6 × 310 =$5.376K |
| Total | $56K | $44.8K | $42K | $53.76K |
| Revenue difference to Not switching to ANW2 | $0
(44.8-44.8=0) |
-$2.6K
(42-44.8= -2.6) |
$8.96K
(53.76- 44.8= 8.96) |
|
| Option value = NPV difference to Not switching to ANW2 | $0 | -$8 | $12 |
The OV calculated from the ROM showed different results from the theoretical assumption.
OV immediately switching to ANW2 (Table 9 1B and 2B) was higher that
OV immediately switching to ANW2 without learning (Table 9 1A and 2A), but
OV immediately switching to ANW2 without learning is positive and higher than the
OV delay 2 years (Table 9 1C and 2C). This indicated that the wheat price differential is sufficient enough to override the uncertainties in flour output.
Table 9. The option value ($ M) of each management options (A, B and C). The option value differs in different scenarios (1- 2). For example, scenario 1B refers to the scenario when mill has high storage capacity. ANW2 has a high flour yield (75%) that is equivalent to SWW (75%) and ANW2’s flour performance is higher than SWW.
It is important to acknowledge the fact that there are research gaps and difficulties to econometrically examine the explanatory power of the Real Options Approach (ROA), as it does not completely consider the complexity of risk behaviours and bias (Musshoff et al., 2013). Thus, options with the highest NPV can generate the greatest value for the mill but does not necessary mean that it is the best option for the mill. There are circumstances where decision makers take action at a later time than the time suggested by the ROA (Maart-Noelck and Musshoff, 2013). There are situations where the mills display a risk-averse behaviour and choose to delay the option. For example, in scenario 1C (Section 2.1.2 Equation 2 and 3 ):
OV
delay 2 years = 11.13M
NPV
delay 2 years =$23.27M
NPVSRO= NPVt+OV
= 23.27M + 11.13M = $34.4M
NPVSRO are positive, which means delaying the option will still add value to the mill (Pažek and Rozman, 2012). A risk-averse mill may have the perception that immediately switching evolves high uncertainty. Even though
OV switching to ANW2 after 2 years is lower than
OV immediately switching to ANW2 without learning, as long as the
NPVSRO is positive, the mill will still gain profit from delaying the option.
3.7 Willingness to pay (WTP)
Willingness to Pay (WTP) is the maximum amount the investor accepts to pay for the investment (Le Gall-Ely, 2009). A $10 WTP means that the mill is only willing to switch, if ANW2 is at least $10 cheaper than SWW. Decision makers’ WTP for an investment includes the value and timing of the investment (Musshoff et al., 2013). Thus, WTP is controlled by the mill and an increasing WTP represents an increasing risk-averse behaviour. This section examined the sensitivity of the NPV over a continuous WTP, ranging from $0 to $100. This section also assumed that the sotrage capacity was high and the flour yield was high.
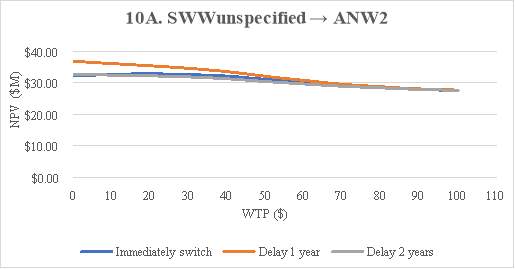
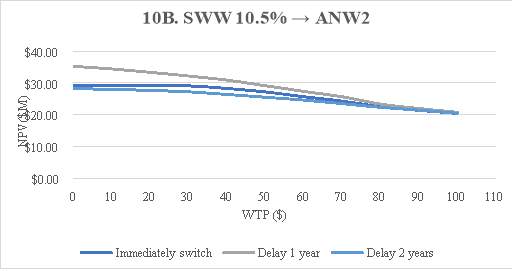
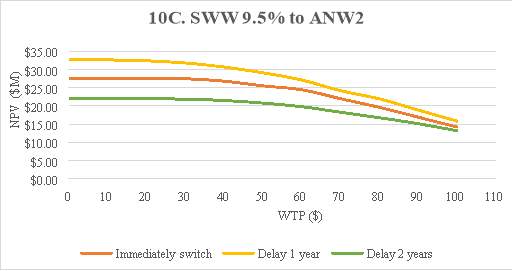
Figure 10 Comparison of Indonesia mill’s management options against an increasing willingness to pay.
The NPV difference between immediately switching and delaying the option was the most significant when WTP was $0 (Figure 10A, Figure 10B and Figure 10C). If mills’ WTP was $0, the mills saw no difference between using ANW2 and SWW, so they had a stronger preference in delaying the option. Thus, when WTP is $0, ‘Delay 1 year’ generated the highest NPV (Figure 10A, Figure 10B and Figure 10C). Furthermore, when choosing between SWWunspecified and ANW2, if the mills’ WTP was between $0-$5, ‘Immediately switch’ had the lowest value (Figure 10A). This indicates that a $5 difference between the two SWWunspecified and ANW2 does not offset ANW2’s uncertain effect on flour quality. Thus, when the price difference is not significant, the mill will prefer to delay the option for 2 years rather than immediately switching.
As the WTP increased from $0 to $20, the NPV of ‘Immediately switch’ option increased, whereas the NPV of ‘Delay 1 year’ option and ‘Delay 2 years’ option decreased (Figure 10A, Figure 10B and Figure 10C). This indicates that the mills’ preference towards ANW2 increases as their WTP increases. However, when the WTP was over $40 all three options’ NPV diminished at a faster rate, and when the WTP was over $60, the WTP was too high so in most cases the mills preferred to purchase SWW over ANW2 (Figure 10A, Figure 10B and Figure 10C). Hence, the three lines merged when WTP=$60, which indicated that there is no difference between immediately switching or delaying the option.
The ‘Delay 1 year’ option had the highest NPV despite which SWW variety the mill is switching away from. When choosing between SWWunspecified to ANW2, the NPV of ‘Immediately switch’ option was nearly equivalent to the NPV of ‘delay 1 year’ option (Figure 10’s bottom two lines). The NPV difference was slightly more significant when switching from SWW10.5% to ANW2 (Figure 10B’s bottom two lines). However, when choosing between SWW9.5% to ANW2, the ‘Immediately switch’ line was closer to the ‘Delay 1 year’ line than the ‘Delay 2 years’ line and the NPV decreases at a slower rate (Figure 10C). This indicates that the changes in a mill’s WTP includes an option value and may influence the mill’s decision to invest earlier (Musshoff et al., 2013). Hence, the price difference between SWW9.5% and ANW2 is more significant and even though the mills are risk-averse, an earlier access is suggested (delay 1 year but not for 2 years) because mills observe an option value generated from ANW2’s lower price.
4. Conclusion and future implications
The Real Options model has replicated anecdotes regarding decision makers’ behaviours’ behaviours, through showing economic value in delay and learning. The hypothesis stated that Indonesian millers choose to accept a known cost, to delay the decision on whether to switch from purchasing SWW to ANW2, with which to supply their customers with flour suitable for cake and biscuit making. To paraphrase, in order to resolve uncertainty over the quality of ANW2, millers are willing to bear a cost in learning, prior to committing to purchase. The hypothesis can be accepted if the Indonesian mills are risk averse or constrained by their storage capacity.
When switching to ANW2, one of the main advantage offered to the Indonesian mills is the Indonesian wheat price. When ANW2 has a significantly lower price compared to SWW, the hypothesis will be rejected. Earlier access to ANW2 is preferred when the wheat price differential is sufficient enough to override the uncertainties in flour quality. Mill’s decisions are more driven by wheat price but, storage capacity is also an important determining factor. Mills with higher storage capacity are better placed to switch earlier. This identifies target mills for grain marketers.
Another advantage offered to the Indonesian mills could be ANW2’s flour performance in making cake and biscuits. The performance of ANW2 is comparable to that of SWW for production of cake and biscuit products. However, the flour performance can vary depending on the individual flour mill milling capability, product testing method, formulations and end quality preferences. Therefore, the ROM has modelled both possibilities, SWW’s flour performance is higher or lower than ANW2. The findings have suggested that the highest NPV is generated from immediate switching to ANW2 while mills receive a three-year-ongoing training from Australia to optimise the use of ANW2. This reinforces that there is an economic value in delaying and learning.
It is important to acknowledge the fact that there are research gaps and difficulties to econometrically examine the explanatory power of the ROA as it does not completely consider the complexity of risk behaviours and bias (Musshoff et al., 2013). Furthermore, SWW and ANW2’s quality difference used in the ROM are raw data, including flour yield and flour performance in making cake and biscuits. A more refined analysis can be conducted when working directly with an individual Indonesian mill. The ROM has not yet analysed the irreversible cost nor the opportunity of hedging against future price. In the future when there is an additional demand on ANW2, the price distribution of ANW2 may be more stable and it is possible that the ANW2 prices will increase. Through hedging, mills can minimise the risks as they may be less impacted by the volatile price movements. Furthermore, the ROM has not yet considered the uncertainties in whether there is adequate supply to provide the industry a consistent supply of ANW2 grains in the long term, and hence additional cost in reverting to SWW. There are more difficulties in encouraging Australian farmers to switch production than it is for the mills to switch grain source. Thus, future studies could analyse the farmer’s switching behaviour and identify the factors that encourage farmers producing and adequately supplying ANW2.
This study has suggested there is a positive option value for the Indonesia mills when they receive trainings before switching to a new wheat variety. This is useful for the Australian wheat industry developing strategies to collaborate with mills and influence purchase of Australian wheat. This model is also applicable for analysing other countries’ soft wheat purchasing behaviour, for example, Japan. With further adjustments, the model is also applicable for hard wheat purchasing analysis. Future experimental studies can invite millers to participate and analyse whether their purchasing behaviour aligns with the suggestions made in the ROM.
Appendix 1

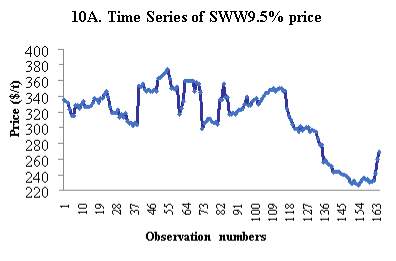
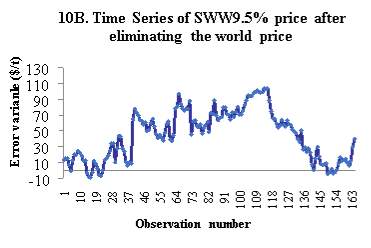
Figure 12 Comparison between the time series of SWW9.5% price before and after eliminating the world price. In figure 10A the price volatility is stronger and fluctuates within a larger range ($220-$380), whereas in figure 10B after eliminating the world price the error variable fluctuates within a smaller range (-$10 – $110)
Appendix 2
Assumptions on the milling model. Note: in the Excel screen shots, SWW is referring to SWWunspecified.
| Description | Excel screenshot | |
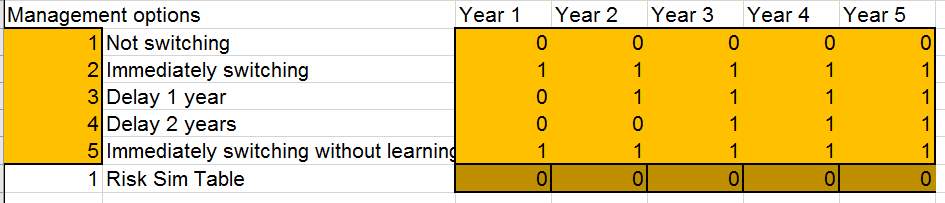
| Management options | 1 = switch to ANW2
0 = keep using SWW Risk Sim Table switches from management option 1 to 5, indicating the model which scenario to simulate. |
 |
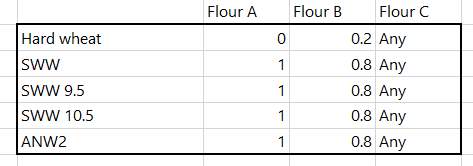
| Flour products | As this project focuses on wheat that are well suited in making cakes and biscuits, the outputs are:
Flour A: Cake flour with 100% soft wheat flour, sold at the highest price. Flour B: Biscuit flour with a blend of 80% soft wheat and 20% hard wheat, sold at a moderate price. All purpose flour: the left over volume that was not used in Flour A and Flour B |
|
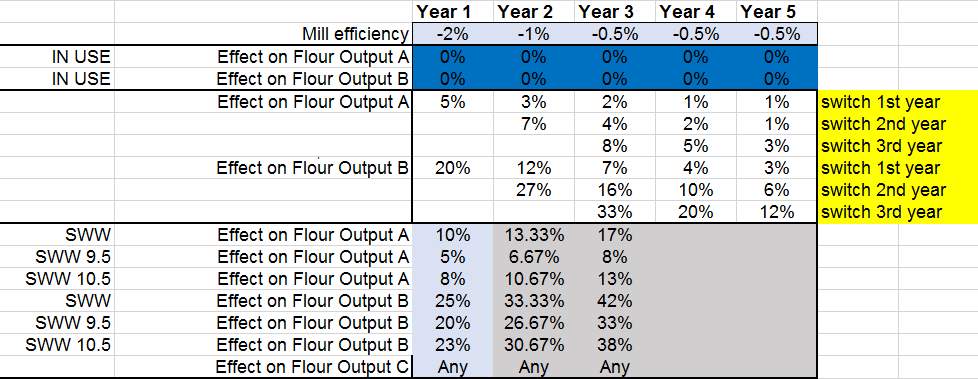
| Flour’s end-product performance | ANW2 flour’s end-product performance is lower than SWW.
The negative effect decreases over the years. When delaying the option, the mills have learnt how to use ANW2, so the negative effect is lower when they start using ANW2. |
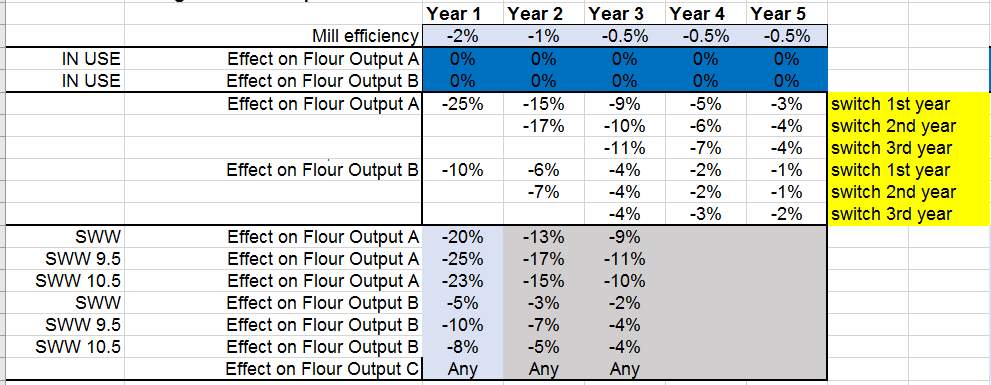 |
| ANW2 flour’s end-product performance is higher than SWW.
The positive effect increases over the years. When delaying the option, the mills have learnt how to use ANW2, so the positive effect is higher when they start using ANW2. |
 |
|
| Willingness to pay (WTP) | The WTP decrease each year as the mill learns how to use ANW2 and the preference for ANW2 increases over the years. | 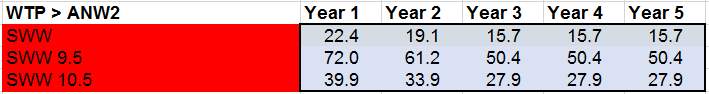
Note: when choosing between ANW2 and SWWunspecified the WTP is lower than choosing between ANW2 and SWW9.5%. |
| Wheat prices | The final wheat price function input to the ROM is:
fx=fe+x Where x = 250 USD, which is a world price for hard wheat. fe=e-ap-1b-eq-1Bp,qb-ab-ap=q-1 Bp,q=∫01ea-1(1-x)b-1dx |
 |
| Cost of changing operation settings | Calibration cost is a calculated cost that includes the additional labour and utilities costs generated from re-calibrating mill settings and the cost of training on how to optimise the ANW2’s end-product performance. The calibration cost is included when the mill first considers using ANW2. The cost will last for a three-year period but decreases each year. | 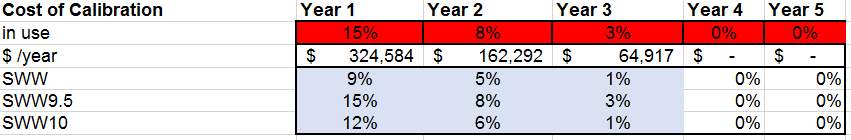 |
| Mill’s operation scale | The frequency of buying is 4 times a year.
Mill capacity: 356 t/day Day of operation: 350 days The milling efficiency loss is higher when the mill switches to a new wheat (ANW2) but the efficiency loss decreases over time. |
 |
References
AEGIC, A.E.G.I.C., 2017. An overview of the Indonesian Milling Industry.
Akaike, H., 2011. Akaike’s Information Criterion, in: Lovric, M. (Ed.), International Encyclopedia of Statistical Science. Springer Berlin Heidelberg, Berlin, Heidelberg, p. 25. doi:10.1007/978-3-642-04898-2_110
Alibaba, 2017. PT. Bungasari Flour Mills Indonesia wheat flour [WWW Document]. Alibaba. URL https://id1225504624fgmy.trustpass.alibaba.com/productgrouplist-230979021/Wheat_Flour.html?spm=a2700.8304367.prup15aafb.2.73152c54Q13HFt (accessed 10.16.17).
Australian Export Grains Innovation Centre, 2015. Wheat [WWW Document]. Aust. Export Grains Innov. Cent. URL http://aegic.org.au/about/australian-grains/wheat/ (accessed 5.6.17).
Australian Securities Exchange, 2016. Trading Australian Wheat Basis Grains Futures.
Blakeney, A.B., Cracknell, R.L., Crosbie, G.B., Jefferies, S.P., Miskelly, D.M., O’Brien, L., Panozzo, J.F., Suter, D.A.I., Solah, V., Watts, T., Westcott, T., Williams, R.M., 2009. Understanding Australian wheat Quality. Kingston.
Brealey, R.A., 2016. Principles of corporate finance, 12th ed. Mcgraw-Hill.
Carver, B.F., 2009. Making of a Wheat Industry, in: Wheat: Science and Trade. pp. 464–469.
CME Group, 2015. Wheat Futures and Options.
Cox, J.C., Ross, S.A., Rubinstein, M., 1979. Option pricing: A simplified approach. J. financ. econ. 7, 229–263. doi:10.1016/0304-405X(79)90015-1
Elieser, P., Hibbs, A.N., 2005. Milling of Soft Wheat, in: Wheat Flour Milling. American Association of Cereal Chemists, Minnesota, pp. 358–362.
Euromonitor, 2016. Baked goods in indonesia.
Featherstone, A.M., Kastens, T.L., 2000. Non-Parametric and Semi-Parametric Techniques for Modeling and Simulating Correlated , Non-Normal Price and Yield Distributions : Applications to Risk Analysis in Kansas Agriculture. J. Agric. Appl. Econ. 32, 267–281.
Goodwin, B.K., Roberts, M.C., Coble, K.H., 2000. Measurement of Price Risk in Revenue Insurance: Implications of Distributional Assumptions. J. Agric. Resour. Econ. 25, 195–214. doi:10.2307/40987056
Grain Growers, 2016. The Indonesian Market for Australian Grains : An Overview.
Grain Trade Australia, 2016. Wheat trading standards 2016/17, Grain Trade Australia.
Grains, I., Estimates, 2017. Grain Market Report.
Gupta, A.K., Nadarajah, S., 2004. Handbook of Beta Distribution and Its Applications, Statistics: A Series of Textbooks and Monographs. Taylor & Francis.
Hertzler, G., Sanderson, T., Capon, T., Hayman, P., Kingwell, R., McClintock, A., Crean, J., Randall, A., 2013. Will primary producers continue to adjust practices and technologies, change production systems or transform their industry? An application of real options. National Climate Change Adaptation Research Facility, Gold Coast.
Kardes, F.R., Cronley, M.L., Cline, T.W., 2011. Consumer behavior. South-Western, Cengage Learning.
Kofman, P., Pinder, S., 2016. Approximation of real option values using decision trees [WWW Document]. Cousera. URL https://www.coursera.org/learn/valuation/lecture/C6Z1O/4-3-approximation-of-real-option-values-using-decision-trees-options-do-grow-on (accessed 5.12.17).
Le Gall-Ely, M., 2009. Definition, Measurement and Determinants of the Consumer’s Willingness to Pay: a Critical Synthesis and Directions for Further Research. Rech. Appl. Mark. 24, 91–113.
Liu, M.C., Flores, R.S., Deyoe, C.W., Posner, E.S., 1992. Assessment of a computer simulation model for the flour milling industry. Cereal Foods World 37, 649–654.
Maart-Noelck, S.C., Musshoff, O., 2013. Investing today or tomorrow? An experimental approach to farmers’ decision behaviour. J. Agric. Econ. 64, 295–318. doi:10.1111/j.1477-9552.2012.00371.x
McFall, K., Studer, V., 2010. Driving your mill to maximum profitability [WWW Document]. Word Grain. URL http://www.world-grain.com/Departments/Milling-Operations/2010/9/Driving-your-mill-to-maximum-profitability.aspx (accessed 5.8.17).
Musshoff, O., Odening, M., Schade, C., Maart-Noelck, S.C., Sandri, S., 2013. Inertia in disinvestment decisions: Experimental evidence. Eur. Rev. Agric. Econ. 40, 463–485. doi:10.1093/erae/jbs032
Newbery, D.M.G. and S.J.E., 1981. The theory of commodity price stabilization : a study in the economics of risk. Clarendon Press.
Palisade Corporation, 2017. Monte Carlo Simulation [WWW Document]. URL http://www.palisade.com/risk/monte_carlo_simulation.asp (accessed 9.17.17).
Pastor, R., Scoville, J., 2013. Indonesia buys wheat on lower prices,; wheat shipped to Philippines and Malaysia.
Pažek, K., Rozman, Č., 2012. Option models application of investments in organic agriculture, in: Konvalina, P. (Ed.), Organic Farming and Food Production. InTech, pp. 47–62. doi:10.5772/52008
Petersen, E., Hertzler, G., Schilizzi, S., 2010. The impact of price and yield risk on the bioeconomics of reservoir aquaculture in north Vietnam. Aquac. Econ. Manag. 14, 185–201. doi:10.1080/13657305.2010.503466
Posner, E.S., Hibbs, A.N., 2005. Milling management, 2nd ed. American Association of Cereal Chemists, Minnesota.
Posner, E.S., Hibbs, A.N., 2005. Wheat: The Raw Material, in: Wheat Flour Milling. American Association of Cereal Chemists, Minnesota, pp. 33–34.
Rodney, K., Holcomb, P., 2004. Flour Milling Feasiility Template. Oklahoma State University.
Ryan, Patricia A and Ryan, G.P., 2002. Capital budgeting practices of the Fortune 1000: How have things changed? – ProQuest. J. Bus. Manag. 8, 355–364.
Sanderson, T., Hertzler, G., Capon, T., Hayman, P., 2015. A real options analysis of Australian wheat production under climate change. Aust. J. Agric. Resour. Econ. 60, 79–96. doi:10.1111/1467-8489.12104
Saphores, J.-D.M., 2000. The economics threshold with a stochastic pest population: a real options approach. Source Am. J. Agric. Econ. 82, 541–555.
Siah, S., Adriansz, T., Carter, C., White, P., Cox, B., 2016. Can downgraded Australian Noodle Wheat (ANW) be used for producing cracker biscuits? Australian Export Grains Innovation Centre.
Stretch, T., Carter, C., Kingwell, R., 2014. The cost of Australia’s bulk grain export supply chains 40.
Tauer, L.W., 2006. When to Get In and Out of Dairy Farming : A Real Option Analysis When to Get In and Out of Dairy Farming : A Real Option Analysis. Agric. Resouce Econ. Rev. 2, 339–347.
U.S Wheat Associates, 2017. USW: Price Reports [WWW Document]. URL http://www.uswheat.org/prices/archive (accessed 8.2.17).
Vanneck, P., 2016. Finding the right distribution.
Varela, G.J., Taniguchi, K., 2014. Asymmetric Price Transmission in Indonesia ’ s Wheat Flour Market adb economics working paper series. ADB Econ. Work. Pap. Ser. 394.
Welirang, F., 2017. Indonesian wheat flour industry overview. Association of Floour Producers in Indonesia.
Yamamotto, M., 2017. ANW2 prices. Perth.
[1] Wheat price differential is highest when comparing SWW9.5% to ANW2, followed by comparing SWW10.5% to ANW2, and comparing SWWunspecified to ANW2.
Cite This Work
To export a reference to this article please select a referencing stye below:
Related Services
View all


Related Content
All TagsContent relating to: "Agriculture"
Agriculture is the cultivating of food, goods or livestock through farming. Agriculture began independently at different times around the world thousands of years ago.
Related Articles

DMCA / Removal Request
If you are the original writer of this dissertation and no longer wish to have your work published on the UKDiss.com website then please: