Analysis of Airbnb: Impact in the Lodging Industry
Info: 7776 words (31 pages) Dissertation
Published: 12th Jan 2022
Aims & Objectives
Research Aim:
To evaluate and analyse the impact of Airbnb in the lodging sector.
Objectives:
- To determine and analyse the particular niche market which is focused the firm.
- To analyse the new trends in the lodging sector.
- To compare the growth between the company and the hotel industry.
- To compare the firm situation in different parts of the globe.
- To analyse the firm international business strategy.
- To create a new strategies and recommendations.
Introduction
“Belong anywhere”. With this slogan Airbnb has been able to make the members of its community having a sense of belonging, because the use of new technologies enables to bring people together, hosts and guests rather than isolating them (Chesky, 2014).
In the last decade, the rapid growth of the internet usage has had as a consequence the explosion of range and thickness of what has been named as sharing economy. (Lessig, 2008)
Internet has enabled people to collaborate in altogether new ways. From knowledge sharing websites to social media platforms that facilitate human relationships where people are sharing their time and skills by creating a virtual sharing community (Share The World’s Resources, 2012).
It is also known as peer-to-peer economy or collaborative consumption, which profitability is coming from the use of something that the users have in excess on behalf of someone else who needs its goods (Interian, 2016). This may be a lodging service by Airbnb, transport service which is provided by Uber or even used goods provided by Ebay, which are considered amongst the most important organisations within the sharing economy.
There are several factors that have to be considered on the growth of the sharing economy. These factors include the reduction of the ecological impact where waste is eliminated in a convenient and cost-efficient way (Interian, 2016), the social-economic conditions in the last decade which addressed the consumer to search better value for money and lastly the shift of users’ attitude towards ownership and the social connection needs (Chang, 2016).
Sharing economy has been affected by the internet’s design offering an enormous range of new opportunities. Differentiated from the commercial economy where the only thing that matters is the price, the sharing economy is regulated by a more complex social relations system. (Lessig, 2008).
Airbnb is an online peer-to-peer (P2P) corporation which is framed in the lodging industry. Its aim is to create a platform where (hosts) people who rent a bed in excess in their own property or offer the whole living space are meeting with the guest. (Interian, 2016) There are two main elements which are offered and experienced by the guest. The first and most important is the product features where tangible aspects are measured, such as number of rooms, size or location. The second element to take into consideration is the host attributes measuring intangible aspects such as fairness, responsiveness or hospitality. (Ert, Fleischer & Magen, 2016).
The company began as Airbed and Breakfast when the flatmates Brian Chesky and Joe Gebbia decided to provide airbed mattress with breakfast included from their living room as alternative accommodation in San Francisco in 2007. Next year, Airbedandbreakfast.com was launched when Nathan Blecharczyk joined the project, Shortly after the name changed to a shorter version that is currently well-known as Airbnb.com. Its international expansion started in 2011 with the opening of the first office in Hamburg. (Statista, 2016) Now, the organisation is operating in more than 34.000 cities in 191 different countries. In 2011 the firm had accounted 120.000 worldwide listings, the amount of listings has grown rapidly since then, accounting 2.5 million for 2016. The estimated revenue for 2015 was 900 million dollars with a forecast of 10 billion Dollars for 2020 and the most recent valuation of the company is about 30 billion dollars in 2016 (Southan, 2016). The organisation profitability is coming from the host who has a 3% commission of the lodge provided and on the second hand there is a fee in the range between 6% and 12.5% which the guest is charged as a reservation cost (Interian, 2016).
The rapid growth and expansion of the company might raise concerns from the hotel or lodging industry, where the possible impact caused in the sector would affect into the traditional hotel with a reduction of customers. This could be battled with price reductions, however triggering a decrease of the profitability.
Literature review
Hotel
The demand in the hotel industry depends on external and internal factors. Among the external factors is included factors such as economic instability (BREXIT, exchange rate), terrorist acts (Paris, Brussels..), Pandemics, (Zika virus). The internal factors in the hotel industry are considered aspects such as costs, which in the case of Airbnb are very low due to its specific features, other aspects considered are size, reputation or being member of a franchise and quality of service. It is considered that the hotel profitability is depending mostly on internal factors by 83% and the external factors influence in the profitability by 9%. Furthermore, is considered that the profitability of this sector depends highly on the sales variance provoked by variances in demand or the increment in supply (Aznar et al., 2017)
AIRBNB
Airbnb represents the sharing economy within the lodging or accommodation industry. Is it known for its community marketplace where the hosts and travellers can meet in order to offer or book respectively a large list of accommodations around the world. The organisation is operating in more than 34.000 cities in 191 different countries offering different types of rentals including houses, apartments and bedrooms. The Airbnb system allows the company to reduce considerably the costs, which makes the final price lower. The use of internet has helped to increase the participation in the community which includes different ranges of ages different cultural background and nationalities. The trust and transparency from the users is reinforced by reviews from both parts after the service. The firm is verifying the identity of the users previously.(Lee and Kim, 2017) These factors have helped to the growth of the firm globally. This rapid growth has to be taken into consideration by the industry, because an increase on the demand of this type of service might affect directly on the demand of the classic lodging market. However, the impact might be experience much more by lower-end hotels, than by high-end, business, and luxury hotels (Varma et al., 2016).
SHARING ECONOMY
The sharing economy emerged from what was called collaborative consumption. In the collaborative consumption the users can share, buy or rent different assets or services in order to reduce the cost or save money, in this specific case the host is renting a room in order to be able to pay mortgage and the hostage is saving money comparing with the hotel room.(Kim, Lee, Koo & Yang, 2017). Price is it not always the motivation to chose Airbnb because in some of the U.S. cities the price average is higher than the hotel accommodation (Liang, Choi and Joppe, 2017).
Thanks to internet the sharing economy has gained more importance. In 2015, Sharing economy firms have provided about 60.000 jobs in U.S. Furthermore, it is forecasted that by 2025 the sharing economy will generate 335 billion of Dollars helped with the successful start-ups such as Uber, Ebay or Airbnb. This concept of business promotes the exchange of properties goods or skills between the users that are connected by internet via social media. The development of the smartphones has implemented the use and growth of this kind of companies (Liang, Choi and Joppe, 2017).
Innovation-technology
The term innovation refers to explore something new that previously not existed. A company is able to develop new processes, products or technologies. The innovations are classified in four types: behavioural, product, process and market innovation (Turulja and Bajgoric, 2016)
Innovation is a competitive advantage which is difficult to imitate or replicate. Airbnb has an innovative advantage comparing to the traditional hotel industry is creating a new market spaces, find new solutions for potential customers and creates a new business model (Lasserre, 2012).
The fast development in technology enables business to find innovative ways to attract potential clients; Uber is considered the largest in the world on its sector as well as Airbnb the largest lodging firm on the globe. These technology startups have changed the way to reach lodging or taxi services from the users. Now, the users have increased their choices with a more efficient and affordable system to book these services (Varma et al., 2016).
Millennials
A generation is considered to be all of the people of about the same age born and living within a society surrounded by the same political, economic, societal and cultural influences (Benckendorff, Moscardo & Pendergast, 2010). 1
Generation Y or Millennials refers to people born between 1977 and 1998 (Benckendorff, Moscardo & Pendergast, 2010) . 2
They are optimistic, confident, interactive and collaborative and also considered the most educated generation. The are digital experts as they tend to spend many hours in front of a screen and they form communities via the Internet as they grew up in an increasingly electronic world. Their characteristics are that they like to network and being team-oriented and they value travelling and experiencing events and places. In comparison with previous generations, the increased freedom to travel, the easy access to information and touristic opportunities and the low-cost carriers’ options have made travel more accessible for Millennials. Furthermore, the shift of the family values and the delay of marriage and kids have resulted in a higher number of singles travelling and a change of demand in the tourism sector. The Generation Y eased by the Internet and the technology focused society, consists the idea of a global digital community (Benckendorff, Moscardo & Pendergast, 2010) .3
It is considered the first global generation by experts, which are characterized by the search of authentic experience, to have more control of the activities, interest for new cultures and contact with the locals (ITB Berlin, 2016).
Many managers from the hotel industry view Airbnb as using a niche market, however many investors and analysts claim the opposite and anticipate interruptions within the sector, particularly by Millennials. (Varma et al., 2016)
The raised demand for shorter weekend breaks and the cheaper travelling options have increased the demand of city breaks. People tend to choose cities than the usual favourite destination, the summer beach holiday. People between 16-34 years old seem to prefer shorter breaks, and there is a tendency of 1-3 nights stay usually in a city. More specifically, 46% of vacationers went on a city break for holidays in comparison to 42% of people going to a beach destination in 2016. There is a growth of 8.6% to 43.2 million of the city break demand, whilst expenditure increased by 11.5% to £9.4 billion in 2016. (Mintel, 2017)
Methodology
The methodology used will be a secondary research based on published journal papers, searched throughout Science Direct, EBSCOHost, which amongst others are the largest and with the higher reputation searching engines. The articles published in refereed academic journals will be the most relevant in the research. Outstanding online database will be updated, analysed and taken into consideration from Mintel, Estatista, Euromonitor or similar sources where the information is reliable and trustable as it comes from trades sources and national statistics. Industry reports will be considered in this research due to the difficulties presented by the firm, as Airbnb is not publishing its accounts and financial results is a private company and has not intention yet to go public (Reuters, 2017), which makes the process more laborious to find data and statistics from them. Prestigious and relevant magazines or newspapers like Financial Times will be also considered in order to maintain updated the information about the firm and the sector.
The methodology will follow a scientific or positive approach, where the results or outcome will be reached by analysing and gathering the information previously mentioned provided by secondary research sources.
The type of research undertaken for this project will be mostly a quantitative research, aiming to measure the impact of Airbnb in the lodging industry. In order to achieve it, large amount of data and statistics will be examined from relevant sources such Euromonitor or Statista.
In this project qualitative research will also be used, which will allow a better understanding of the sharing economy trends, mainly by looking at current and future customer behaviour trends. It will allow reaching other objectives of this project such as analyse the firm status in different countries worldwide or identify future opportunities that the market might offer. To obtain this information, referred academic journals, relevant magazines and the company website will be examined.
Relevant information has been collected from previous literature based on lodging rentals (Slee, 2017), where is found the number of listings of the last years provided by the firm in the main cities in western Europe, this data has been collected from the official website without logging in and will allow to determine the trend of the amount of listings offered in the website in different cities from western Europe. Furthermore, more relevant data has been collected from (Inside Airbnb, 2017), where is taken into consideration aspects such as the room type, availability and listings per host. These will allow to a better comprehension of how the hosts are using the internet platform in the different 10 cities in Europe.
In order to analyse the hotel industry trends, data from Barnes reports about the worldwide industry market has been considered where is seen the data since 2014 and forecasted to 2018 (Barnes, 2017).
Analysis
In order to analyse the trend of the firm in terms of listings data has been collected from the website tomslee.net. Different cities from Europe such as Amsterdam, Barcelona , Berlin, Copenhagen, Dublin Edinburgh, Lisbon, London, Madrid, Paris and Rome are included in this study where it is seen the number of listings per city from 2013 to 2017. Most of these cities do not have the updated data for 2013, this might have two explanations: Airbnb was not established in these cities in 2013 or the author of the data collection did not take them into account (Slee, 2017).
| city/year | 2013 | 2014 | 2015 | 2016 | 2017 |
| Amsterdam | 5645 | 7693 | 13360 | 16592 | |
| Barcelona | 10441 | 12467 | 17154 | 17269 | |
| Berlin | 7789 | 11553 | 16135 | 18473 | |
| Copenhagen | 7884 | 8248 | 17852 | ||
| Dublin | 3625 | 6473 | |||
| Edinburgh | 1127 | 1689 | 4571 | 7129 | |
| Lisbon | 5652 | 8968 | 11792 | ||
| London | 13054 | 13237 | 21298 | 34414 | 53947 |
| Madrid | 7490 | 5393 | 12615 | ||
| Paris | 19004 | 19946 | 31341 | 55951 | 61666 |
| Rome | 1714 | 7810 | 15703 | 17900 | 25226 |
As it is seen, that all the cities have doubled the amount of listings from 2015 to the beginning of 2017 which is the most updated data. It is also seen clearly which are the cities that offer more accommodation in Airbnb. These are Paris and London with 61,666 and 53,947 listings respectively. It is also seen that Dublin and Edinburgh are the cities with less listings available with 6,473 and 7,129 respectively (Slee, 2017).
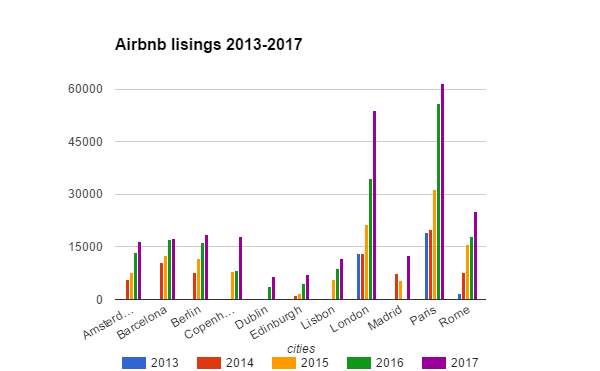
The rest of the cities have an average of 18.000 listings available, being Rome over the average with about 25,000 listings, the capital of Italy (Slee, 2017).
Data collected from insideairbnb.com has been considered for a deeper analysis of how is Airbnb’s situation of the previous listings offered, Lisbon and Rome have been discarded for the study due to the lack of information available for the respective cities in this website. Relevant data has been considered such as the type of lodging offered which it can be the entire apartment, a room or a shared room. Activity refers to the average of nights per year that the listing is actually being used. High availability refers to the average of listings that are over the maximum allowed by law or by the terms and conditions of the website agreement. Multi-listings are referred to the average of hosts that are offering more than one accommodation through the firm. Maximum days per year are referred to the maximum of days that can be rented a listing per year according to the city-country legislation system. This data is not fixed and is varying depending on the particular law of the location (Inside Airbnb, 2017).
| cities | apartment | room | shared room | activity | high availability | multi-listings hosts | Max. days/year |
| Amsterdam | 80,60% | 18,80% | 0,50% | 96 | 51,60% | 24,60% | 60 days |
| Barcelona | 50,40% | 48,40% | 1,20% | 99 | 71,70% | 57,50% | 90 days |
| Berlin | 60,70% | 38% | 1,30% | 121 | 73% | 26% | 90 days |
| Copenhagen | 80% | 19,50% | 0,50% | 58 | 46,30% | 12,20% | 60 days |
| Dublin | 47% | 50,30% | 2,70% | 98 | 49,90% | 43,80% | 90 days |
| Edinburgh | 54,70% | 44,40% | 0,90% | 82 | 63,60% | 43,80% | 60 days |
| Lisbon | |||||||
| London | 51,20% | 47,30% | 1,40% | 89 | 58,80% | 40,90% | 90 days |
| Madrid | 60,20% | 38% | 1,80% | 99 | 73,80% | 52% | 90 days |
| Paris | 85,70% | 13,30% | 1% | 91 | 53,60% | 20,80% | 120 days |
| Rome |
As it is shown in the table, in the majority of the cities, the listings offered in the website are composed mostly by entire homes , only Dublin is offering less than 50 per cent of its listings, the rest of the cities have more than 50 per cent. In the table it is shown the cities that are offering mostly a room instead of a whole property, among them are Barcelona, Dublin, Edinburgh and London. Furthermore, the table shows that the shared room listings offered in the website represent about 1 per cent in all the cities (Inside Airbnb, 2017).
The table shows that the average activity per listing is slightly above of the maximum allowed by law. Berlin with 121 average nights per year is the city that has the most availability per listing. On the other hand, Copenhagen is the city that has less activity per listing being below of the maximum allowed in the city with 58 nights per year.
Looking at the high availability data, it is shown in the table that the cities listings are being used over the maximum allowed by 46 per cent or more, being Copenhagen with 46.3% the lowest and Madrid and Berlin the highest with 73.8% and 73% respectively.
Lastly, as it is seen in the table, there is a considerable amount of hosts that have multi-listings on Airbnb, Copenhagen is the lowest with 12.2% and Barcelona is the highest with more than 57 per cent (Inside Airbnb, 2017).
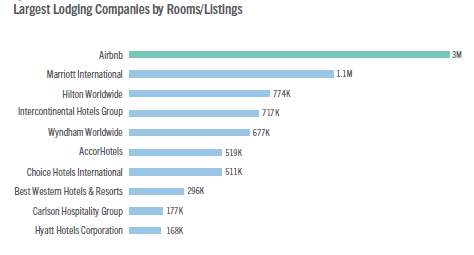
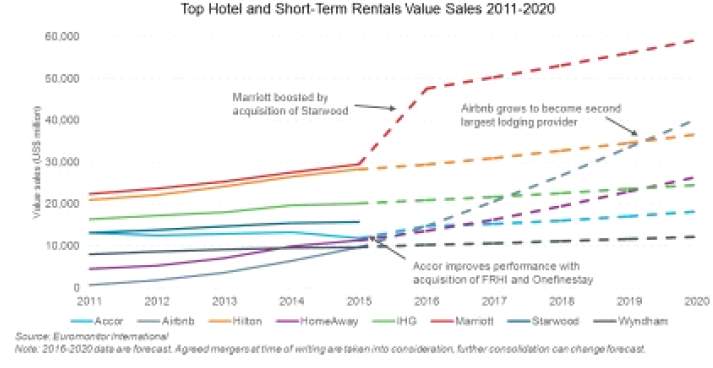
In order to understand the size of Airbnb and compare it with the most prestigious hotel chains, the amount of rooms or listings being offered has been ranked by STR.
Airbnb had at the beginning of 2016 about 3 millions of listings/rooms worldwide. Almost three times more than Marriott International that was the second of the largest lodging companies in the world. The rest of the hotel chain do not offer even a third of what is Airbnb offering around the world (STR, 2017).
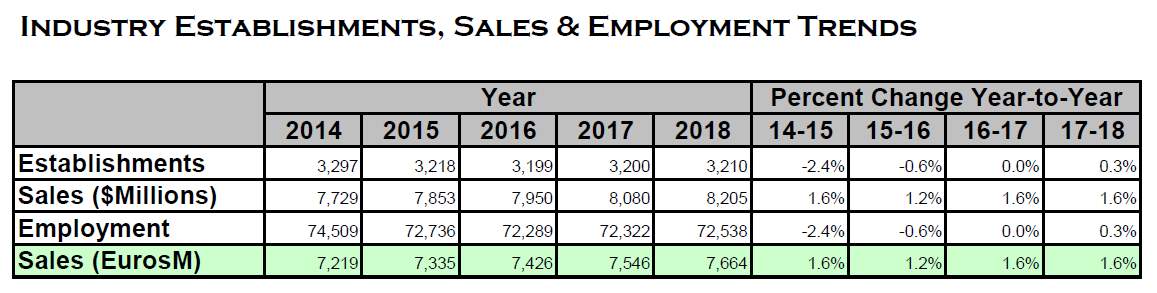
In order to understand the hospitality industry trends from the previous mentioned European cities, has been taken into consideration the trends of the respective countries which has been collected by Barnes in a 2017 industry report. The tables are collecting data from 2014 and forecasting 2017 and 2018 with the number of establishments and the sales, where it is seen the percentage of growth year to year (Barnes, 2017).
Netherlands has decreased the number of establishments from 2014 to 2017 by 97, from 3,297 to 3200 respectively, it is estimated that for the year 2018 the number of establishments will increase by 10. On the other hand, the table shows that the sales from 2014 to 2017 has increased from 7,729 millions to 8,080 millions respectively, which represents a growth average of about 1.5% per year, it is estimated that for 2018 will increase at the same level 1.6% (Barnes, 2017).
NETHERLANDS
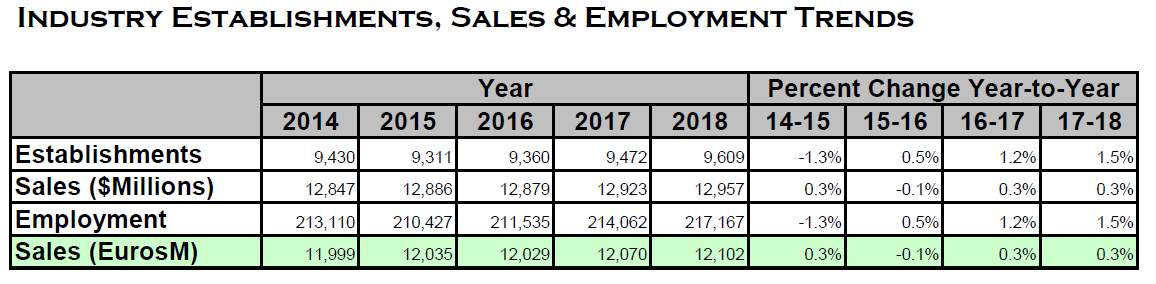
Spain has decreased the number of establishments from 2014 to 2016, by 70. However on 2017 has increased by 112 and estimating for the next year a 1.5% growth. On the other hand, the table shows that the sales growth is low with an average of 0.2% since 2014 and estimating for 2018 a growth of about 0.3% (Barnes, 2017).
SPAIN
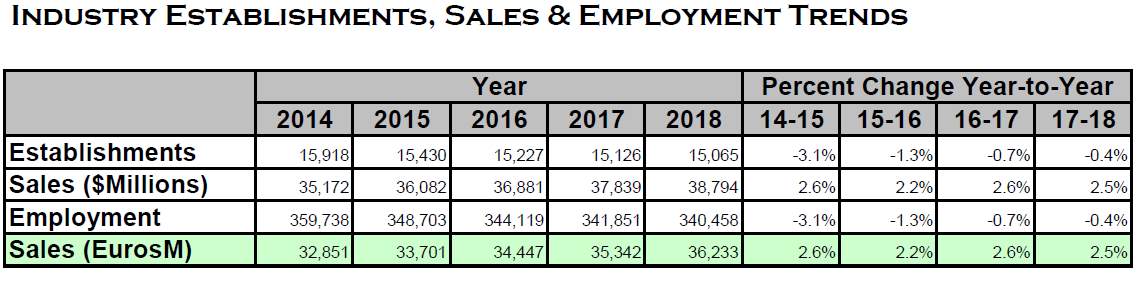
Germany’s number ofestablishments has been reduced from 2014 to 2017 from 15,918 to 15,126 and it is expected to reduce more for 2018 with an average of -0.4%. However, sales has suffered an increment average of about 2.5% between the years 2014 and 2017, being predicted for 2018 a steady increase of 2.5% of the sales (Barnes, 2017).
GERMANY
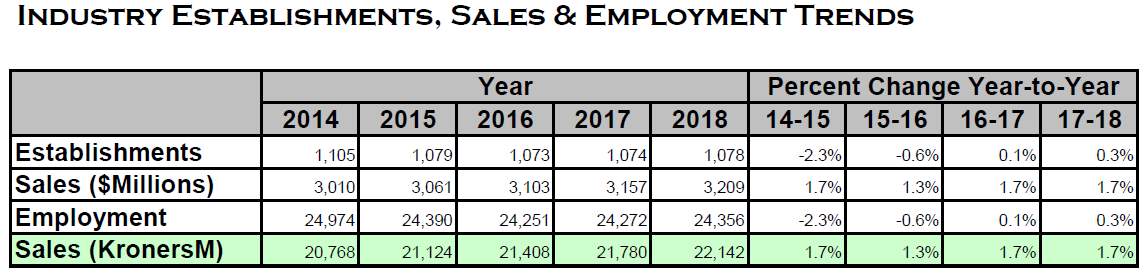
The number of establishments in Denmark has declined from 2014 to 2017 in 31 units, from 1,105 to 1,074 and it is estimated a slightly increase of 0.3% for 2018. However, the table shows that the sales has increased in about 2.5% from 2014 to 2017 being expected an steady increase of 2.5% for the next year (Barnes, 2017).
DENMARK
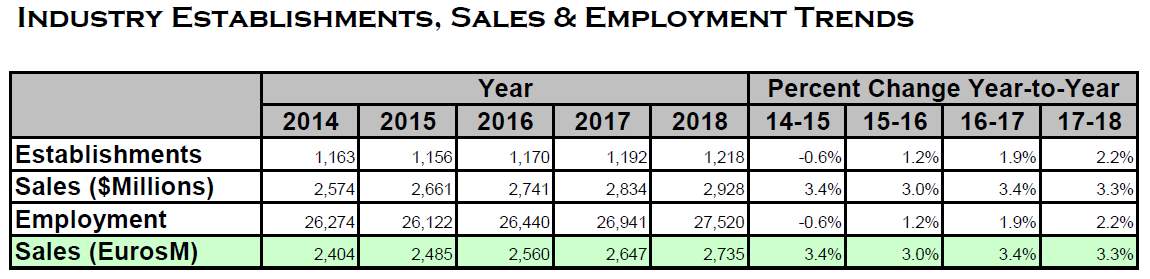
Ireland’s number of establishments has been increased from 2014 to 2017 from 1,163 to 1,192 and it is expected to increase more for 2018 with an average rate of 2.2%. On the other hand, the sales have also increased by 3.2% average from 2014 to 2017, and has been predicted for 2018 an increase of 3.3% (Barnes, 2017).
IRELAND
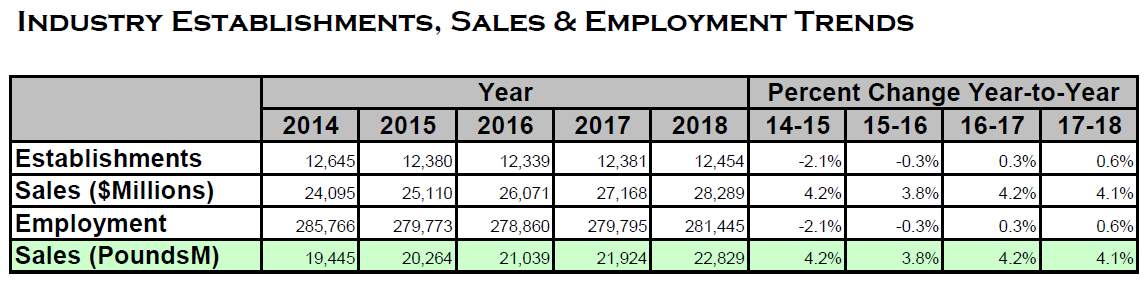
The number of establishments in United Kingdom has declined from 2014 to 2017 in 264 units, from 12,645 to 12,381 and it is estimated an increase of 0.6% for 2018. However, the table shows that the sales have increased in about 4% for the same period being expected an increment of 4.1% for the following year (Barnes, 2017).
UNITED KINGDOM
France’s number of units has been reduced from 2014 to 2017 from 12,104 to 11,882 and it is estimated a change in the trend for 2018, increasing by 0.7% the establishments. However, in terms of sales it is seen in the table that has increment the sales ratio for the same period in about 2.5% average. It is estimated an increase of the sales for 2018 by 2.7% (Barnes, 2017).
FRANCE

Overall, it is seen in the tables that the general trend of the number of establishments is descending with the only exception of Ireland that shows a positive trend. The majority of the countries have forecasted for 2018 an increase of units, except Germany which will decrease. However, as it is shown in the tables the general sales trend is positive between 2% and 4% of for the last three years, excepting Spain which has very low sales ratio. Generally, the sales ratio for the next year is expected to be positive (Barnes, 2017).
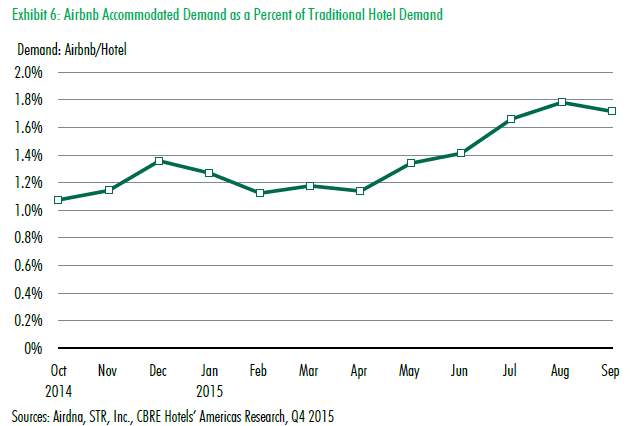
CBRE Hotels report information has been considered in the United States Lodging industry due to its reputation within the sector. In the report information has been selected from U.S. and compared different types of rates between Airbnb and the traditional lodging industry trying to measure the risk for the hotels, this report covered 59 cities including 229 submarkets in U.S. (CBRE Hotels, 2016).
The chart shows the share of demand that Airbnb is taking from the hotel industry in United States from October 2014 to September 2015 which increased by 0.8% from about 1% to almost reach 2% of the hotel market share. It is showing a peaks in December and August where it is most likely the increment of the demand due to the holidaymakers season (CBRE Hotels, 2016).
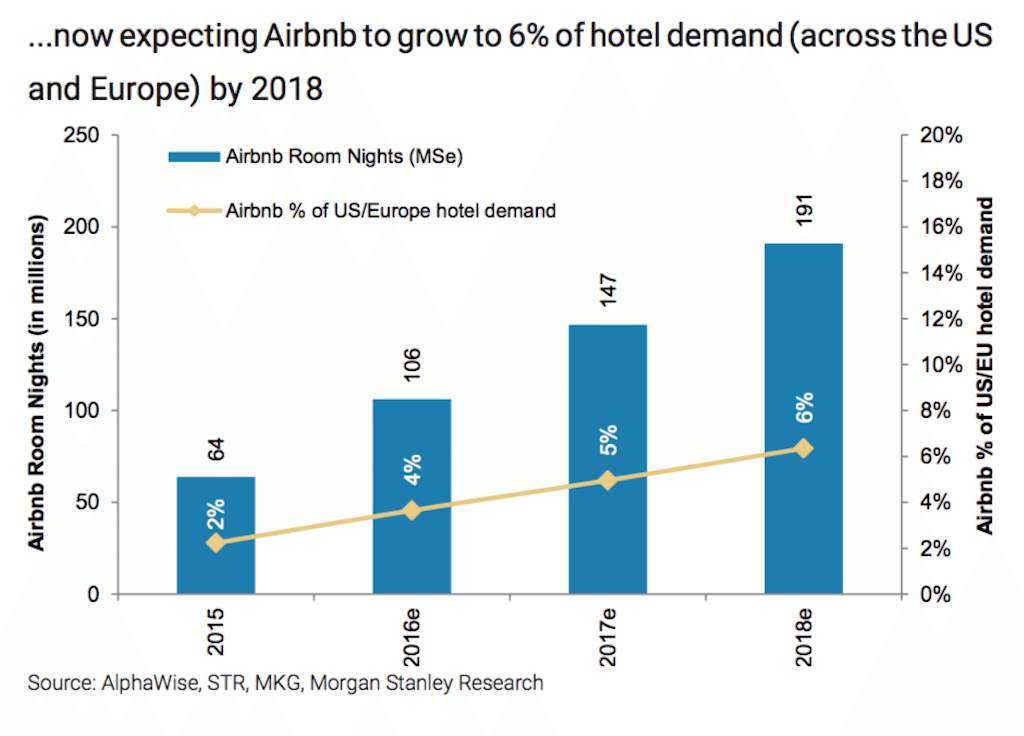
Morgan Stanley research analysed the share of demand that Airbnb is taking from the hotel industry in United States and Europe from 2015 to 2018. It is seen in the chart the share of demand that Airbnb was taking in 2015, and the estimated for 2016, 2017 and 2018, it is expected to have a 6% of the hotel demand share for 2018 with a trend that seems to grow by 1% per year (Ting, 2017).
The World Travel Monitor Forum which gathers 50 global experts from Europe, Asia and America, in representation of international and national tourism firms and associations, and companies from the private sector, has discussed about the sharing lodging providers and the experts calculations from Europe users in 2015 trips is that are represented by 3% of the demand. This data is similar to the previously provided by Morgan Stanley but considering also United States in their calculations (ITB Berlin, 2016).
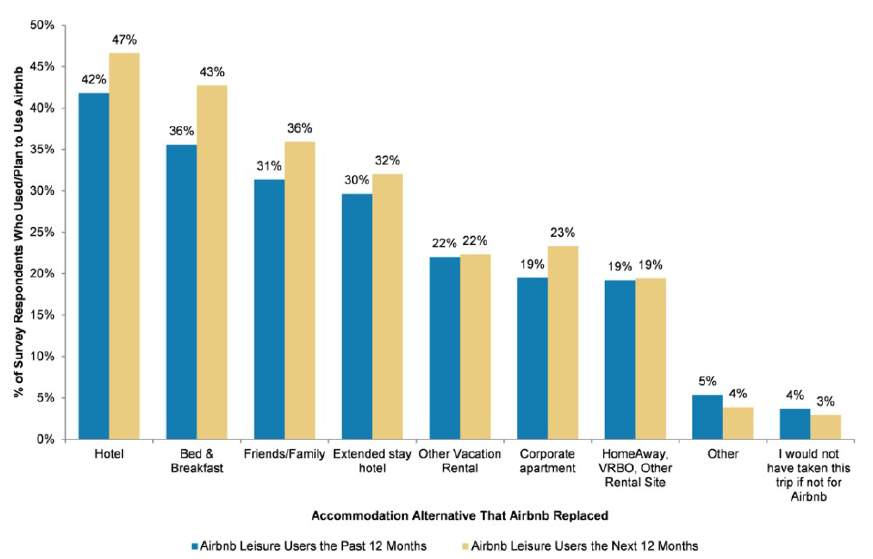
In order to study the consumer behaviour of the Airbnb users a survey was made by AlphaWise in 2015. The survey was made to 4,116 persons over 18 years old in United States, Germany, France and United Kingdom. A relevant question for the case study was made; the the survey asked which was the accommodation that Airbnb users have replaced. The questionnaire also estimated the intention of the users for the next year 2016. Alphawise estimated that its results have a 90% level of confidence, with a 3% of margin of error (Morgan Stanley, 2015).
The results of this specific question from the survey are represented in the following graph, it is seen that the users of Airbnb are replacing by 42% the traditional hotel in 2015, increasing by 5% for the next year. According to the graph it is representative that most of the demand is coming from the traditional hotel industry and it is estimated to increase the numbers of Airbnb users that replace the hotel (Morgan Stanley, 2015).
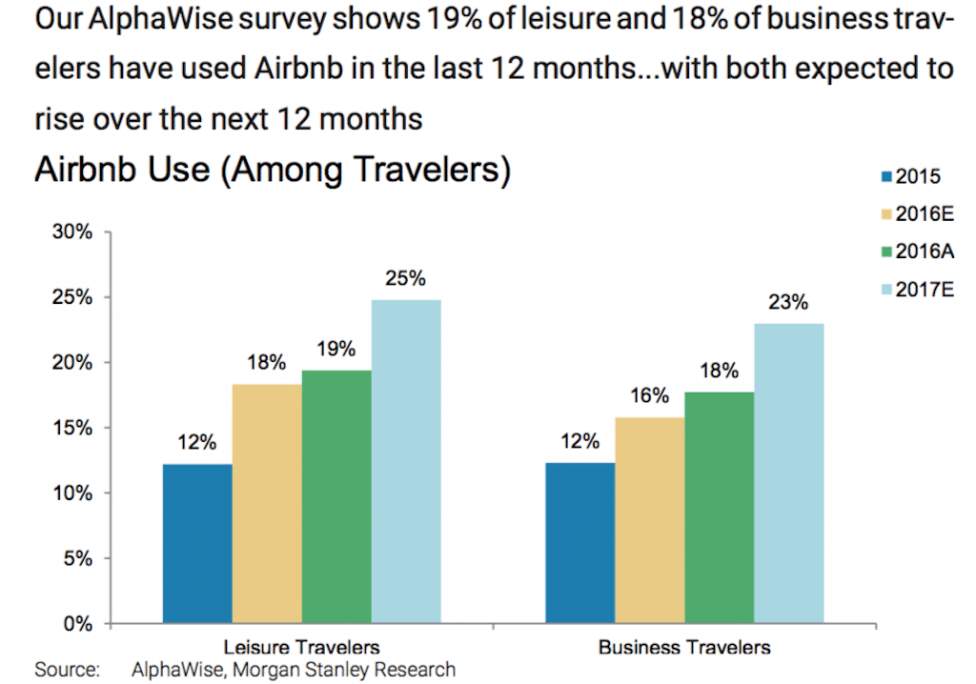
AlphaWise on its survey made another relevant question to understand the Airbnb user and its trends, the questionnaire asked about leisure and business users of airbnb in 2015 and their intention for 2016. It is seen in the graph that for both business and leisure the percentage of users was 12%, increasing both for the next year being leisure the top choice with 18%. A further study made by Morgan Stanley that can be also seen in the graph, revealed that the average for leisure and business for 2016 was even higher than Alphawise predicted being 19% and 18% respectively. Morgan Stanley is estimating for the year 2017 a significant growth for both, with a forecast of 25% for leisure and 23% for business (Ting, 2017).
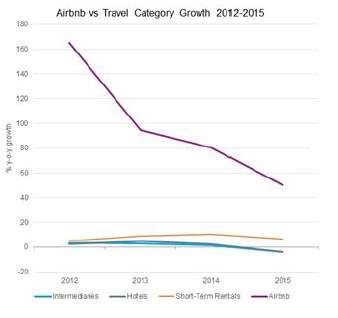
Airbnb around the world has been analysed by Euromonitor collecting data from 2012 to 2015 and being compared with relevant competitors such as intermediaries, short-term rentals and hotels. It is seen in the graph that it is compared Airbnb with competitors in terms of Compound Annual Growth Rate (CAGR), The firm trend is downwards from 2012 to 2015, but has 50% CAGR in 2015 while hotels CAGR trend is downwards too but reaching a negative average for 2015 of about -5% (Euromonitor international, 2016).
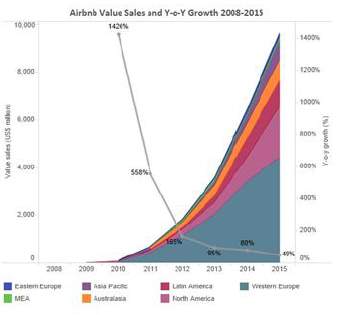
In the Euromonitor analysis has been evaluated a growth ratio comparing different areas of the globe such as Eastern Europe, Asia pacific, Latin America, Western Europe, MEA, Australasia, North America from 2009 to 2015. The Graph shows that the Growth ratio has been reduced through the years reaching 40% in 2015. It is seen clearly that Western Europe and North America are the areas were Airbnb is more dominant in the world and has had more impact, representing these two areas more than a half of this growth (Euromonitor international, 2016).
Eurominitor New_Global_Briefing_The_Sharing_Economy_in_Lodging
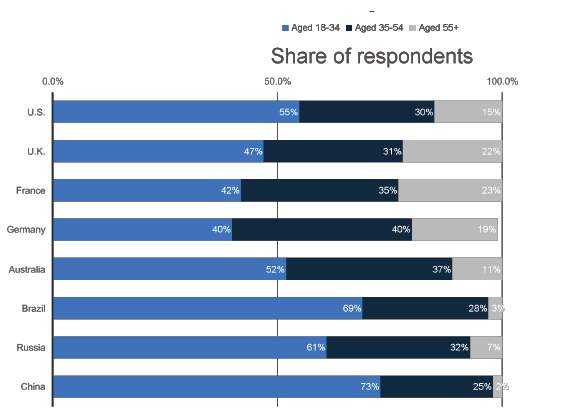
A survey made by Phocuswright in 2014 has been considered to a deeper understanding of the sharing economy accommodation users. The survey has included a total of 8,045 individuals which are 18 years and older and have a travel experience within the last year. The questionnaire has been answered by individuals from different countries around the world including United States, United Kingdom, France, Germany, Australia, Brazil, Russia and China. The respondents have been ranged by groups’ ages, more specifically three, millennial from 18 to 34 and then two more groups, from 35 to 54 and more than 55. It is shown in the graph that the group of millennials is higher or equal to the other groups in all countries. In Germany, millennials represented by 40% is the lowest by country, and In China it is considerably superior to the rest of groups by 73% (Statista, 2016).
However, an analysis by Euromonitor in 2016 of the sharing economy in lodging counted about 25% of the world population as Millennials which is a great market. And reveals that Airbnb users average age has been incremented, establishing the average user in around 35 years (Euromonitor international, 2016).
Results
The data obtained from listings offered in Airbnb from European capitals are represented in the Figure 1 and 2. The number of listings on these cities have been doubled or tripled, in many cases showing the market penetration of the firm in these locations. Increasing rapidly the supply the platform becomes more competitive within the sector and enhances the brand itself. The cities where the brand has entered easier and with highest endorsement are London and Paris; in these cities the number of listings is double or more comparing with the rest. It is considered that an increase in the supply of Airbnb accommodations affects directly to the sector because the profitability depends on variations of revenues which are caused by increment in supply or changes in demand (Aznar et al., 2017).
The characteristics of the listings from Europe sampled were analysed as it is shown in the Figure 3 in order to have a deeper knowledge. It is clear by the sample that most of the listings offered in these cities are the entire apartment, in some of these cities reaching 80%. However, the listings offered as room or shared room is less significant representing between 50% and 20% depending on the city. It is shown that overall many host posted more than one property between 12% and 57% of the hosts of the European cities.
Furthermore, it is shown that most of the hosts rent the property for more days than the maximum allowed; the law varies depending on the city that is going from 60 or 90 days with the exception of Paris which is 120 days (O’Sullivan, 2016). More than 50% of the listings have been rented for more days than the maximum permitted. This host profile is far from the one that initially had in mind the company when it was founded. The idea was to share a room or a bed from the host property in order that the guest could live like a local. The host aim was be part of the community taking an extra income to help pay mortgage, home repairs or have a dream trip (Airbnb.co.uk, 2017). It is clear the misuse of the platform by more than a half of the users of this sample which might use the platform in order to hide a lodging business avoiding the payment of different taxes, increasing the profitability of each property thanks to the tax avoidance. This has been seen in the most important investigation case of Airbnb where it was demonstrated that about 70% of the transactions under the investigation were not legal considering the law in that specific year and the impact on the economy of the cities by losing the tax revenue (Varma et al., 2016).
The Figure 4 shows the rooms or accommodations supplied by Airbnb in comparison with the most prestigious hotel chains around the world, it is clear that the Airbnb supply is almost three times superior than Marriott which is another indication of the organisation growth. An increase of 10% in the Airbnb listings is related to a 0.37% reduction in the hotel room revenue, moreover, it is considered that the Hotels which suffer stronger impact are the ones with low category (Guttentag and Smith, 2017).
The traditional hotel sector has been analysed in terms of number of establishments which determines the supply, and the sales from 2014 to 2018 in different European countries. In the Figures 5 to 11 it is shown that all the countries have reduced the number of establishments with the exception of Ireland which has barely increased for these years. This could be related to the lower supply by Airbnb for this destination which it is shown in the Figure 1 that Dublin has the lowest amount of listings from the list. However, looking at the sales it is shown that all the countries have had an steady growth between 1% and 4% this might be related to the increase of occupation levels at hotels being more efficient. Hotel sales growth is related by experts to the GDP growth which is between 3% and 4% for the same period is expected that if the level of income increases, will increase thus the amount of people travelling and hotel stays (Euromonitor, 2015).
CBR Hotels report of about 59 cities in United States in 2015 indicated that the share demand of Airbnb represented almost 2% of the Hotel industry demand as it is shown in the Figure 12. Furthermore, a deeper analysis made by Stanley Morgan which considers in the study Europe and United States indicates that the demand of Airbnb was 2% for 2015 and estimating a growth of about 1% per year seen in the Figure 13. Lastly, In the World Travel Monitor forum which includes tourism experts and professionals of the sector from the world reached the conclusion that Airbnb represented 3% of the demand of the hotel industry in 2015. All this results have been obtained from different experts and considering different areas of the world, the first considering U.S, the second added Europe and the third added the rest areas of the globe ending with a similar average of the demand that Airbnb represent of the hotel industry.
REFERENCES
Airbnb.co.uk. (2016). About Us – Airbnb. [online] Available at: https://www.airbnb.co.uk/about/about-us [Accessed 15 Nov. 2016].
Airbnb.co.uk. (2017). Holiday Rentals, Homes, Experiences & Places – Airbnb. [online] Available at: https://www.airbnb.co.uk/host?from_nav=1 [Accessed 18 Apr. 2017].
Aznar, J., Sayeras, J., Rocafort, A. and Galiana, J. (2017). The irruption of AirBNB and its effects on hotels’ profitability: An analysis of Barcelona’s hotel sector. Intangible Capital, [online] 13(1), p.147. Available at: https://upcommons.upc.edu/bitstream/handle/2117/99784/921-4107-1-PB.pdf [Accessed 7 Apr. 2017].
Barnes (2017). Worldwide Industry Market report. [online] USA: C. Barnes & Co. Available at: https://drive.google.com/drive/folders/0B-j82vJb1oS-WmVIVXV3LXdLbWM [Accessed 8 Apr. 2017].
BENCKENDORFF, P., MOSCARDO, G., & PENDERGAST, D. (2010). Tourism and generation Y. Wallingford, Oxfordshire, UK, CAB International. http://dx.doi.org/10.1079/9781845936013.0000.
CBRE Hotels (2016). The Sharing Economy Checks In: An Analysis of Airbnb in the United States. [online] USA, pp.1-15. Available at: http://rss.hsyndicate.com/file/152006083.pdf [Accessed 10 Apr. 2017].
CHENG, M. (2016). Sharing economy: A review and agenda for future research. International Journal of Hospitality Management. 57, 60-70.
Chesky, B. (2014). Belong Anywhere. [online] Blog.airbnb.com. Available at: http://blog.airbnb.com/belong-anywhere/ [Accessed 3 Apr. 2017].
ERT, E., FLEISCHER, A., & MAGEN, N. (2016). Trust and reputation in the sharing economy: The role of personal photos in Airbnb. Tourism Management. 55, 62-73.
Euromonitor (2015). Casting an Eye on 2016: Expectations for the Lodging Industry in the Coming Year. [online] London. Available at: http://0-www.portal.euromonitor.com.emu.londonmet.ac.uk/portal/analysis/tab [Accessed 10 Apr. 2017].
Euromonitor international (2016). AirbnbInc in Travel (World). [online] Euromonitor, pp.1-32. Available at: http://0-www.portal.euromonitor.com.emu.londonmet.ac.uk/portal/analysis/tab [Accessed 7 Apr. 2017].
Euromonitor international (2016). The Sharing Economy in Lodging. [online] Euromonitor international, pp.1-41. Available at: http://0-www.portal.euromonitor.com.emu.londonmet.ac.uk/portal/analysis/tab [Accessed 15 Apr. 2017].
Guttentag, D. and Smith, S. (2017). Assessing Airbnb as a disruptive innovation relative to hotels: Substitution and comparative performance expectations. International Journal of Hospitality Management, [online] 64, pp.1-10. Available at: http://www.sciencedirect.com.lmu.idm.oclc.org/science/article/pii/S0278431916302250 [Accessed 12 Mar. 2017].
Inside Airbnb. (2017). Inside Airbnb. Adding data to the debate.. [online] Available at: http://insideairbnb.com/ [Accessed 22 Apr. 2017].
INTERIAN, J. (2016). Up in the Air: Harmonizing the Sharing Economy Through Airbnb Regulations. Boston College International and Comparative Law Review. Boston College Law School. http://lawdigitalcommons.bc.edu/iclr/vol39/iss1/6.
ITB Berlin (2016). ITB World travel trends report 2016/2017. [online] Berlin: IPK International, pp.1-31. Available at: http://www.itb-berlin.de/media/itb/itb_dl_all/itb_presse_all/World_Travel_Trends_Report_2016_2017.pdf [Accessed 12 Mar. 2017].
KIM S., LEE K.Y., KOO C., & YANG S. (2017). Examining the influencing factors of intention to share accommodations in online hospitality exchange networks. Journal of Travel and Tourism Marketing. 1-16.
Lasserre, P. (2012). Global strategic management. 3rd ed. Basingstoke, Hampshire: Palgrave Macmillan.
Lee, S. and Kim, D. (2017). Brand personality of Airbnb: application of user involvement and gender differences. Journal of Travel & Tourism Marketing, pp.1-14.
LESSIG, L. (2008). Remix: making art and commerce thrive in the hybrid economy. New York, Penguin Press.
Liang, L., Choi, H. and Joppe, M. (2017). Understanding repurchase intention of Airbnb consumers: perceived authenticity, electronic word-of-mouth, and price sensitivity. Journal of Travel & Tourism Marketing, pp.1-17.
Mintel, (2017). Holiday Review – UK – January 2017. [online] Available at: http://0-academic.mintel.com.emu.londonmet.ac.uk/display/792277/# [Accessed 8 Apr. 2017].
Morgan Stanley (2015). Internet, Lodging, Leisure and Hotels. [online] pp.1-54. Available at: http://linkback.morganstanley.com/web/sendlink/webapp/f/9lf3j168-3pcc-g01h-b8bf-005056013100?store=0&d=UwBSZXNlYXJjaF9NUwBiNjVjYzAyNi04NGQ2LTExZTUtYjFlMi03YzhmYTAzZWU4ZjQ%3D&user=bdvpwh9kcvqs-49&__gda__=1573813969_cf5a3761794d8651f8618fc7a544cb82 [Accessed 19 Apr. 2017].
O’Sullivan, F. (2016). The European Crackdown on Airbnb. [online] CityLab. Available at: http://www.citylab.com/housing/2016/06/european-cities-crackdown-airbnb/487169/ [Accessed 18 Apr. 2017].
Reuters. (2017). Airbnb has no plans for IPO yet – CEO Chesky. [online] Available at: http://www.reuters.com/article/airbnb-ceo-idUSL2N1GQ1M4 [Accessed 15 Mar. 2017].
Share The World’s Resources, (2012). Financing the global sharing economy: how to mobilise $2.8 trillion to prevent life-threatening deprivation, reverse austerity measures, and mitigate the human impacts of climate change.. [online] london: Share The World’s Resources, pp.14-20. Available at: http://www.sharing.org/sites/default/files/images/PDFs/Report_FinancingGlobalSharingEconomy.pdf [Accessed 3 Apr. 2017].
Slee, T. (2017). Airbnb Data Collection: Get the Data. [online] Tom Slee. Available at: http://tomslee.net/airbnb-data-collection-get-the-data [Accessed 24 Mar. 2017].
Southan, J (2016), ‘Here to stay’, Business Traveller (UK/Europe Edition), pp. 22-28, Business Source Complete, EBSCOhost, viewed 11 November 2016.
Statista (2016). Dossier Airbnb. [online] Statista, pp.1-51. Available at: https://0-www.statista.com.emu.londonmet.ac.uk/study/24578/airbnb-statista-dossier/ [Accessed 9 Apr. 2017].
Statista. (2016). Statistics and facts on Airbnb. Available: https://www.statista.com/topics/2273/airbnb/. Last accessed 11th Nov 2016.
STR, (2017). Airbnb & Hotel performance. [online] Hendersonville: STR, Inc. Available at: http://www.str.com/Media/Default/Research/STR_AirbnbHotelPerformance.pdf [Accessed 1 Apr. 2017].
Ting, D. (2017). Airbnb Is Becoming an Even Bigger Threat to Hotels Says a New Report. [online] Skift. Available at: https://skift.com/2017/01/04/airbnb-is-becoming-an-even-bigger-threat-to-hotels-says-a-new-report/ [Accessed 16 Apr. 2017].
Turulja, L. and Bajgoric, N. (2016). Innovation and Information Technology Capability as Antecedents of Firms’ Success. Interdisciplinary Description of Complex Systems, 14(2), pp.148-156.
Varma, A., Jukic, N., Pestek, A., Shultz, C. and Nestorov, S. (2016). Airbnb: Exciting innovation or passing fad?. Tourism Management Perspectives, 20, pp.228-237.
1 Millennials By Petra Glover
2 Millennials By Petra Glover
3 Getting to Know the Y Generation Donna Pendergast Griffith University, Gold Coast, Australia
Cite This Work
To export a reference to this article please select a referencing stye below:
Related Services
View all


Related Content
All TagsContent relating to: "Business Analysis"
Business Analysis is a research discipline that looks to identify business needs and recommend solutions to problems within a business. Providing solutions to identified problems enables change management and may include changes to things such as systems, process, organisational structure etc.
Related Articles

DMCA / Removal Request
If you are the original writer of this dissertation and no longer wish to have your work published on the UKDiss.com website then please: