Aggregate Selection for Concrete
Info: 11948 words (48 pages) Dissertation
Published: 13th Dec 2019
Tagged: Building Materials
ABSTRACT
Globally issues of environment and climate change are major problems. In 21st Century construction industry is at its peak (including dismantling concrete structures). It is the only time when governments, businesses and consumers have to rethink about traditional practices, products and policies in this direction. Now a day sustainable development is in demand. Sustainable development I is possible by revising, rethinking, reducing, reuse. In construction scope of reuse of material is so vast. The use of waste materials (glass, plastic, slag, fly ash and so on) in concrete industrial is major due to its engineering, economic, eco-friendly and green paybacks. Thus, consumption of waste materials in concrete construction is very much useful to obtain the objective of the sustainability. This study is based on the performance of three different concrete mixes having different ratios of crushed, waste tiles having 20 mm maximum size as coarse aggregate. Coarse sand, ordinary Portland Cement 53 grade were used for standard concrete cubes. Test results shows that except Mix 30 mix there is no major effect on compressive strength of concrete in Mix 20 and Mix 25 mixes up to 20% replacement of normal 20 mm coarse aggregates with tile aggregates. But beyond that, strength started declining slowly with rising the amount of tile aggregates in concrete.
CHAPTER- 1
Introduction
1.1 GENERAL
In this era concrete production is at peak and large amount of cementitious material, natural aggregates (fine and course) and water are being used. Aggregates impart about 70% to 75% of volume to concrete. In parallel to this many research works are under progress to find suitable alternatives of raw materials of concrete. Utilization of waste materials for example fly ash, plastic waste, construction waste are most common research areas. Tile waste is also a best sustainable alternative for course aggregates in concrete. Construction industry is producing huge amount of tile waste worldwide in small, medium and large projects. This broken tile wastes are deposited into environment as liability without any profitable return. Plenty of money is being spent for its deposition and even land become useless in most of the cases.
So it is better to reuse this waste material in concrete as supplementary. Ceramic tile aggregates are hard having significant value of specific gravity, rough surface on one side and smooth on other side, are lighter in weight than normal aggregates. Consuming ceramic tile aggregate in concrete not only will be cost effective, but also will be good from environment point of view.
This study focuses on preparing concrete of acceptable strength with crushed waste ceramic tile as aggregates (course) and finding the optimum course aggregate mix ratio to get this strength.
1.2 OBJECTIVE
Concrete consumption is two times more than any other building material around the world. So it is important to find sustainable alternatives of its raw materials. Because over consumption of traditional natural raw material is misbalancing environment.
Main objectives of this study are:
- To find alternative of traditional course aggregates in order to achieve sustainable progress.
- To minimize the construction waste
- To develop more economical concrete material.
1.3 MATERIAL SOURCE
- Tile industry- India is 3rd largest tile production country
- Construction Projects- Nearly 10% of tiles are waste in large construction projects which can be used as course aggregates
- Tile distributers- Large amount of tiles get broken during transportation in wholesale that is also contribution in overall construction waste and can be reuse.
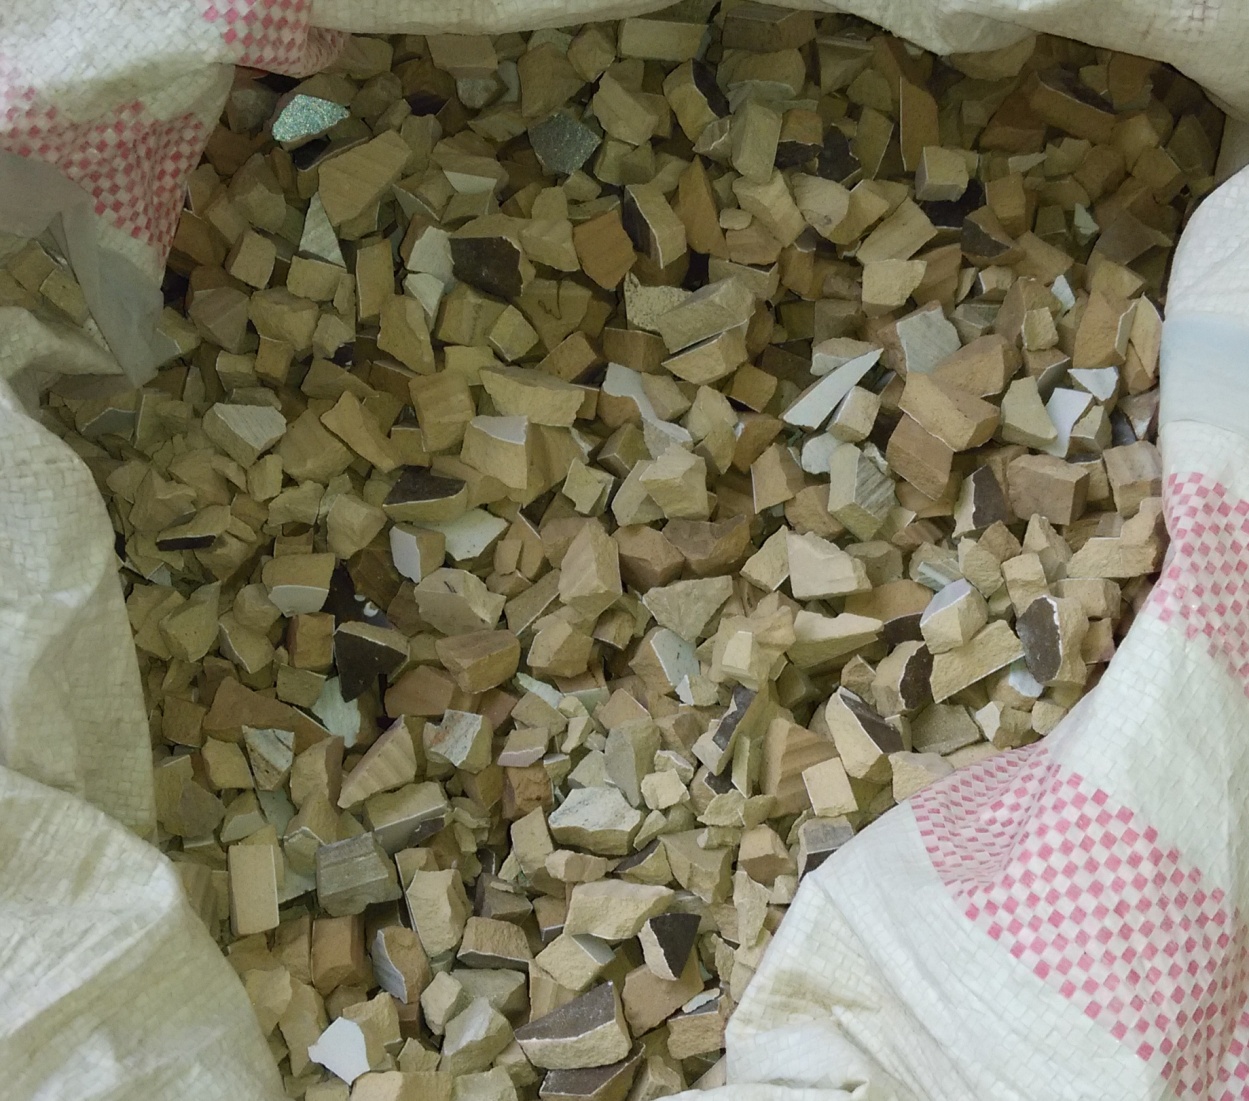
FIGURE 1.1 CERAMIC TILE AGGREGATES
1.4 SCOPE OF INVESTIGATION
As per IS 383:1770 flaky shape material is not permitted in concrete mix. Even other general specifications are not permitting to use low quality materials in construction. Tile waste is a flaky material but it is passing other quality criteria. To overcome problem of flakiness this waste material can be used as partial replacement.
Even in IS 456:2000 fly ash, slag type waste material is permitted to use without compromising the quality of the work. Along with these waste materials waste from steel industry, crushed over-burnt bricks and tiles – waste from clay brick and tile industry, in plain cement concrete as an alternative to sand/natural aggregate, subject to fulfilling the requirements of the Code.
Many experimental studies concerning tile aggregates can be helpful for this initiative of BIS to promote the suitable tile waste usage in concrete and made a provision in concrete code and national building codes of nation.
To encourage the use of tile aggregates in the Indian construction sector, it is required to make these specifications more liberal otherwise the use of tile aggregates in stable works other than reclamation and earth filling is almost difficult.
1.5 METHODOLOGY
M 20, M 25 & M 30, three different concrete mix design chosen to carry out the investigate the effect of tile waste as partial aggregate replacement.
Below mentioned preparation will be made to caste samples
Table 1.1 Specimen Details
| Total number of concrete mix designs will be prepared | 3 |
| Number of proportions in which tile aggregates will be replaced with normal aggregates in each design (i.e. 0%, 5%, 10% & 20%) | 4 |
| Therefore, total concrete batches will be prepared | 12 |
| Number of concrete batches will be prepared in a day | 1 |
| Number of cubes will be filled in each batch | 6 |
| Number of cubes will be casted for each mix design
For M 20 – 24 cubes For M 25 – 24 cubes For M 30 – 24 cubes |
24 |
| Total number of cubes will be casted including all 3 concrete mix designs | 24+24+24=72 |
| Size of Specimen | 150×150×150 mm cube |
| Name of Test | Compression Strength Test |
CHAPTER – 2
Literature Review
2.1 REVIEW
Kumar (2015)
In this study, different mixes are adopted, waste tiles are used to replace the coarse aggregate by 10% and 20% and tiles powder are also used to replace the fine aggregates by 10% and 20%. Total 9 types of mixes of M25 grade are adopted. A study on workability and compressive strength for 7 and 28 days of all 9 types of mixes has been succeed and recorded that with rise the percentage of tiles powder the strength and workability also increased of concrete. Compressive strength is increased for all mixes and maximum compressive strength is obtained the mix having 10% of crushed tiles and 20% of tiles powder. The best percentage of coarse aggregate that can be replaced by crushed tiles with 10%.
Alves (2014)
In this study reused ceramic fine aggregates, obtain00ed from crushed sanitary and crushed bricks ware on the mechanical properties such as compressive, modulus of elasticity, splitting tensile strength, and abrasion resistance of concrete. Seven concrete mixes were used to test these tough properties and six concrete mixes with replacement ratios of the 20%, 50% and 100% of natural fine aggregates by fine recycled brick aggregates or fine recycled sanitary ware aggregates. Compressive and splitting tensile strength do not appear to be affected by fine brick aggregates and these properties significantly reduced with the fusion of recycled fine sanitary ware aggregates.
Medina (2012)
Medina deliberate on consumption of ceramic waste as recycled coarse aggregate. Crushed sanitary ware was used in it and its shape curve of recycled ceramic aggregate was similar to the natural coarse aggregate. Uneven shape of aggregate was offered in the ceramic waste, resulted that superior surface area and improved bonding was observed in investigation.
Sekar (2011)
In this study different industrial waste such as glass waste aggregates, ceramic tile waste aggregates, ceramic insulator waste aggregate with 100% replacement was studied. It was found that the concrete made with ceramic tile waste gives similar strength (split tensile, Compression, flexural) as conventional concrete. On the other hand, concrete with ceramic insulator and glass waste give lesser strength than traditional concrete.
Pacheco (2010)
In this study it was concluded that concrete with ceramic waste residue has a minor strength loss have risen durability production because of its pozzolanic belongings. As for replacement of coarse aggregate with ceramic coarse aggregate, the outcomes are better but underachieved somewhat in water absorption and in the water permeability meaning that the replacement of sand by the ceramic sand is a superior choice.
Veera Reddy (2010)
Veera Reddy reported on impact value and crushing value of ceramic scrap as 18.2 and 24.7% respectively. These values were within the permissible limits according to IS 383-1970, hence it was safe to use as a coarse aggregate in concrete composition.
Paulo Cachim (2009)
Paulo Cachim studied on usage of ceramic aggregate, collected from ceramic industrial waste. Water absorption of waste from two different sources was 15.81 and 18.91% respectively. The higher water absorption of ceramic aggregates influenced the workability of concrete. It was observed that in first 2 minutes, 75% of total absorption observed and after 5 min at least 91% of total absorption occurred.
Mashitah (2008)
In this study it was concluded on recycling of similar ceramic tiles used in the preparation of concrete cubes. The surface of ceramic tile aggregate was found as angular shaped and smooth, sharpen edges as compared with traditional coarse aggregate. Flatter particles consumed extra amount of cement paste to make better inter facial transition zone.
Senthamarai (2005)
Senthamarai observed that ceramic tile scrap can be successfully used as aggregates in concrete production, on the basis of strength of ceramic waste aggregate. The abrasion values, crushing value, impact value for ceramic scrap were 28, 21 and 21% correspondingly and for natural coarse aggregate 20, 17 and 24% respectively. Ceramic waste does not have much difference with respect to the traditional natural aggregates.
Marcio (2004)
Marcio experimented on compressed stress, water absorption and modulus of elasticity of concrete made with ceramic aggregate. Crushed ceramic blocks were used as coarse aggregate in concrete fabrication. Specific density of aggregate was 2630 to 2310 kg/m3 for 0 to 100% replacement. Up to the replacement of 20%, Compression resistance and modulus of elasticity was equivalent with conventional concrete.
Chapter – 3
Aggregate Selection for Concrete
3.1 THE ROLE OF THE AGGREGATE IN CONCRETE
The protection of the environment concerns three basic things:
- Raw material (aggregates for the production of concrete) which result in the reduction of existing natural resources which is endlessly sub-graded.
- For the production and transportation of aggregates high amounts of energy has to be consumed
- Waste due to demolition.
The cementing material has two core functions –
- To impart strength to hardened concrete.
- To fill voids between aggregate particles providing lubrication of the fresh (plastic) concrete and water tightness.
The aggregate in concrete has three main purposes –
- To provide a bulk of particles which are fit for resisting the stroke of applied loads, abrasion the filtration of moisture weathering affects.
- To provide a comparatively economical filler for the cementing material.
- To minimize the volume changes resulting from the setting and hardening development and from moisture variation in the cement paste.
In concrete there are 70 to 80 % aggregate and exert an influence on concrete properties. They are granular material from natural rock, gravels. However, one of the fact that has made concrete, the world’s most widely used construction material is its ability to absorb a wide range of quality of materials, including recycled and industrial by products, as a component of the aggregate. In selecting aggregate for use in concrete certain constituents should be avoided. For example, reactive silica leads to deterioration of concrete if moisture and alkali are present; weak friable aggregate should not be used if hardness is desired concrete property; and a highly porous aggregate is potentially unsuitable with respect to aggressive permeation – based deterioration processes. Some of these properties are directly dependent upon the parent rock whilst others are not. For example, those dependent on parent rock are chemical and mineralogical descriptions, petro graphic description, specific gravity, strength, hardness, and color, while surface texture, size and shape are independent of parent rock. The simplest and most common method for characterization of aggregate is on the basis of the specific gravity, i. e.
(i) Normal weight
(ii) Light weight and
(iii) Heavy weight.
Further characterization may be achieved using the following: grading, shape, inclusion, bulk density, water absorption, chemical composition and drying shrinkage.
3.2 SELECTION OF AGGREGATES
Aggregates directly affect the properties of concrete. In plastic stage, water requirement, cohesiveness and workability of the concrete, in hardened stage they effect density, strength, durability, surface finish permeability, and colour. Aggregates are generally classified into two categories viz. natural and manufactured/processed.
- FACTORS INFLUENCING CONCRETE
Chemical Stability
Specific gravity
Shape
Maximum size
Gradation / Particle size distribution
Surface texture
CHAPTER – 4
Material and Concrete Mix- Design
4.1 SIEVE ANALYSIS –
COARSE AGGREGATES
Crushed Tile Aggregates
Test – 1
Total weight of sample = 3980 g
TABLE 4.1 – SIEVE ANALYSIS (CRISHED TILE AGGREGATES)
| IS sieve
sizes (mm) |
Weight Retained
(grams) |
Weight Retained % | Accumulative
% |
Passing
% |
Limits Required |
| 40 | 0 | 0 | 0 | 100 | 100 |
| 20 | 10 | 0.25 | 0.25 | 99.75 | 95-100 |
| 10 | 2935 | 73.74 | 73.99 | 26.01 | 25-55 |
| 4.75 | 960 | 24.12 | 98.11 | 1.89 | 0-10 |
| Pan | 90 | ||||
Result – Tile aggregates satisfy the rage of 20mm nominal size aggregates as per IS:383-1970.
Normal Aggregates
Test – 2
For 20 mm Aggregates
Total weight of sample – 3480 g
TABLE 4.2 – SIEVE ANALYSIS (NORMAL 20mm AGGREGATES)
| IS sieve
sizes (mm) |
Weight Retained
(grams) |
Weight Retained % | Accumulative
% |
Passing
% |
Limits Required |
| 40 | 0 | 0 | 0 | 100 | 100 |
| 20 | 305 | 8.76 | 8.76 | 91.24 | 85-100 |
| 10 | 3165 | 90.94 | 99.70 | 0.3 | 0-20 |
| 4.75 | 10 | 0.28 | 99.98 | 0.02 | 0-5 |
Result – Satisfy the range of 20 mm nominal size aggregates as per IS: 383-1970.
Test – 3
For 10 mm Aggregates
Total weight of sample – 2100 g
TABLE 4.3 – SIEVE ANALYSIS (NORMAL 10mm AGGREGATES)
| IS sieve
sizes (mm) |
Weight Retained
(grams) |
Weight Retained % | Accumulative
% |
Passing
% |
Limits Required |
| 12.5 | 0 | 0 | 0 | 100 | 100 |
| 10 | 305 | 14.52 | 14.52 | 85.48 | 85-100 |
| 4.75 | 1760 | 83.80 | 98.32 | 1.67 | 0-20 |
| Pan | 35 | ||||
Result – Satisfy the 10 mm nominal size aggregates as per IS: 383 – 1970.
Test – 4
Total weight of sample – 3000 g
Proportion of 20 mm aggregates – 40% = 1200 g
Proportion of 10mm aggregates – 60% = 1800 g
TABLE 4.4 – SIEVE ANALYSIS (40-60 PROPORTION AGGREGATES)
| IS sieve
sizes (mm) |
Weight Retained
(grams) |
Weight Retained % | Accumulative
% |
Passing
% |
Limits Required |
| 40 | 0 | 0 | 0 | 100 | 100 |
| 20 | 130 | 4.33 | 4.33 | 95.67 | 95-100 |
| 10 | 2250 | 75 | 79.33 | 20.67 | 22-55 |
| 4.75 | 605 | 20.16 | 99.49 | 0.59 | 0-10 |
| Pan | 0.59 |
Result – Sample is in limits as per IS: 383 – 1970
FINE AGGREGATES
Test – 1
Total weight of sample – 2300 g
TABLE 4.5 – SIEVE ANALYSIS (FINE AGGREGATES)
| IS sieves
sizes (mm) |
Weight Retained
(grams) |
Weight Retained % | Accumulative
% |
Passing
% |
Limits Required |
| 10 | 0 | 0 | 0 | 100 | 100 |
| 4.75 | 50 | 2.17 | 2.17 | 97.83 | 90-100 |
| 2.36 | 140 | 6.08 | 8.25 | 91.75 | 75-100 |
| 1.18 | 480 | 20.86 | 29.11 | 70.89 | 55-90 |
| 300µ | 1195 | 51.95 | 81.06 | 18.94 | 8-30 |
| 150µ | 360 | 15.65 | 96.31 | 3.29 | 0-10 |
| Pan | 70 |
Result – This sample satisfy the fine aggregate limits of Grading Zone 2 as per IS: 383-1970.
Fineness Modulus = Total of all Accumulative % / 100 = 2.173 %
TABLE 4.6 – TEST RESULT
| Sr. No. | Test | Results |
| 1 | Specific Gravity Of Cement | 2.74 |
| 2 | Specific gravity of Coarse Aggregates | 2.69 |
| 3 | Specific gravity of Fine Aggregates | 2.70 |
| 4 | Fineness Modulus of Fine Aggregates | 2.17 |
| 5 | Specific Gravity of Tile Aggregates | 2.24 |
| 6 | Water Absorption of Tile Aggregates | 14.4% |
| 7 | Impact Value of Tile Aggregates | 20% |
TABLE 4.7 – COMPARISON (PROPERTIES OF TILE AGGREGATES AND NORMAL AGGREGATES)
| Sr. No. | Properties | Normal aggregate | Tile aggregate |
| 1 | Shape | Angular | Flaky |
| 2 | Texture | Rough | All sides rough except top |
| 3 | Water absorption | 0.5% | 14.4% |
| 4 | Impact value | 15% | 20% |
| 5 | Specific gravity | 2.69 | 2.24 |
4.2 COMPRESSION TEST SPECIMENS (MAKING AND CURING)
PREPRATION OF MATERIALS
27° ± 3°C temperature is preferable for all material in concrete. After thorough mixing of cement by machine or manual, it should be stored in air tight container in laboratory.
Sample of aggregate should be in air dried conditions
MIXING CONCRETE
Mixing of concrete should be mixed in machine. Batch of concrete shall be of such a size as to extra about 10 percent after molding the chosen number of test specimens.
WORKABILITY
According to IS : 1199-1959 consistency of each batch of concrete immediately after mixing. Care should be taken that there is no water loss during the test
SIZE OF TEST SPECIMENS
Cube Moulds
The mould shall be of 150 mm size conforming to IS : 10086-1982.
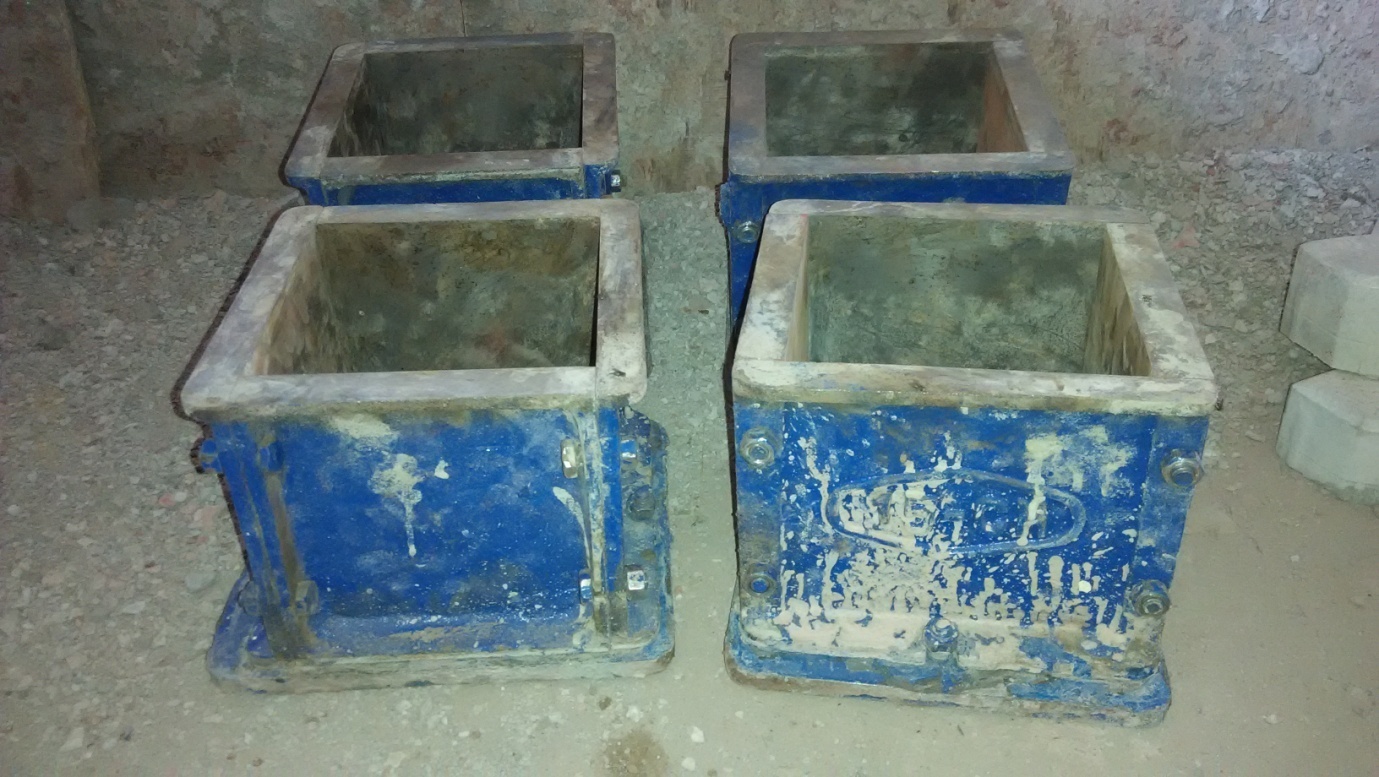
FIGURE 4.1 CUBE MOULDS
Tamping Bar — The tamping bar shall conform to 6.1(a) of IS: 10086-1982*.
COMPACTING
Each specimen need proper compaction. Care should be taken that there is no chance of bleeding and segregation. Filling of concrete in cube mould should be in layers by compacting each layer properly.
Compaction by Vibration – After filling the mould, each specimen shall be vibrated by means of an electric or pneumatic hammer or vibrator or by means of a suitable vibrating table until the specified condition is attained.
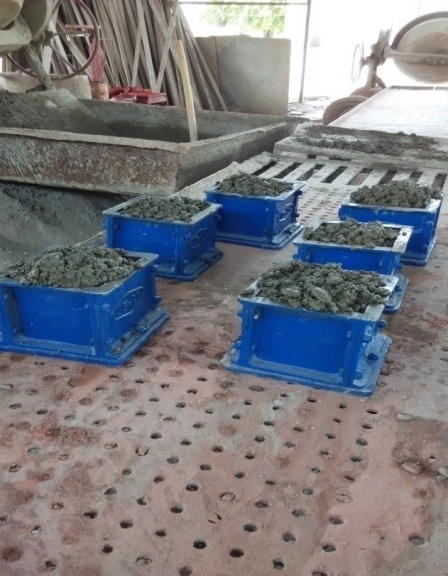
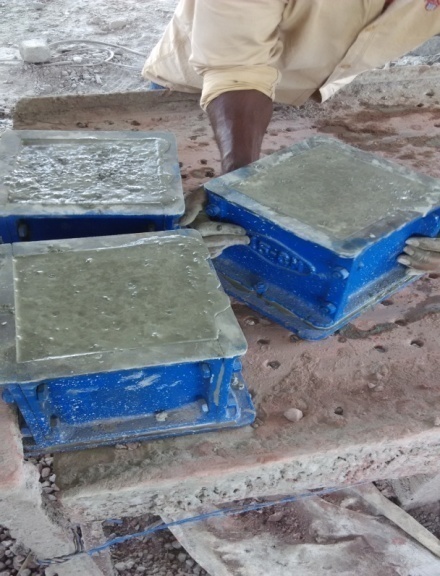
FIGURE 4.2 – COMPACTION BY VIBRATOR
CURING
Proper curing is very much important for concrete. It directly influenced hard properties of concrete. 22° to 32°C temperature is most suitable for storage of water. Water that is suitable for drinking is satisfactory for use in concrete (mixing and curing)
4.3 TEST FOR COMPRESSIVE STRENGTH OF CONCRETE SPECIMEN
After taken out form the curing tank at the age of 28 days cube specimens of size 150mm x 150mm x 150mm tested exactly after remove from the water . Surface was free from water, the specimen were tested. The position of the cube is right angle when tested.
The compressive strength is obtained by the formula as given below.
Compressive strength of specimen=Load at which specimen fail/Cross sectional area of specimen
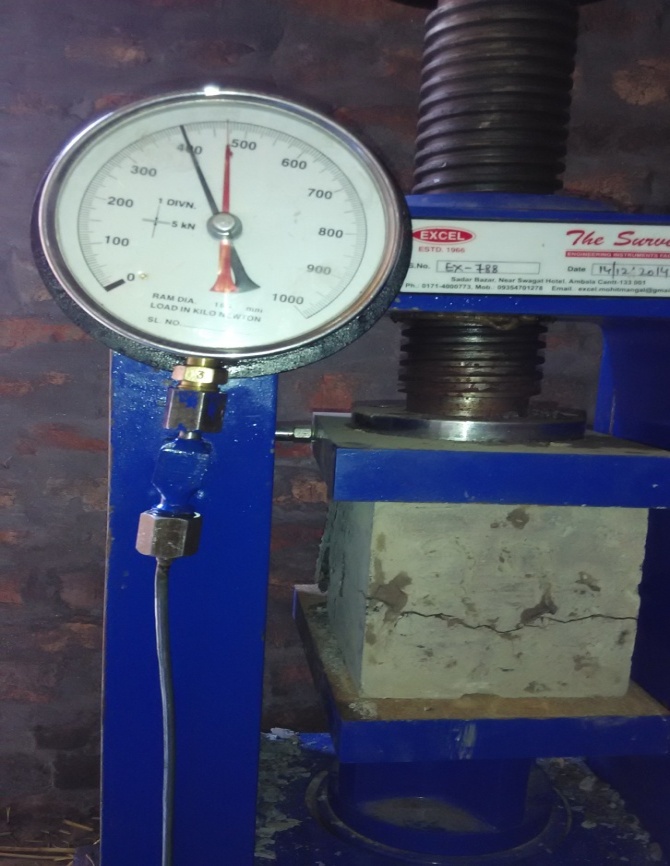
FIGURE 4.3 COMPRESSION TESTING MACHINE
4.4 CONCRETE MIX DESIGN
MIX PROPORTIONING FOR M 20 GRADE CONCRETE
STIPULATIONS FOR PROPORTIONING
- Grade Designation – M 20
- Type of Cement – OPC 53 Grade
- Admixture (if added) – Nil
- Maximum nominal size of aggregates – 20 mm
- Minimum cement content – 300 kg/m3
- Maximum water – cement ratio – 0.55
- Workability – 25 to 50 mm (slump)
- Exposure condition – Mild
- Degree of supervision – Good
TEST DATA FOR MATERIALS
- Cement used – OPC 53 Grade
- Initial setting time – 60 minutes
- Final time – 4 hours
- Consistency – 37%
- Specific gravity of cement – 2.74
- Chemical admixture – Nil
- Specific gravity of:
- Coarse aggregates – 2.69
- Fine aggregates – 2.70
- Water absorption:
- Coarse aggregates – 0.5%
- Fine aggregates – 1%
- Sieve analysis:
- Coarse aggregates – Confirming to
Table 2 of IS 383
- Fine aggregates – Confirming to grading
Zone 2 of Table 4 of IS 383
TARGET STRENGTH
fʹck = fck + 1.65 S
f′ck – Target Mean Strength
fck – Characteristics Strength
S – Standard Deviation
f′ck = 20+1.65 (4) = 26.6
S = 4 (assumed from Table 1 IS 10262: 2009)
SELECTION OF WATER – CEMENT RATIO
Water Cement Ratio – 0.55 (maximum)
Adopted water – cement ratio = 0.55
Minimum Cement Content – 300 kg/m3
From Table 5 IS 456:2000 for mild exposure.
- Water Content – 186 kg (maximum)
From Table 2 IS 10262:2009 for 20mm aggregates.
(For slump range 25mm to 50mm)
- Calculation of Cement Content –
Cement content = 186/0.55 = 338.18 kg/m3
Here 0.55 is water cement ratio
338.18>300 kg/m3,
Hence OK.
- Volume of Coarse Aggregates per unit volume of total aggregates for different zones of Fine Aggregates – 0.62
(For 20 mm nominal maximum size of aggregates from Table 3 Zone 2 IS 10262:2009)
- Volume of Fine Aggregates in total = 1 – 0.62 = 0.38
Mix proportion for M 20 (with 0% tile aggregates)
Cement – 338.18 kg
Water – 186 kg
Fine aggregates – 708.96 kg
Coarse aggregates – 1152.44 kg
Water cement ratio – 0.55
RATIO
| Cement | Fine Aggregates | Coarse Aggregates | Water cement
Ratio |
| 1 | 2.09 | 3.40 | 0.55 |
Mix proportion for M 20
(5% replacement of normal aggregates with tile aggregates)
Coarse aggregates – 1152.44 kg
(i.e. Total, including 20 mm & 10 mm aggregates)
Now,
Volume of 10 mm aggregates taken in concrete = 60%
Volume of 20 mm aggregates taken in concrete = 40%
40% of 1152.44 = 460.97 kg (20 mm aggregates)
5% of 460.97 = 23.048 kg (Tile aggregates)
Therefore,
- Cement – 338.18 kg
- Water – 186 kg
- Fine aggregates – 708.96 kg
- Coarse aggregates –
- Tile aggregates = 23.048 kg
- 10 mm aggregates = 691.47 kg
- 20 mm aggregates = 460.97 – 23.048
= 437.92 kg
Mix proportion for M 20
(10% replacement of normal aggregates with tile aggregates)
Coarse aggregates – 1152.44 kg
(i.e. Total, including 20 mm & 10 mm aggregates)
Now,
Volume of 10 mm aggregates taken in concrete = 60%
Volume of 20 mm aggregates taken in concrete = 40%
40% of 1152.44 = 460.97 kg (20 mm aggregates)
10% of 460.97 = 46.09 kg (Tile aggregates)
Therefore,
- Cement – 338.18 kg
- Water – 186 kg
- Fine aggregates – 708.96 kg
- Coarse aggregates –
- Tile aggregates = 46.09 kg
- 10 mm aggregates = 691.47 kg
- 20 mm aggregates = 460.97 – 46.09
= 414.88 kg
Mix proportion for M 20
(20% replacement of normal aggregates with tile aggregates)
Coarse aggregates – 1152.44 kg
(i.e. Total, including 20 mm & 10 mm aggregates)
Now,
Volume of 10 mm aggregates taken in concrete = 60%
Volume of 20 mm aggregates taken in concrete = 40%
40% of 1152.44 = 460.97 kg (20 mm aggregates)
20% of 460.97 = 92.19 kg (Tile aggregates)
Therefore,
- Cement – 338.18 kg
- Water – 186 kg
- Fine aggregates – 708.96 kg
- Coarse aggregates –
- Tile aggregates = 92.19 kg
- 10 mm aggregates = 691.47 kg
- 20 mm aggregates = 460.97 – 92.19
= 368.78 kg
MIX PROPORTIONING FOR M 25 GRADE CONCRETE
STIPULATIONS FOR PROPORTIONING
- Grade Designation – M 25
- Type of Cement – OPC 53 Grade
- Admixture (if added) – Nil
- Maximum nominal size of aggregates – 20 mm
- Minimum cement content – 300 kg/m3
- Maximum water – cement ratio – 0.50
- Workability – 25 to 50 mm (slump)
- Exposure condition – Moderate
- Degree of supervision – Good
TEST DATA FOR MATERIALS
- Cement used – OPC 53 Grade
- Initial setting time – 60 minutes
- Final setting time – 4 hours
- Consistency – 37 %
- Specific gravity of cement – 2.74
- Chemical admixture – Nil
- Specific gravity of:
- Coarse aggregates – 2.69
- Fine aggregates – 2.70
- Water absorption:
- Coarse aggregates – 0.5%
- Fine aggregates – 1%
- Sieve analysis:
- Coarse aggregates – Confirming to
Table 2 of IS 383
- Fine aggregates – Confirming to grading
Zone 2 of Table 4 of IS 383
TARGET STRENGTH
fʹck = fck + 1.65 S
f′ck – Target Mean Strength
fck – Characteristics Strength
S – Standard Deviation
f′ck = 25+1.65 (4) = 31.6
S = 4 (assumed from Table 1 IS 10262: 2009)
SELECTION OF WATER CEMENT RATIO
Water Cement Ratio – 0.50 (maximum)
Adopter water – cement ratio = 0.50
Minimum Cement Content – 300 kg/m3
From Table 5 IS 456:2000 for mild exposure.
Water Content – 186 kg (maximum)
From Table 2 IS 10262:2009 for 20mm aggregates.
(For slump range 25mm to 50mm)
Calculation of Cement Content –
Cement content = 186/0.50 = 372 kg/m3
Here 0.50 is water cement ratio
372 > 300 kg/m3, hence OK.
Volume of Coarse Aggregates per unit volume of total aggregates for different zones of Fine Aggregates – 0.62
For 20 mm nominal maximum size of aggregates from Table 3 Zone 2 IS 10262:2009
Volume of Fine Aggregates in total = 1 – 0.62 = 0.38
Mix proportions for M 25
Cement – 372 kg
Water – 186 kg
Fine aggregates – 696.65 kg
Coarse aggregates – 1132.43 kg
Water cement ratio – 0.50
RATIO
| Cement | Fine Aggregates | Coarse Aggregates | Water |
| 1 | 1.87 | 3.04 | 0.50 |
Mix proportion for M 25
(5% replacement of normal aggregates with tile aggregates)
Coarse aggregates – 1132.43 kg
(i.e. Total, including 20 mm & 10 mm aggregates)
Now,
Volume of 10 mm aggregates taken in concrete = 60%
Volume of 20 mm aggregates taken in concrete = 40%
40% of 1132.43 = 452.97 kg (20 mm aggregates)
5% of 452.97 = 22.64 kg (Tile aggregates)
Therefore,
- Cement – 372 kg
- Water – 186 kg
- Fine aggregates – 708.96 kg
- Coarse aggregates –
- Tile aggregates = 22.64 kg
- 10 mm aggregates = 679.46kg
- 20 mm aggregates = 452.97 – 22.64
= 430.33 kg
Mix proportion for M 25
(10% replacement of normal aggregates with tile aggregates)
Coarse aggregates – 1132.43 kg
(i.e. Total, including 20 mm & 10 mm aggregates)
Now,
Volume of 10 mm aggregates taken in concrete = 60%
Volume of 20 mm aggregates taken in concrete = 40%
40% of 1132.43 = 452.97 kg (20 mm aggregates)
10% of 452.97 = 45.29 kg (Tile aggregates)
Therefore,
- Cement – 372 kg
- Water – 186 kg
- Fine aggregates – 708.96 kg
- Coarse aggregates –
- Tile aggregates = 45.29 kg
- 10 mm aggregates = 696.65 kg
- 20 mm aggregates = 452.97 – 45.29
= 407.68 kg
Mix proportion for M 25
(20% replacement of normal aggregates with tile aggregates)
Coarse aggregates – 1132.43 kg
(i.e. Total, including 20 mm & 10 mm aggregates)
Now,
Volume of 10 mm aggregates taken in concrete = 60%
Volume of 20 mm aggregates taken in concrete = 40%
40% of 1132.43 = 452.97 kg (20 mm aggregates)
20% of 452.97 = 90.59 kg (Tile aggregates)
Therefore,
- Cement – 372 kg
- Water – 186 kg
- Fine aggregates – 708.96 kg
- Coarse aggregates –
- Tile aggregates = 90.59 kg
- 10 mm aggregates = 696.65 kg
- 20 mm aggregates = 452.97 – 90.59
= 362.38 kg
MIX PROPORTIONING FOR M 30 GRADE CONCRETE
STIPULATIONS FOR PROPORTIONING
- Grade Designation – M 30
- Type of Cement – OPC 53 Grade
- Initial setting time – 60 minutes
- Final setting time – 4 hours
- Consistency – 37%
- Admixture (if added) – Nil
- Maximum nominal size of aggregates – 20 mm
- Minimum cement content – 320 kg/m3
- Maximum water – cement ratio – 0.45
- Workability – 25 to 50 mm (slump)
- Exposure condition – Severe
- Degree of supervision – Good
TEST DATA FOR MATERIALS
- Cement used – OPC 53 Grade
- Specific gravity of cement – 2.74
- Chemical admixture – Nil
- Specific gravity of:
- Coarse aggregates – 2.69
- Fine aggregates – 2.70
- Water absorption:
- Coarse aggregates – 0.5%
- Fine aggregates – 1%
- Sieve analysis:
- Coarse aggregates – Confirming to
Table 2 of IS 383
- Fine aggregates – Confirming to grading
Zone 2 of Table 4 of IS 383
TARGET STRENGTH
fʹck = fck + 1.65 S
f′ck – Target Mean Strength
fck – Characteristics Strength
S – Standard Deviation
f′ck = 30+1.65 (5) = 38.25
S = 4 (assumed from Table 1 IS 10262: 2009)
Water Cement Ratio – 0.45 (maximum)
Adopted water – cement ratio = 0.45
Minimum Cement Content – 320 kg/m3
From Table 5 IS 456:2000 for mild exposure.
Water Content – 186 kg (maximum)
From Table 2 IS 10262:2009 for 20mm aggregates.
(For slump range 25mm to 50mm)
Calculation of Cement Content –
Cement content = 186/0.45 = 413.33 kg/m3
Here 0.45 is water cement ratio
413.33 > 320 kg/m3, hence OK.
Volume of Coarse Aggregates per unit volume of total aggregates for different zones of Fine Aggregates – 0.62
For 20 mm nominal maximum size of aggregates from Table 3 Zone 2 IS 10262:2009
Volume of Fine Aggregates in total = 1 – 0.62 = 0.38
Mix proportions for M 30
Cement – 413.33 kg
Water – 186 kg
Fine aggregates – 681.26 kg
Coarse aggregates – 1107.41 kg
Water cement ratio – 0.45
RATIO
| Cement | Fine Aggregates | Coarse Aggregates | Water |
| 1 | 1.64 | 2.67 | 0.45 |
Mix proportion for M 30
(5% replacement of normal aggregates with tile aggregates)
Coarse aggregates – 1107.41 kg
(i.e. Total, including 20 mm & 10 mm aggregates)
Now,
Volume of 10 mm aggregates taken in concrete = 60%
Volume of 20 mm aggregates taken in concrete = 40%
40% of 1107.41 = 442.96 kg (20 mm aggregates)
5% of 442.96 = 22.14 kg (Tile aggregates)
Therefore,
- Cement – 413.33 kg
- Water – 186 kg
- Fine aggregates – 681.26 kg
- Coarse aggregates –
- Tile aggregates = 22.14 kg
- 10 mm aggregates = 664.45 kg
- 20 mm aggregates = 442.96 – 22.14
= 420.82 kg
Mix proportion for M 30
(10% replacement of normal aggregates with tile aggregates)
Coarse aggregates – 1107.41 kg
(i.e. Total, including 20 mm & 10 mm aggregates)
Volume of 10 mm aggregates taken in concrete = 60%
Volume of 20 mm aggregates taken in concrete = 40%
40% of 1107.41 = 442.96 kg (20 mm aggregates)
10% of 442.96 = 44.29 kg (Tile aggregates)
Therefore,
- Cement – 413.33 kg
- Water – 186 kg
- Fine aggregates – 681.26 kg
- Coarse aggregates –
- Tile aggregates = 44.29 kg
- 10 mm aggregates = 681.26 kg
- 20 mm aggregates = 442.96 – 44.29
= 398.63 kg
Mix proportion for M 30
(20% replacement of normal aggregates with tile aggregates)
Coarse aggregates – 1107.41 kg
(i.e. Total, including 20 mm & 10 mm aggregates)
Now,
Volume of 10 mm aggregates taken in concrete = 60%
Volume of 20 mm aggregates taken in concrete = 40%
40% of 1107.41 = 442.96 kg (20 mm aggregates)
20% of 442.96 = 88.59 kg (Tile aggregates)
Therefore,
- Cement – 413.33 kg
- Water – 186 kg
- Fine aggregates – 681.26 kg
- Coarse aggregates –
- Tile aggregates = 88.59 kg
- 10 mm aggregates = 681.26 kg
- 20 mm aggregates = 442.96 – 88.59
= 354.37 kg
CHAPTER – 5
Discussion of Results
Results of Compressive strength (M20)
TABLE 5.1
(0% replacement of coarse aggregates with tile aggregates)
| Cube No. | No. of days | Load applied (KN) | Compressive strength (N/mm2) | Average strength
(N/ mm2) |
| 1 | 7 | 500 | 22.22 | 21.25 |
| 2 | 7 | 475 | 21.11 | |
| 3 | 7 | 460 | 20.44 | |
| 4 | 28 | 665 | 29.55 | 29.03 |
| 5 | 28 | 650 | 28.88 | |
| 6 | 28 | 645 | 28.66 |
TABLE 5.2
(5% replacement of coarse aggregates with tile aggregates)
| Cube No. | No. of days | Load applied (KN) | Compressive strength (N/mm2) | Average strength
(N/mm2) |
| 1 | 7 | 475 | 21.11 | 20.44 |
| 2 | 7 | 445 | 19.77 | |
| 3 | 7 | 460 | 20.44 | |
| 4 | 28 | 615 | 27.33 | 28.21 |
| 5 | 28 | 690 | 30.66 | |
| 6 | 28 | 600 | 26.66 |
TABLE 5.3
10% replacement of coarse aggregates with tile aggregates
| Cube No. | No. of days | Load applied (KN) | Compressive strength (N/mm2) | Average strength
(N/mm2) |
| 1 | 7 | 410 | 18.22 | 19.55 |
| 2 | 7 | 475 | 21.11 | |
| 3 | 7 | 435 | 19.33 | |
| 4 | 28 | 585 | 26.00 | 27.33 |
| 5 | 28 | 610 | 27.11 | |
| 6 | 28 | 650 | 28.88 |
TABLE 5.4
20% replacement of coarse aggregates with tile aggregates
| Cube No. | No. of days | Load applied (KN) | Compressive strength (N/mm2) | Average strength
(N/mm2) |
| 1 | 7 | 450 | 20.00 | 19.03 |
| 2 | 7 | 435 | 19.33 | |
| 3 | 7 | 400 | 17.77 | |
| 4 | 28 | 640 | 28.44 | 26.81 |
| 5 | 28 | 600 | 26.66 | |
| 6 | 28 | 570 | 25.33 |
M 25 GRADE CONCRETE
TABLE 5.5
0% replacement of coarse aggregates with tile aggregates
| Cube No | No. of days | Load applied (KN) | Compressive strength (N/mm2) | Average strength
(N/mm2) |
| 1 | 7 | 515 | 22.88 | 24.21 |
| 2 | 7 | 550 | 24.44 | |
| 3 | 7 | 570 | 25.33 | |
| 4 | 28 | 820 | 36.44 | 35.62 |
| 5 | 28 | 800 | 35.55 | |
| 6 | 28 | 785 | 34.88 |
TABLE 5.6
5% replacement of coarse aggregates with tile aggregates
| Cube No. | No. of days | Load applied (KN) | Compressive strength (N/mm2) | Average strength
(N/mm2) |
| 1 | 7 | 525 | 23.33 | 23.33 |
| 2 | 7 | 500 | 22.22 | |
| 3 | 7 | 550 | 24.44 | |
| 4 | 28 | 790 | 35.11 | 33.99 |
| 5 | 28 | 745 | 33.11 | |
| 6 | 28 | 760 | 33.77 |
TABLE 5.7
10% replacement of coarse aggregates with tile aggregates
| Cube No | No. of days | Load applied (KN) | Compressive strength (N/mm2) | Average strength
(N/mm2) |
| 1 | 7 | 570 | 25.33 | 24.44 |
| 2 | 7 | 550 | 24.44 | |
| 3 | 7 | 530 | 23.55 | |
| 4 | 28 | 760 | 33.77 | 32.36 |
| 5 | 28 | 725 | 32.22 | |
| 6 | 28 | 700 | 31.11 |
TABLE 5.8
20% replacement of coarse aggregates with tile aggregates
| Cube No | No. of days | Load applied (KN) | Compressive strength (N/mm2) | Average strength
(N/mm2) |
| 1 | 7 | 525 | 23.33 | 23.25 |
| 2 | 7 | 555 | 24.66 | |
| 3 | 7 | 490 | 21.77 | |
| 4 | 28 | 685 | 30.44 | 31.99 |
| 5 | 28 | 730 | 32.44 | |
| 6 | 28 | 745 | 33.11 |
M 30 GRADE CONCRETE
TABLE 5.9
0% replacement of coarse aggregates with tile aggregates
| Cube No. | No. of days | Load applied (KN) | Compressive strength (N/mm2) | Average strength
(N/mm2) |
| 1 | 7 | 730 | 32.44 | 32.29 |
| 2 | 7 | 750 | 33.33 | |
| 3 | 7 | 700 | 31.11 | |
| 4 | 28 | 875 | 38.88 | 38.73 |
| 5 | 28 | 850 | 37.77 | |
| 6 | 28 | 890 | 39.55 |
TABLE 5.10
5% replacement of coarse aggregates with tile aggregates
| Cube No. | No. of days | Load applied (KN) | Compressive strength (N/mm2) | Average
strength (N/mm2) |
| 1 | 7 | 660 | 29.33 | 30.73 |
| 2 | 7 | 700 | 31.11 | |
| 3 | 7 | 715 | 31.77 | |
| 4 | 28 | 795 | 35.33 | 36.73 |
| 5 | 28 | 835 | 37.11 | |
| 6 | 28 | 850 | 37.77 |
TABLE 5.11
10% replacement of coarse aggregates with tile aggregates
| Cube No. | No. of days | Load applied (KN) | Compressive strength (N/mm2) | Average strength
(N/mm2) |
| 1 | 7 | 690 | 30.66 | 29.92 |
| 2 | 7 | 580 | 25.77 | |
| 3 | 7 | 750 | 33.33 | |
| 4 | 28 | 790 | 35.11 | 35.92 |
| 5 | 28 | 855 | 37.11 | |
| 6 | 28 | 800 | 35.55 |
TABLE 5.12
20% replacement of coarse aggregates with tile aggregates
| Cube No. | No. of days | Load applied (KN) | Compressive strength (N/mm2) | Average Strength
(N/mm2) |
| 1 | 7 | 650 | 28.88 | 28.73 |
| 2 | 7 | 665 | 29.55 | |
| 3 | 7 | 625 | 27.77 | |
| 4 | 28 | 770 | 34.22 | 32.96 |
| 5 | 28 | 720 | 32.00 | |
| 6 | 28 | 735 | 32.66 |
TABLE 5.12
Average strength results of M20
| No. of days | Normal | 5% | 10% | 20% |
| 7 | 21.25 | 20.44 | 19.55 | 19.03 |
| 28 | 29.03 | 28.21 | 27.33 | 26.81 |
TABLE 5.13
Average strength results of M25
| No. of days | Normal | 5% | 10% | 20% |
| 7 | 24.21 | 23.33 | 24.44 | 23.25 |
| 28 | 35.62 | 33.99 | 32.36 | 31.99 |
TABLE 5.14
Average strength results of M30
| No. of days | Normal | 5% | 10% | 20% |
| 7 | 32.29 | 30.73 | 29.92 | 28.78 |
| 28 | 38.73 | 36.73 | 35.92 | 32.96 |
TABLE 5.15
| After 7 Days | |||
| Proportion | M20 | M25 | M30 |
| 0% | 21.25 | 24.21 | 32.29 |
| 5% | 20.44 | 23.33 | 30.73 |
| 10% | 19.55 | 24.44 | 30.73 |
| 20% | 19.03 | 23.25 | 28.78 |
TABLE 5.16
| After 28 Days | |||
| Proportion | M20 | M25 | M30 |
| 0% | 29.03 | 35.62 | 38.73 |
| 5% | 28.21 | 33.99 | 36.73 |
| 10% | 27.33 | 32.36 | 35.92 |
| 20% | 26.81 | 31.99 | 32.96 |
CHAPTER – 6
Discussion of Results
6.1 DISCUSSION
Acceptance criteria for concrete –
There are two criteria for concrete to be accepted.
- Target mean strength
- Table 6.2 IS 456 : 2000
Target mean strength –
If the specimens are casted & tested under all precautions at laboratory in a controlled manner then strength of specimens is checked against target mean strength.
Table 6.2 IS 456:2000 –
If the specimens are casted & tested at site somewhere, it is difficult to follow all important precautions & guidelines then to compensate those errors strength of specimens is tested against table 6.2 IS 456:2000.
According to which for the acceptance, these conditions should be met with:
- The mean strength determined from any group of four-non overlapping successive test results should conform with the applicable limits as given in table below.
- Any individual test result complies with in the appropriate limit as given in the table.
TABLE 6.1 – CHARACTERISTICS COMPRESSIVE STRENGTH COMPLIANCE REQUIREMENT
(Table 11 IS 456:2000)
| Specified Concrete grade | Mean of the group of 4 non-overlapping consecutive test results in N/mm2 | Specific test results in N/mm2 |
| Concrete Grade M 20 or Above | >= Characteristics compressive strength + established standard deviation x 0.825
Or Characteristics compressive strength + 4 N/mm2 whichever value is greater |
>= Characteristics compressive strength – 4 N/mm2 |
CONCRETE RESULTS CHEACKING AS PER 1st CRITERIA
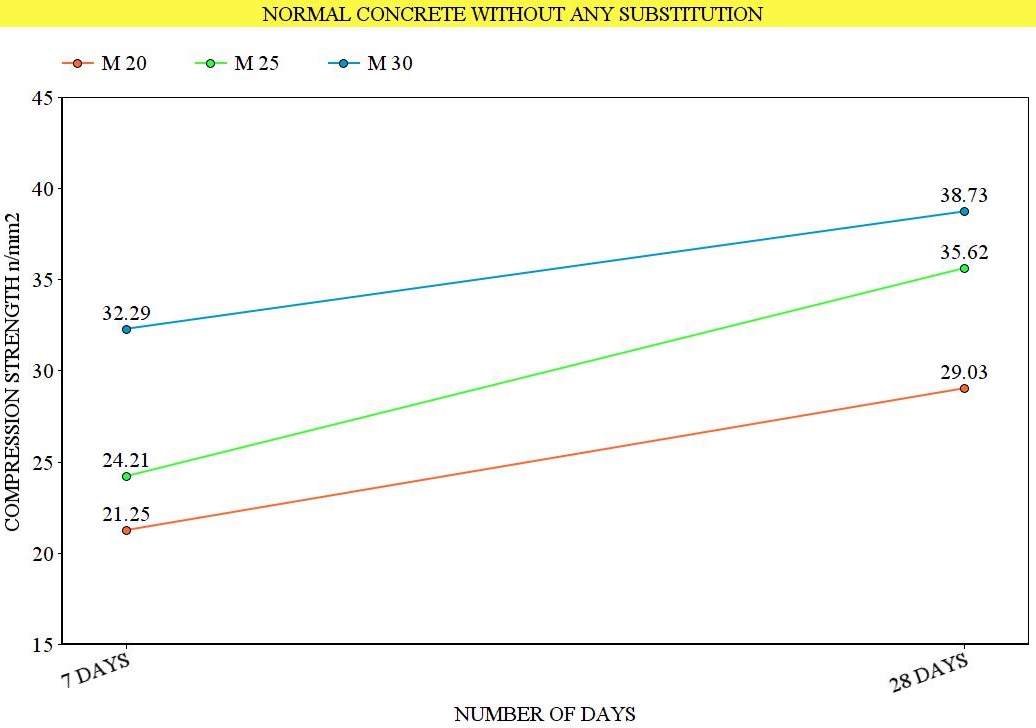
Figure 6.1 – Different concrete grades without any aggregate replacement and their respective compressive strength at 7 & 28 days.
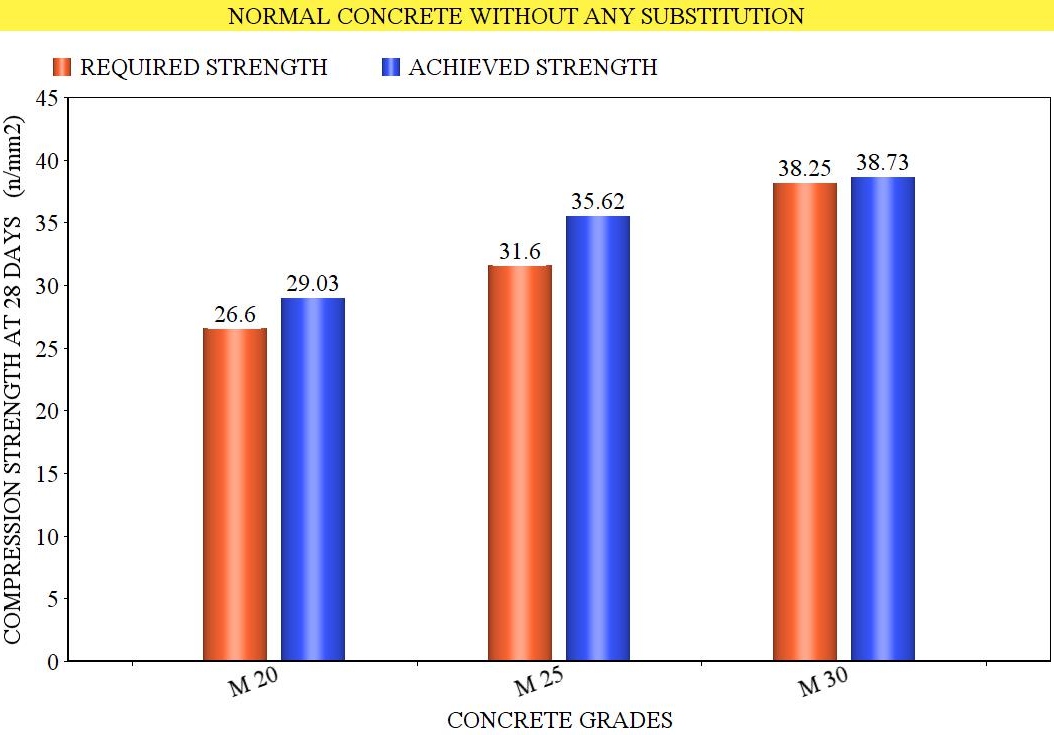
Figure 6.2 – Different Concrete Grade represents their obtained compressive strength against their required Target Mean Strength.
- All three grades shows higher strength than required target mean strength, hence all concrete grades are accepted.
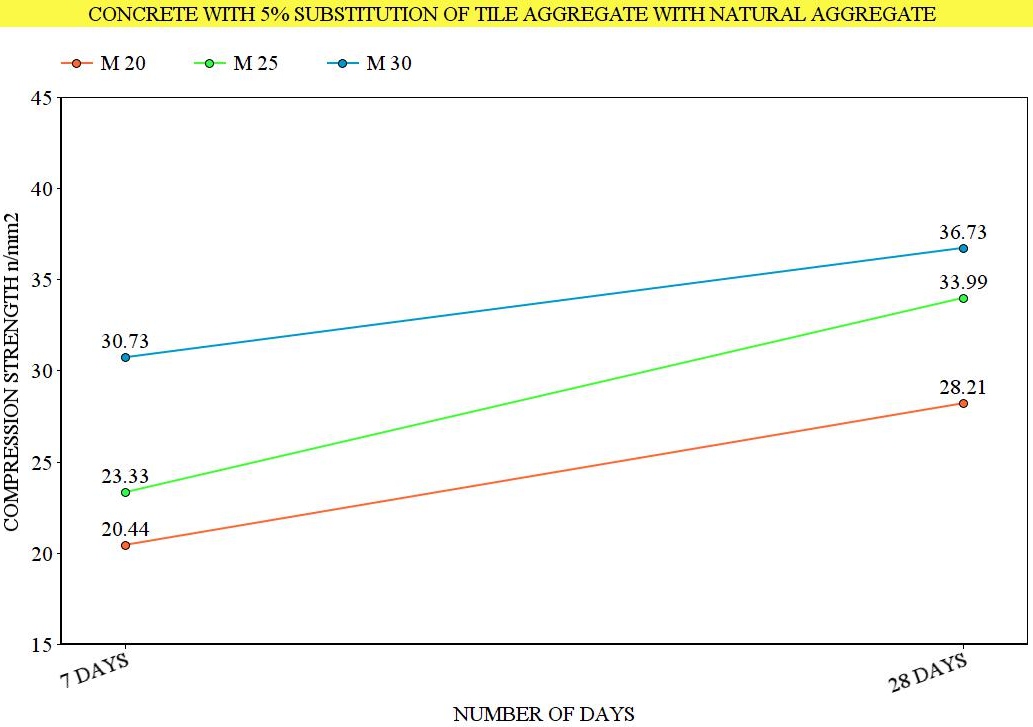
Figure 6.3 – Different concrete grades with 5% replacement of natural aggregate with tile aggregate and their respective compressive strength at 7 & 28 days.
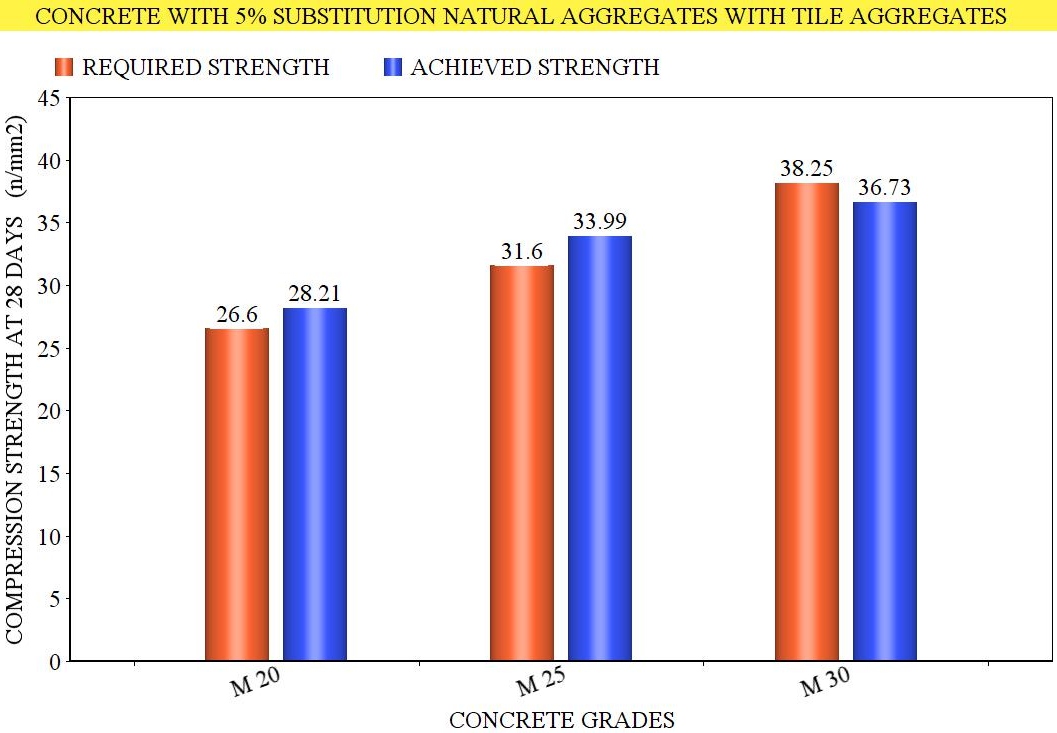
FIGURE 6.4 – Different Concrete Grade with 5% replacement of natural aggregates with tile aggregates represents their obtained compressive strength against their Required Target Mean Strength
- In this case also all concrete grades except M-30 show higher strength than required. M-20 and M-25 are accepted.
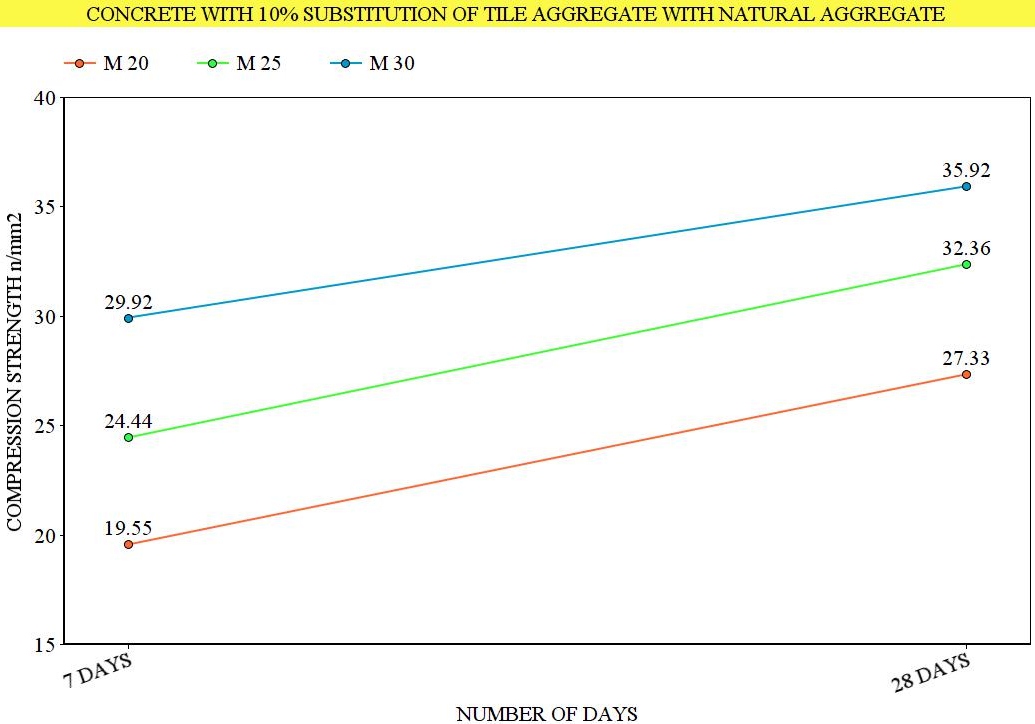
Figure 6.5 – Different concrete grades with 10% replacement of natural aggregate with tile aggregate and their respective compressive strength at 7 & 28 days.
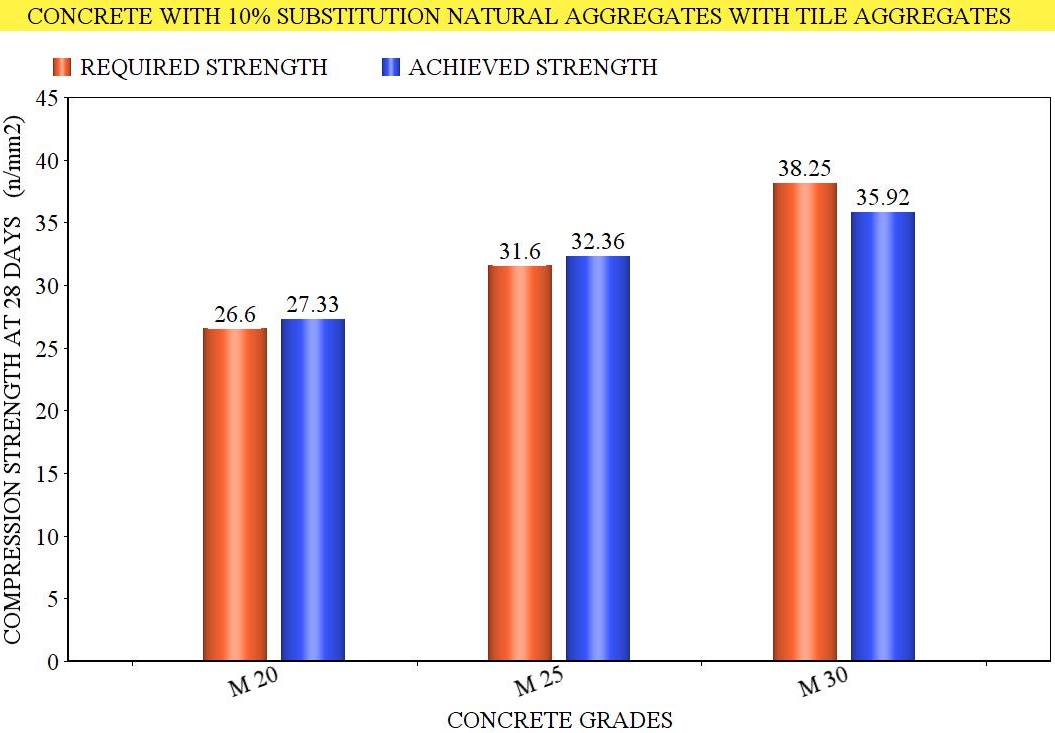
FIGURE 6.6 – Different Concrete Grade with 10% replacement of natural aggregates with tile aggregates represents their obtained compressive strength against their Required Target Mean Strength
- Similarly, in this case all grade concrete possess higher strength than required except M-30 and are accepted.
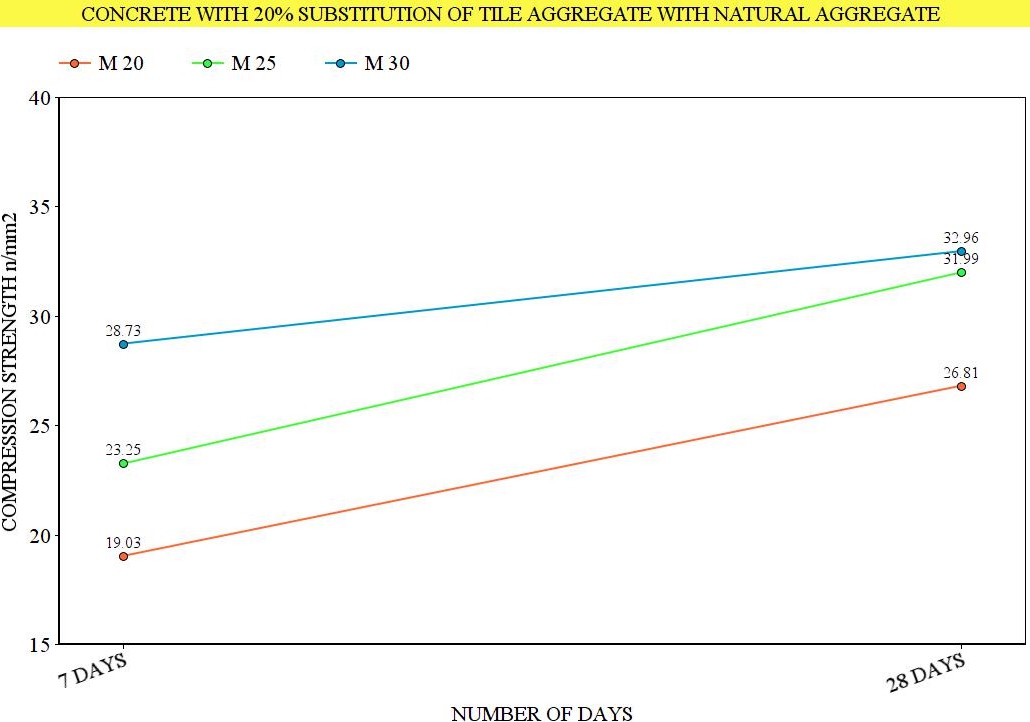
Figure 6.7 – Different concrete grades with 20% replacement of natural aggregate with tile aggregate and their respective compressive strength at 7 & 28 days.
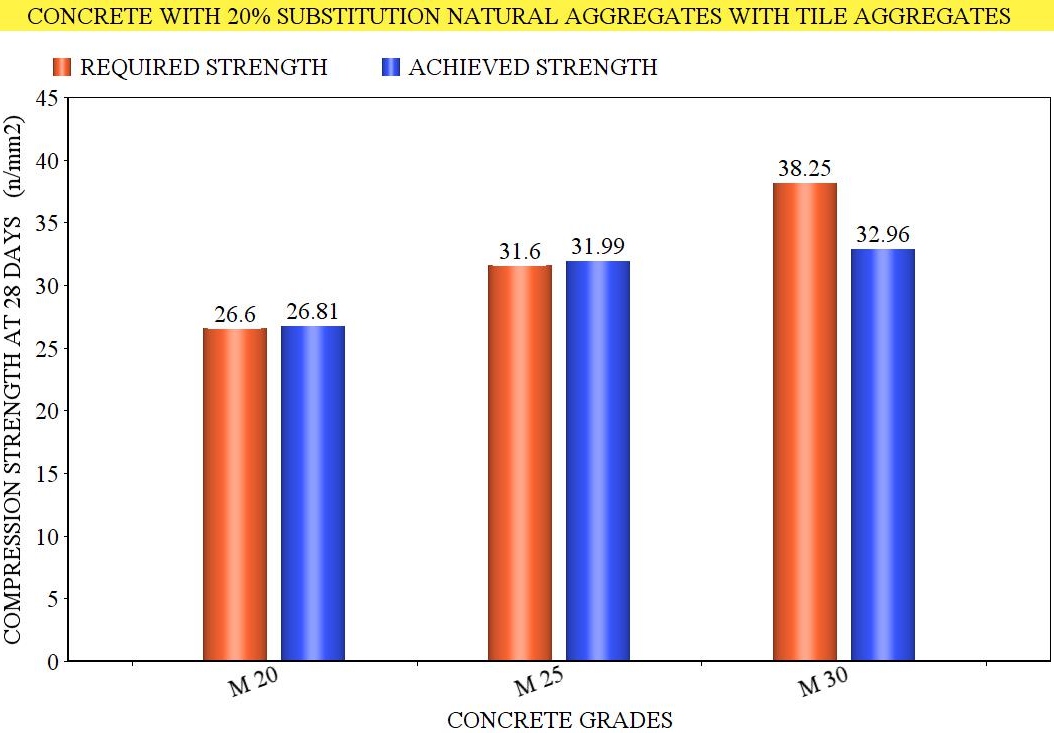
FIGURE 6.8 – Different Concrete Grade with 20% replacement of natural aggregates with tile aggregates represents their obtained compressive strength against their Required Target Mean Strength
- Here, M 20 & M 25 show acceptable strength but M 30 has lower strength than required. So, M 30 is rejected.
CONCLUSION AS PER 1ST CRITERIA
All the batches of M 20 grade concrete containing tile aggregates upto 20% satisfy the required strength. Beyond that compressive strength decreases gradually with increase the proportion of tile aggregates in concrete. Hence, it is possible to replace upto 20% tile aggregates with normal coarse aggregates in M 20 grade concrete.
Similarly, for M 25 grade concrete compressive strength decreases with increase in tile aggregates in concrete in all batches. Upto 20% replacement it meets the required conditions.
M 30 grade concrete should possess high compressive strength as compare to M 20 and M 25. As it can be observed in results that with 5% replacement of aggregates it does not meets the required conditions. Therefore it is not possible to substitute the natural aggregates with tile aggregates in any proportion of M 30 grade concrete.
CHEACKING OF CONCRETE RESULTS AS PER 2nd CRITERIA
Therefore, for M 20
| Specified grade | Mean of the group of 4 non-overlapping consecutive test results in N/mm2 | Individual test results in N/mm2 |
| M 20 | 20 + 0.825 × 4 = 23.30
Or 20 + 4 = 24 24 > 23.3 Hence, acceptance value is 24. |
20 – 4 = 16 |
For M 25
| Specified grade | Mean of the group of 4 non-overlapping consecutive test results in N/mm2 | Individual test results in N/mm2 |
| M 25 | 25 + 0.825 × 4 = 28.30
Or 25 + 4 = 29 29 > 28.30 Hence, acceptance value is 29. |
25 – 4 = 21 |
For M 30
| Specified grade | Mean of the group of 4 non-overlapping consecutive test results in N/mm2 | Individual test results in N/mm2 |
| M 30 | 30 + 0.825 × 5 = 34.125
Or 30 + 4 = 34 34.125 >34 Hence, acceptance value is 34.125 |
30 – 4 = 26 |
CONCLUSION AS PER 2nd CRITERIA
It is clear from the above tables that strength required for 2nd criteria of acceptance of concrete is lower than the 1st criteria, therefore all concrete mixes accept the 2nd criteria automatically except M 30 grade concrete containing 20% replacement of normal aggregates with tile aggregates which fails in both acceptance criteria of concrete.
6.2 COST ANALYSIS
Total cost of 20 mm aggregates to prepare 1 m3 M 20 grade concrete –
Total volume of aggregates in M 20 concrete = 0.691 m3
Total volume of coarse aggregates = 62 % of 0.691
Therefore, 62% of 0.691 = 0.428 (10 mm + 20 mm both)
Volume of 20 mm aggregates in total coarse aggregates = 40%
40% of 0.428 = 0.171 m3
Now,
Price of 1 m3 of 20 mm natural aggregates = Rs. 1175 (as per CPWD rate analysis 2014)
Price of 0.171 m3 20 mmnatural aggregates = 1175 × 0.171
= Rs. 200
Now, Total saving by substituting natural aggregate with tile aggregate in M 20 concrete –
Volume of 20 mm aggregates after 20 % replacement with tile aggregates
= 20/100 × 0.171 = 0.0342 m3
= 0.171 – 0.0342 = 0.1368 m3
Price of 0.1368 m3 of aggregates = Rs.162
Total saving on 1m3 M 20 grade concrete by replacing 20% tile aggregates with normal aggregates = 200 – 162 = Rs. 32
Hence, total saving on aggregates in terms of rupees to produce 1 m3 of M 20 grade concrete by using tile aggregates = 16%
(Without including labor and transportation charges)
CRUSHING COST OF TILES –
Machine Model Φ400×400 specification –
- Manufacturer = ALPU
- Price = Rs. 50000 approx.
- Rotor speed = 1500 rpm
- Input opening size = 145 × 450 mm
- Discharge size = 0 – 30 mm
- Capacity = 5 – 8 tons/hour
- Power = 7.5 kw
- Weight = 0.9 ton
- Overall dimensions = 844×942×878 mm (L×W×H)
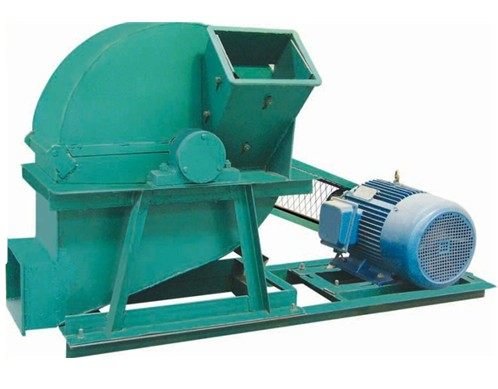
FIGURE 6.9 CRUSHING MACHINE
Crusher machine price = Rs. 50000 – 1000000
(depends upon capacity of machine)
Operating cost of machine per hour = power × per unit electricity cost
= 7.5 ×7 = Rs. 52.50
Output per hour = 5 to 8 tons of tile aggregates
As a result, at the cost of rupees 52.50, 5 to 8 tons of tile aggregates can be obtained which is sufficient to be used in large quantity of concrete. So, tile crushing cost is negligible.
6.3 SUMMARY
In this chapter experimental results have been discussed. In addition to this the cost analysis of aggregates has also been presented.
CHAPTER – 7
Conclusions
7.1 CONCLUSIONS
It is very much essential and important to find solution for construction waste and to find alternatives for natural raw materials of construction. As population is increasing day by day, demand of aggregates in concrete is also increasing. Simultaneously, concrete waste production is increasing. So the best solution for both of the problems is to reuse such waste in concrete production.
- Ceramic tile aggregate is an appreciated and appropriate concrete material for substitution into concrete composition based on its properties.
- Mechanical properties of ceramic aggregate are similar to the natural aggregate and its behavior is similar but not same. Water absorption, crushing value and impact value, are higher than natural coarse aggregate and lower by specific gravity i.e. 2.24 g/cm3 .
- It is possible in M 20 grade concrete to substitute 20% of normal 20 mm aggregates with ceramic tile aggregates without compromising its required compressive strength.
- For all concrete mixes (M 20, M25, M30) compression strength of concrete decreases with increase in the proportion of replacement of natural aggregates with tile aggregates which is due to low specific gravity higher porosity of tile aggregates as compare to natural aggregates.
- In M 30 grade concrete with 5% substitution of tile aggregates its strength decreases from 38.73 to 36.73 n/mm2, which is less than target mean strength. So, as per results substitution should be avoided for this grade of concrete. M 20 and M 25 concretes are suitable for the replacement of aggregates.
- Tile aggregate concrete is little bit more economical as compare to conventional concrete. As an estimate for making 1 m3 of concrete by substituting 20% normal 20 mm aggregates with tile aggregates about 16% money can be saved on total amount of 20 mm aggregates.
- By addition of ceramic tile waste into concrete, proper effective utilization of ceramic tile waste can be achieved.
7.2Scope for Further Studies –
- In this experimental study only compression strength has been checked, effect on tensile strength and flexural strength of concrete with inclusion of tile aggregates can be investigated.
- Although by decreasing the water/cement ratio, high strength concrete can be obtained. But the workability will be very low. As in this study the required workability is achieved by using maximum water cement ratio. Therefore, it is recommended that adding admixtures such as super plasticizer and silica fume into the mixing so that the workability will be improved.
- More trials with different particle sizes of tile aggregate and percentage of replacement of natural aggregate are recommended to get different outcomes and higher strength characteristics in concrete.
BIBLIOGRAPHY
- Advanced Construction Technology System –ACTSBy P. G. Ioannou,1 A.M. ASCE, and L. Y. Liu,2 A.M. ASCE.
- Binici, Effect of crushed ceramic and basaltic pumice as fine aggregates on concrete mortars properties, Construction and Building Materials 21 (2007) 1191–1197.
- Brito J.de., Pereira A.S., Correia J.R., (2005), Mechanical behaviour of non-structural concrete made with recycled ceramic aggregates, Cement & Concrete composites, pp 429-433.
- Concrete Technology by M. S. Shetty S. Chand Publishing, page no. 66 – 118.
- DUET Journal “Effect of Replacing Natural Coarse Aggregate by Brick Aggregate on the Properties of Concrete” Vol. 1, Issue 3, June 2012.
- Freedonia world construction aggregates industry study
- International Journal of Civil Engineering Research,ISSN 2278-3652 Volume 5, Number 2 (2014), pp. 151-154,© Research India Publicationshttp://www.ripublication.com/ijcer.htm
- International Journal of Civil Engineering Research. ISSN 2278-3652 Volume 5, Number 2 (2014), pp. 151-154.
- IS 10262:2009, Indian standard concrete mix proportioning – Guidelines (First revision), Bureau of Indian Standards, New Delhi, India
- IS 383 : 1970, Specifications for Coarse and Fine Aggregates from Natural Sources for Concrete ( second Revision) Bureau of Indian Standards, New Delhi, India.
- IS 456 : 2000, Plain and Reinforced Concrete – Code of Practice (fourth Revision) Bureau of Indian Standards, New Delhi, India.
- IS 516 : 1959, Methods of Tests for Strength of Concrete, Bureau of Indian Standards, New Delhi, India.
- Journal for scientific and Industrial Research, Vol. 70, May 2011, pp.385-390.
- Koyuncu, Y. Guney, G. Yilmaz, S. Koyuncu, R. Bakis, Utilization of Ceramic Wastes in theConstruction Sector, Key Engineering Materials Vols. 264-268 (2004) pp 2509-2512.
- Mohd Mustafa Al Bakri, H. Kamarudin, Che Mohd Ruzaidi, Shamsul Baharin, R. Rozaimah, Nur Khairiatun Nisa. Concrete With Ceramic Waste and Quarry Dust Aggregates. 5th Annual Conference Management in Construction Researchers Association, 2006: 383-388
- Mohini Saxenaa, & Shyam R. Asolekar – Solid wastes generation in India and their recycling potential in building materials.
- Pacheco-Torgal, S. Jalali, Reusing ceramic wastes in concrete, Construction and Building Materials 24 (2010) 832–838.
- Wattanasiriwech, A. Saiton, S. Wattanasiriwech, Paving blocks from ceramic tilec production waste, Journal of Cleaner Production 17 (2009) 1663–1668.
Cite This Work
To export a reference to this article please select a referencing stye below:
Related Services
View all


Related Content
All TagsContent relating to: "Building Materials"
Building materials refers to any material that is used for construction. Many different natural materials were used historically for building such as wood, clay, stone etc. but the material most commonly used in construction is now concrete.
Related Articles

DMCA / Removal Request
If you are the original writer of this dissertation and no longer wish to have your work published on the UKDiss.com website then please: