Advancements in Aerial Survey: Analog to Digital Solutions
Info: 13612 words (54 pages) Dissertation
Published: 11th Dec 2019
Tagged: Information TechnologyTechnology
 Cover: Aerial Survey (Source: ITC, principle of remote sensing, 2009)
This report offers an in-depth description of advancements in aerial survey by examining its theory, analyzing the usage of related technology, methods, applications, and findings. These sections are categorized into their own subsequent sections in this report for more clarity and flow.
Taking the current surveying technologies and their advancements in consideration, a need was seen to have an analytical thought on the previous used technologies and the modern ones. Thus, the need for this report was seen.
Abstract
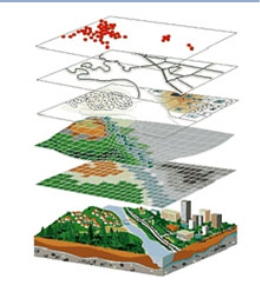
Systematic measurement of anything that people see and do is surveying. In land or spatial survey, the objects which are surveyed have characteristics such as location, other location related attributes, even any phenomena located on that point in space. Such objects are either in point or line form. They might also have area and volume. Measurement of geo-spatial objects is done with a base reference point grounded on which the relative angle, distance, or coordinates of other related objects can be determined. This leads us to aerial survey which is a process of measuring related objects based on a point in space. The following sections in this report will explore 1) the ways in which aerial survey is done, 2) comparison of surveying methods depending on the volume of data to be collected, 3) selection of surveying technologies with respect to the accuracy required, and finally 4) the advantages in using aerial survey. With the advancements in survey-related technologies and the massive data they provide, the need for using cloud-based services for analyzing geo-spatial data is already highly demanded in various professions. We could take Google maps, transit systems, weather forecasts as some applications.
Surveyors who were used to analog systems have to move to digital technologies for need of more speed and accuracy. Measurement of geospatial data by using pictures (also referred to as photos or images) is known as photogrammetry. Remote sensing is the process of gathering the data-attributes from space using remote sensing technologies. These two technologies combined are further trending towards modern technologies including GNSS, LiDAR, and drone mapping. For that reason, aerial survey is also applicable in several fields including airborne and spaceborne industries.
The need for more accuracy and quality of the data gathered from aerial survey is always increasing. For that reason, there are some projects being undertaken by professional organizations such as International Federation of Surveyors (FIG) and International Society of Photogrammetry ad Remote-sensing (ISPRS) to expand the knowledge in surveying, as well as doing more research and development activities.
It is not uncommon to hear terminologies like ‘mobile mapping’ and ‘user accessibility’ anymore in terms of surveying and mapping. Companies are benefitting from more advantages from surveying technologies when they apply the massive aerial data for analysis in real-world situations such as disaster mapping and mobile mapping. This kind of usage of survey data is also known as hybrid modeling.
Probably the most commonly used application of aerial images is Google’s mapping application which makes a very wise use of aerial-survey data and drone-based data. It seems to be applicable with civilian as well as the military purposes Socio-economic information systems could also be applied. All these data can be tied up via internet applications.
Analog-maps that were obtained from previous technologies are being transformed into digital form, which can be then applied dynamically. Various national mapping agencies collect the aerial data and use it to produce the topographical basemap. Other geomatics firms also collect such aerial data by using the aerial survey systems such as Light Detection and Ranging) LiDAR, Laser scanning, and Drone.
In this context, the advancement in aerial survey starting from its analog to digital phase has been conceptualized and designed as a part of technical report writing project.
This report describes aerial survey, foundation, concept, technological development, major application, and future applications in brief. Some of the latest technology and their usability are also described in brief.
Keywords: Aerial Survey, Geomatics Engineering, Geospatial Data, Maps, Technology, LiDAR, Laser Scanning, Drone mapping, Mobile mapping 3D Data Cloud,
Acknowledgement
The completion of this technical writing project for ENGL 1282 would not have been possible without the hearty cooperation received from many individuals who have helped with this report in various ways.
Our sincere acknowledgement is to the course instructor Cathy Kwasney for her complete guidance, assistance, and critical comments, which immensely helped to keep us on track and complete our technical report on the topic “Advancements in Aerial Survey: Analog to Digital Solutions”.
This team would also like to thank subject matter expert Mr. Shijan K. Dhakal (Director of Government of Nepal, Ministry of Land Reform and Management, Land Management Training Centre, tutor Mr. Om Mani Pokharel (System Analyst, TELUS Communications, Edmonton) and all the instructors of Geomatics Program for their cooperation and support.
Team would like to thank all my fellow colleagues of first year NAIT Geomatics Engineering Technology course for their friendship, good cooperation, and support.
Finally, the team would like to express our heartfelt gratitude to our beloved families. They always wished every success in our effort; their encouragement, love and help gave is the strength to progress our studies.
Table of contents
Glossary of Terms/LIST of ABBREVIATIONS
1.1. Background on Surveying (Geomatics)
1.4. Research Research methodology and Development
2. Foundation of Aerial Survey
2.1. Definition of Aerial Survey
2.2. Historical Trends in brief
2.3. Phases in the development of aerial survey technologies:
2.3.1. Initial phase of aerial survey
2.3.2. Second phase of aerial survey
2.3.3. Third phase of aerial survey
2.3.4. Fourth phase of aerial survey
3.2. Ground Control Points (Framework data)
3.4. 3D Data Models for Aerial Survey
4.4. LiDAR and Digital Scanning
5. Application of Aerial Survey
5.5. Unmanned Aerial Vehicle (UAV)
7. Findings and Recommendations
List of Figures and Tables
Cover: Aerial Survey (Source: ITC, principle of remote sensing, 2009)
Figure 2‑1: Analog aerial camera
Figure 2-3: Digital Aerial Camera
Figure 3-1: Geometry of digital frame
Figure 3‑2: Camera Orientation
Figure 3‑3: Interior Orientation
Figure 3‑4: The Process of digital plotting
Figure 4-2: WILD B8S Stereoplotter
Figure 4-2:KernPG2 Stereoplotter
Figure 4-3: Analytical stereoplotter
Figure 4-3: Digital photogrammetry
Figure 4‑3: Aerial Survey LiDAR
Figure 5‑2: Orthophoto Principle
Figure 5‑3: Orthophoto map production
Figure 5‑4: Orthophoto Production Status at New Brunswick
Figure 5‑5: Combination of Image and DTM
Figure 5‑6: Mobile mapping unit
Figure 6‑1: UAS (Unmanned Aerial System)-Topcon Positioning Group
Table 1: Findings of use of different aerial surveys and terrestrial surveys
Appendix A: Laser Scanning and Photogrammetry
Appendix B: Topographical Basemap of Capital of Nepal Kathmandu, Sheet No: 2785-06A
Glossary of Terms/LIST of ABBREVIATIONS
Aerial camera: A camera specially designed for use in an aircraft, is specially designed to produce images for the purpose of surveying and mapping.
Aerial triangulation: The process of finding the exterior orientation parameters of a block of aerial photos/images using a limited number of ground control points.
CCD: Charge-Coupled Device, a solid state detector using silicon as semiconductor material. Many are assembled on one chip and equipped with a shift register to transpose charge and sample it at the end of a CCD line after amplification. One CCD is good for one pixel in one spectral band. A camera with three channels needs three CCDs for one ground resolution cell.
Data: Factual information in digital form, used as basis for calculation, reasoning by a computer, etc.
Digital Elevation Model (DEM): A representation of a surface in terms of elevation values that change with position. Elevation can refer to the ground surface, a soil layer, etc. According to the original definition data should be in raster format.
Digital Surface Model (DSM): In earth observation from air or space, often synonym for DEM, elevation standing for terrain elevation.
Digital Terrain Model (DTM): A digital representation of terrain relief in terms of (X, Y, Z) coordinated in earth observation from air or space, often synonym for DEM, elevation standing for terrain elevation.
Digitizing: Generally, any process that converts an analog representation of physical quantity to a digital representation, i.e., numeric values. The features can digitize either on hardcopy images using an analog digitizing table (2D) and analytical photogrammetric plotter (3D), or on softcopy images using a standard computer screen and mouse (2D on-screen digitizing) and a digital photogrammetric workstation (3D).
Features: A set of measureable properties of the Earth’s surface.
Fiducial marks: Four or eight reference markers fixed on the frame of a film survey camera and visible in each photograph. Fiducials are used to compute the transformation from pixel coordinates to image/camera coordinates.
Geospatial data: Factual information related to location on the surface of Earth.
Inertial Measuring Unit (IMU): A device providing altitude data of a sensor it is attached to or of an aircraft in which it is located. An IMU is the core instrument of an INS and it is also used in a POS for direct sensor orientation.
GPS: A satellite surveying method providing accurate geodetic coordinates for any point on the Earth at any time.
Laser: Acronym for Light Amplitude by Stimulated Emission of Radiation. Laser instrument used as active sensor for ranging and imaging operate in visible near-infrared range. Topographical LiDAR (Light Detection and Ranging) instruments use wavelengths between 0.9 to 1.6 µm.
Orientation: In photogrammetry, the process of relating some form of image coordinates system to some form of 3D system. Interior orientation provides internal camera model information that describes the construction of the bundle of rays using the principle distance, principle point. Exterior orientation provides external camera model information that describes the exact position and rotation of each image in an object space system as they existed when the image was taken. Relative orientation computes the mutual pose of two (stereoscopic) images at the time of exposure; subsequent absolute orientation establishes the relationship with an object space coordinate system.
Orthophoto/orthoimage: An aerial photo or satellite image that has been transformed to a map projection and radiometrically enhanced such that it is free of geometric distortions and radiometric distortion.
Overlap (Forward): Considering a traditional aerial camera, when two images overlap, they share a common area typically by 60%.
Photogrammetry: The science and technique of making measurement on photographs and converting these to quantities meaning in the retrain. In analog photogrammetry, optical and mechanical instruments, such as an analog plotter, are used to reconstruct 3D geometry from two overlapping photographs. In analytical photogrammetry, the computer replaces some expensive optical and mechanical components and software relates image spaces to object space. In digital photogrammetry, hardcopy photographs are replaced by digital images.
Pixel: The term stands for ‘picture element’; it is building cell of a digital image.
Photo block: A block of aerial photography is the set of image obtained by an aerial survey mission. A traditional frame camera block might consist of a number of parallel trips with a sidelap of 20 -30% and forward overlap of 60%.Photogrammetric software typically stores all of the information associated with a photogrammetric mapping project in the block file, such as spheroid and datum, map projection; camera model, ID of images, GCPs, orientation coefficients.
(Source: Tempfli, K., Kerle, N., Huurneman, G.C., Janssen. L.F.C. (2009) Principles of remote sensing (4th Ed.), ITC studies series)
1. Introduction
1.1. Background on Surveying (Geomatics)
In everyday life, there always is a need to measure anything the people do or see. To measure anything, there is generally a predefined approach depending on what we are measuring. In this paper, we will be focusing on measuring land, thus arises the topic of Geomatics Engineering. Surveying, in regards to Geomatics, is synonymous to life in human. It is the systematic process of measurement of geospatial objects (Kraak and Ormeling, 1996).
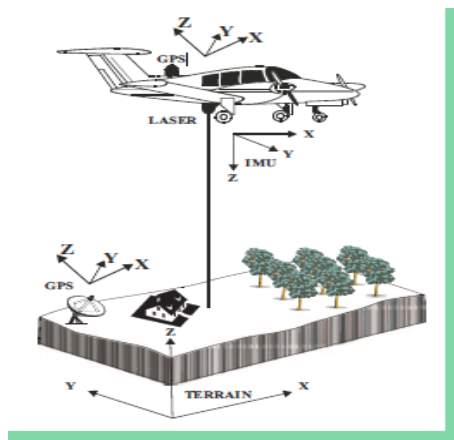
The interest of this paper is solely on aerial surveying methods that have been in use in various parts of the world since ages. In the process of aerial survey, the surveyors gather geography-related data (raw data, imageries etc.) by using aeroplanes, helicopters, LiDAR (Light Imaging and Ranging), UAV (Unmanned Aerial Vehicle), or other aerial method such as remote sensing satellites(Tempfli et al., 2003 p.122).The team study the changes that have occurred in the surveying world starting from the early surveying era until the present dates, which covers analog equipments as well as the modern well-equipped digital devices.
The aerial survey activities can also be broadly defined to include acquisition, measurement, and interpretation, and evaluation of photographs, imageries, and other remotely sensed geospatial data (Gillani and Wolf, 2014). Later sections will discuss about the specifics of the technologies using for aerial surveys in more details.
1.2. Purpose of the study
The intent of this paper is to explore the topic of Aerial Survey by examining its theory, analyzing the usage of related technology, methods, and their diverse applications in different disciplines of geomatics engineering. Modern surveying tools and technology provide even more opportunity to collect, maintain and discriminate the real time geospatial data.
1.3. Scope and limitations
This research group start with along analog aerial survey and photogrammetry equipments and further move towards modern technologies including Global Navigation Satellite System( GNSS) , LiDAR ( Light Imaging and Ranging) , and drone mapping. Since aerial survey has diverse applications, it is applicable in several fields including airborne and spaceborne industries. The limitation of the project is the partial access to related research, and articles, and availability of instruments, software, and further resource professional.
1.4. Research Research methodology and Development
The following plans and working methods gives the overview on the research and development activities which will help to complete the report within time frame.
- Preliminary Research: Literature reviews, and library consults are the preliminary research
- Analysis of Gathered Data: The team documented the data after analysis its usefulness.
- Early Concept: The early concept and knowledge in the various surveying and mapping subjects such as Photogrammetry, Cartography, and Control Survey, Geographic Data Infrastructure (GDI), Geographic Information System (GIS), Remote Sensing, and computer applications are useful to develop a concept and finish the project.
- Conduct Interview: The team was advised that a formal application for ethics is not a necessity for this writing as it is only to fulfill the requirements of this technical report project assignment for course ENGL1223. As a part of this assignment, the team will organize an interview session with Mr. Shijan K. Dhakal which will also be a part of this discussion. The informative questions consult with the expert on the various aspects of aerial survey, topographical base map production procedure, processing the aerial photos and its field verification procedure, digital conversion of vector data to the raster data, formulation of national geographic information infrastructure project, hazard mapping application, and other digital mapping applications provide the resources to complete the report.
- Personal Experiences: The team working on this paper has also committed to use their personal experiences in sections where the needs occur to be. Janak Raj Gautam, one of the team members working on this project has applied his experiences from Nepal wherein he worked in several places.
- Consultation with Instructor: The team will consult with Instructor to get the feedback on the drafts document and then apply the feedback to the final document prior to submission.
- Final Report: The team will precisely analyze the collected data such as research material, professional interview, and other related pre-existing subject related knowledge to produce a comprehensive technical report on Aerial Survey.
- Oral Presentation: The team will prepare a 20-22 minutes PowerPoint presentation with the objective of educating the audience and users about the Aerial Survey, its developmental consequences, and its application of the digital geospatial model in the surveying and mapping discipline.
- Project File: The team will prepare a project files containing the binders of all activities from start to end, hardcopy as well as the digital copy of final technical report, presentation, and communication information about the final report.
2. Foundation of Aerial Survey
2.1. Definition of Aerial Survey
National Resources Canada (NRC) defines Aerial survey as a method of collecting georeferenced geospatial data either in the form of point cloud, photos, or imagery by using aeroplanes, helicopter, laser scanning, and or other aerial methods (NRC, 2013). Most of the topographical base maps are prepared by using aerial photographs taken via Aerial Survey (Wolf, 1980). Nowadays, newer technology called Unmanned Aerial Vehicle (UAV) is used to update the topography in the top base map of the area specific project (Gillani and Wolf, 2014).
2.2. Historical Trends in brief
The history of surveying technologies has been divided into three sections for ease of understanding and more contrast.
Scientists invented analog camera at the middle of eighteen century, and gradually surveyors started to use the camera-outputs (photo) as one of the sources of information for mapping (Schenk, 2005). Because surveyors started using such cameras on the land, such photography are referred as Terrestrial photography. These pictures are taken from a fixed position on or near the ground.
At the beginning of eighteenth century, the maps at that time were generally topographical base map because they were prepared by using plain-table survey, which were very expensive and time consuming. Cameras were used to take photos from the space, mounted on airplane or something applicable. The process of taking aerial photo is called aerial photography and the survey work known as aerial survey. Because of the ease of taking photogrammetry images, aerial surveyors started to use these instead of plain table survey for mapping. Once the photographs are taken, aerial photos are analyzed to discover the geographical information of the terrain which is then considered to be an efficient and effective procedure to describe the geospatial data (Wolf, 1980 pp.10). The topics just mentioned are described in more details in later sections.
Furthermore, the new wave in the aerial survey started after the evolution of latest technological developments such as high speed internet, Global Navigation Satellite System, and Laser Scanning. Many mapping agencies around the world have been using digital aerial photography technologies such as high resolution aerial survey, LiDAR and Drone surveys to prepare maps or data cloud (Gilani and Wolf, 2014). Those maps or clouds are now retrievable through world-wide web. GIS-data management system is developed to share, to analyze, to maintain the needed geospatial database (Kraak and Ormeling, 1996).
Now, the tremendous data could be collected through the aerial survey so that because of the availability of the geospatial data infrastructure through every country (Dale and McLaughlin, 1999). The awareness to resolve global issues started and different countries under the United Nations began their initiatives to solve the global issues including global warming, climate change, world ecosystem, El Niño effect, and so on by monitoring and analyzing those data in compatible systems using the data from interconnected clouds. Global Mapping Project initiated by the Government of Japanis an example of a collaborative international project of developing Global Map for sustainable development, environmental protection and disaster mitigation (Geospatial Information Authority of Japan, n.d.). The professional organization of land surveyors International Federation of Surveyors (FIG) has also been working to knot the technological connection among the surveyors through various commissions. For example, the new concepts of Mobile Mapping have been created through the Mobile Mapping Symposium. Likewise, the International Society for Photogrammetry and Remote Sensing (ISPRS) has been working to develop the international cooperation for the advancement of aerial survey and its application using photogrammetry and remote sensing tools through their different commissions.
During the formulation of working outlines of this report, this team contacted subject matter experts and asked for some practical working ideas about the base map preparation procedure, managing the geospatial data and the some of the application of aerial data and data cloud to study the cases. Dhakal, S. K. (personal communication, March 09, 2017) explained about some activities like FINNMAP (1992-2000), National Geographic Informational Infrastructure Programme (NGIIP), and application of aerial photo, aerial images and existing vector data to assess natural disaster. For example: flood risk assessment of Kamala River in border between southern Nepal and northern India (see Appendix B).
At the same time, the team realized and decided to utilize the contents about the UAV application, its effectiveness and accuracy, from the information session by the Challenger Geomatics dated Monday, February 27, 2017 room number CAT104. It was explained that the drone mapping is the latest application of the aerial survey and digital photogrammetry where the small remote controlled aerial vehicle with Inertial Measurement Unit (IMU) and laser scanning sensor. The collected georeferenced geospatial data cloud is then analyzed and documented (Rango et. al., 2006). The team will also analyze the usability aspect of Light Detection and Ranging (LiDAR) and Digital Survey solutions in the next sections of the report.
2.3. Phases in the development of aerial survey technologies:
Based on the developmental phases in aerial survey technologies as described in the course GS 2005 on “Introduction of Photogrammetry” by T.Schenk of Ohio State University, Department of Civil and Environmental Engineering and Geodetic Science, the following is a brief description about the phases of the development:
2.3.1. Initial phase of aerial survey
The initial phase was the first generation technological development of photography, and terrestrial photogrammetry started from 1850 to 1900. In this phase, the photos were depicted and adopted as a source of information.
 The aerial camera (shown in figure 2-2) is obviously the first component in the total photogrammetric system since it is used to obtain the photography from which the data can be extracted. The camera is similar in function to the
surveying instrument since it is used to gather information about the geospatial object in the ground. The aerial camera is very powerful to expose a large number of photographs in rapid sequence while moving in an aircraft at high speed also contain the fast lens, efficient shutter, and large-capacity of magazine or, the digital storage(Punmia and Jain,1992).
2.3.2. Second phase of aerial survey
The second phase started after the invention of airplanes, the aerial photos were taken from air and geographical information was digitized in order to prepare the topographical basemap. The analog photogrammetry was used to prepare the basemap around the globe. The universal cartographic rule, analog algorithm and surveying and mapping theory and principles were developed. This phase started from 1900 to 1950 (Wolf, 1980).
2.3.3. Third phase of aerial survey
The third phase started after the invention of computers, the quality and resolution of the aerial photos were improved and analytical photogrammetry started which provided the facilities of semi-automatic digitization of geographical data and recording capability of the attribute data. The analog form of data stage is changed into the digital form. The scanning technologies provided the ARCINFO compatibility facilities from Rater to Vector and vice versa. The object from the real world could be localized in 3D space in map stored as the geographical information system in the points, line, area or volumes symbol categories (Kraak and Ormeling, 1996). Later, digital cartographic product such as digital layers, orthophoto are prepared by the national mapping organization as the base data for the users. The photography from space called remote sensing started, the satellite images have been captured and its resolution and other digital analytical option are advancing. This phase started form 1950 and at the end of twentieth century, the invention of Global Navigation System (GPS) has changed the geomatics engineering into new era (Ghilani and Wolf, 2104).
2.3.4. Fourth phase of aerial survey
Fourth era started from the beginning of new millennium. The aerial survey has expanded its dimension. Advancements in the Global Navigation Satellite System, Inertial Measurement Unit, Laser Technology, broadband internet connection and large storage capacity of computers has created the new opportunity of collecting tremendous geospatial data 3D geospatial data, 3D Laser Scanning and Drone mapping for multipurpose projects. Using multimedia in the digital image and Google mapping are the optimization of use of real time geospatial data (Ghilani and Wolf, 2104).
3. Theoretical Concept
Aerial Photography is used for aerial survey. The camera is mounted on a fast moving airoplane above certain height from the ground. Analog aerial cameras need fast lens, high speed and efficient shutter, magazine to hold large rolls of films. Wild RC 10 was the popular aerial and precise aerial camera used for aerial photography in many countries around the world where the aerial camera shutter can be operated manually by an operator so that photos are taken at specific intervals (Punmia and Jain, 1992).
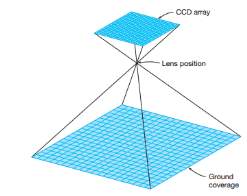
In the digital aerial camera as shown in the figure 2-3 above, it requires fast lens, high speed and efficient shutter, large memory storage and this camera has 4 bands, 16-bit higher resolution with nominal focal length, wide view angle capacity, and filters (Gilani & Wolf, 2008). The aircraft used for aerial survey is at a considerable distance from the terrain to be photographed, operator keep the optical axis of the camera lens perpendicular to the focal plane in order to take the vertical photo. Images of the fiducial marks are printed on the photo and the line joining opposite pair intersects at the principle axis so that the photo becomes perpendicular to the camera axis. In this digital camera, an array charged coupled device (CCD) is placed in the focal plane to capture the image from lens so that pixel within the overall image can be stored row-wise and column-wise. Operator starts to acquire the images based on the flight planning. The flights for aerial survey include the acquisition period, platform, focal length, flying height, Ground Sample Distance (GSP), resolution, scale and fiducial marks (Gilani and Wolf, 2008 pp 789-800).
Ground Control Points (GCP) on the earth surface are the important referencing point in the aerial image so that GCPs need to be established before acquiring the aerial survey. The accuracy of aerial survey depends on the accuracy of GCP establishment (Wolf, 1980). GCPs have correct 3D location of the ground. GCP’s allow images to be georeferenced to a higher degree of accuracy (NRC, 2016).

3.1. Flight Planning
Flight planning is a planning process of acquisition of the aerial photography in the specified photogrammetric project (Tempfli et al., 2003). Vertical aerial photographs are captured through the aerial camera mounted on airplane along the flight line, the overlap of photographs in the direction of flight line is called forward overlap, and the overlap area among the photographs should be 60%. Likewise, the sideways overlap between flight lines is called side lap, the side lap area among the photographs should be 30%. The reasons for overlap the photographs are to create the stereographic model of the ground. In the modern systems, overall the flight planning such as scale, contour interval, flying height, and the coordinated flight lines is done by using the computer and, on-board GNSS guide the pilot. The vertical aerial photograph has the dimension with 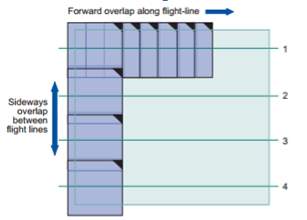 square format of 9 by 9 inch or 228.6 cm (~23cm) by 228.6 cm (~23cm), the focal length of 152mm with wide angle field angle (i.e. 1200) (Punmia and Jain, 1992). The number of aerial photograph (N) is determined by the total area covered of the project over the total area covered by a photograph (NRC, 2016). The figure 3-2 illustrates the flight planning of the aerial photography in the specified area.
3.2. Ground Control Points (Framework data)
Framework data preparation is another important task after flight planning (Ghilani and Wolf, 2014). The main task of framework data consists of three parts- establishing the control point to cover the entire area proportionally, marking the GCPs on the ground appropriately for photographic purpose, and the accuracy check of the GCPs. The Ground Control Points (GCPs) on the surface of the terrain provide the horizontal and vertical information of that location correctly based on the required projection system. Those GCPs marks are distributed proportionally around the proposed survey area and captured in the photographs during the aerial photography. The camera orientation helps to obtain the parameter value for transforming terrain coordinates to image coordinate and vice versa (Schenk, 2005). The interior orientation is done to orient the projection center of the camera with respect to the image and set the equal principle distance to calibrate row and column of pixels with the principle point. Likewise, external orientation is done to determine the position of the projection center with respect to the ground and altitude of the sensor (Tempfli et.al, 2009).
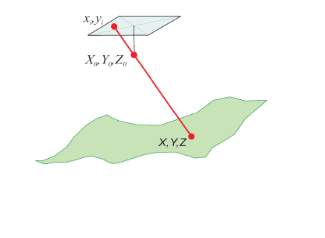
Figure 3‑2: Camera Orientation
(Source: ITC Education Series on remote sensing, 2009)
3.3. Interior oreination
“During the aerial surveys, the exterior orientation can be done in one of the following ways:
- Indirect camera orientation: Identify GCPs in the image and measure the row-column coordinates; acquire X, Y, Z) coordinates for these points e.g., by GPS or a sufficiently accurate topographical map; use adequate software to calculate the exterior orientation parameters, after having completed orientation.
- Direct camera orientation: make use of GPS and IMU recording during image-acquisition employing digital photogrammetric software.
- Integrated camera orientation, which is a combination both of above.”
(Tempfli et.al. 2009)
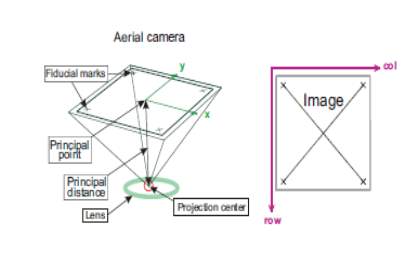
Figure 3‑3: Interior Orientation
(Source: ITC Education Series on remote sensing, 2009)
3.4. 3D Data Models for Aerial Survey
3.4.1. Stereographic Model
Stereographic model is the model that is a three dimensitional digital product perceiving through using both eyes (Punmia and Jain, 1992). Each human eye represents a single camera, when both the eyes view a same overlapping image from two different locations; perceive a stereo model of the image. The relative orientation of the two images orient one image with respect to the other image based on the terrain coordinates and the absolute orientation need to be done to orient the images accurately. For absolute orientation, at least three GCPs are needed, when the two images are perfectly modeled then the accurate transformation of the parameters for each images can be obtained, is called the aerial triangulation. The GCPs can be densified with aerial triangulation (Wolf, 1982).
The 3D data is also possible from a single image with respect to the GCPs fusion and the detailed information can be obtained by georeferencing with the digital terrain model (Punmia and Jain, 1992). Each pixel in the image is geocoded and after removing terrain relief displacement, a new product with a specific map projection can be obtained. This process of obtaining orthoimage is called as Monoplotting. In analogue method, big stereoplotters semi-automated machines (WildB8S and Kern PG-2) are used to obtain the stereomodel from two aerial photographs. Both the relative and absolute orientations play a vital role to get the required accuracy of the drawn map manuscript. In digital method (Leica Photogrammetric Suite, 2006), automation process is down with the help of computer software, the map manuscript obtained by the both methods need to subject for field verification to depict and identify the correct geospatial data (Dhakal, 2017).
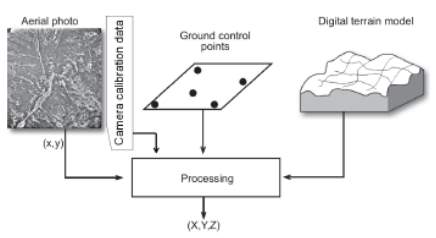
Figure 3‑4: The Process of digital plotting
(Source: ITC Education Series on remote sensing, 2009)
3.4.2. Hybrid Modeling
The 3D digital product of the aerial photo or imagery is prepared by the hybrid modeling, is possible due to technology development (Gilani and Wolf, 2014). Hybrid modeling is used to analyze the area-based automatic image matching by the combination of high resolution images. Aerial LiDAR and UAV data are used to match the images with the base images to obtain the required product. Because of the modeling, scope of the aerial survey is advancing, GNSS has been providing the continuous high precision coordinates, the dynamic data update faster in the big project helping people to finish the big project with high accuracy. Drone technology is another achievement in the aerial survey, has been helping to create a hybrid modeling in rescue mapping. Disaster mapping is another hybrid modeling, now, the trend analysis for future prediction is possible (Gilani and Wolf, 2014). The team noticed and cited the accuracy of the Drone Survey in data collection process based on the information session dated February, 06, 2017 at NAIT by the Challenger Geomatics, the presenter, Tim Harding P.Eng, ALS, CLS demonstrated about accuracy of the drone survey. According to Tim Harding, the accuracy of Drone Survey is 5cm over 90 m. On the basis of the cited data calculation, the team found the accuracy of the drone survey is 1:1800.
 International user groups started to get huge technological change in the aerial survey, analogue photogrammetry changed into the digital era in the 1990’s. In 1995, when Ohio State University hosted the First International Symposium on Mobile Mapping System collaboration with the International Federation of Surveyors (FIG) and the International Society for Photogrammetry and Remote Sensing (ISPRS), diversifies its scope and users’ communities got the information about the new development of LiDAR and other mobile mapping techniques (Schenk, 2005). Likewise, the 3rd Symposium set up the FIG Commission 5 on Mobile Mapping, The University of Calgary, the Egyptian Survey Authority, and Chinese National Lab for Information Engineering in Surveying as well as the big companies from USA, UK and Canada were the organizers. The purpose of the Symposium was to deliver a stimulating casual environment to promote scientific presentations, interactive discussions, and information exchange. FIG and ISPRS are the international professional organization, are working collaboratively with United Nations and National Mapping Agencies around the world (FIG, 2016). Since the start of Aerial Survey, different method were developed for collecting geospatial data or imageries by using Aircraft, Remote Sensing, LiDAR and using Unmanned Aerial Vehicle (UAV). Using Unmanned Aerial Vehicle, also known as drone, has made surveying and mapping tasks more effective, practice, and faster (Volkmann et.al. 2014).
With the new developments in surveying and mapping technologies, the conventional or the analogue map design approach is advancing. The change of analogue system of map-making to digital system is an example of such advancement. In aerial survey, analogue photography is also advancing to digital and also the users’ needs as well as the project requirement are changing, at the same time, the visualization techniques are also changing to fulfill the user needs accordingly (Kraak and Ormeling, 1996). The various digital solutions of the aerial survey practice for example application of UAV’s, LiDAR and mobile mapping are used to get the required products. The another development in the internet technology, the dynamic updates of the digital solutions of the geodata can displayed in the user’s personal mobile devices and robots. The product’s accuracy, spatial resolution of the geospatial data is advancing (Gilani and Wolf, 2014).
Furthermore, the quality control measures in the products such as Digital Terrain Model (DTM), Digital Elevation Model (DEM), and Digital Surface Model (DSM) are easy to justify. Data redundancies are also justified because of the knowledge discovery, and open source concept (Miller & Han, 2009). On this ground, “Aerial Survey: Analogue to Digital Solutions” has been chosen as the final technical project report.
4. Technological DevelopMent
 The technological development process started with analog photogrammetry, analytical photogrammetry, and digital photogrammetry in their current form, then LiDAR and laser scanning systems (Gilani and Wolf, 2014). They are discussed in brief below:
4.1. Analog Photogrametry
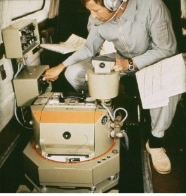
In analog photogrammetry, stereo plotting instruments showing in figure 4-1 and 4-2 are used; those are an optical instrument of high precision in which the spatial relationship of a pair of photographs at the instant of exposure is reconstructed. In such an instrument, the rays from the two photographs are projected and caused to intersect in its measuring space to from a perfect  stereo model of the terrain. A measured mark (floating mark); visible to the operator is used to measure the stereoscopic 3D model. The horizontal movement of the floating mark throughout the model is transmitted to a plotting pencil, which traced out the map position of the features appearing in the overlapped area of the two photographs forming the model (Punmia and Jain, 1992). A stereoscopic plotting instrument has four general components such as a projection system, a viewing system, a measuring system, and tracing system. In the topographical base map, eight different feature layers such as land use, buildings, roads, river and water bodies, contours, heritages and antiquities, administrative boundaries, and structures are traced with different color (Dhakal, 2017). An example of topographical base map of Kathmandu at scale 1:25,000 prepared by the analogue photogrammetry method is shown in the Appendix A.
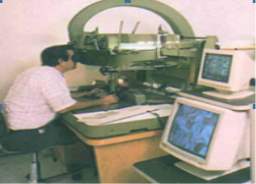
4.2. Analytical Photogrametry
 In analytical photogrammetry, analytical or softcopy stereo plotter is used; those plotters use the rigorous mathematical calculation of the ground coordinates of points using computers. All the data such as camera parameters, observed photo coordinates of the images of all points whose ground coordinates are to be determined, and GCPs are input. The operator wears polarized spectacles with corresponding polarity in the lenses so that the left can only see the left image and right eye can only see the right image. After completing the three stages of orientations, a floating mark is set on four corner GCPs then a map can be made from the model or cross-sections and other spatial information compiled. The contours are determined from the triangulated model and DEM is generated. The digital map is examined by field verification (Gilani and Wolf, 2014).
Figure 4-3: Analytical stereoplotter
(Source:www.slideshare.net/NaveenKumar173/photogrametry-1, n.d.)
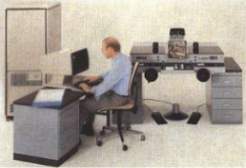
4.3. Digital Photogrametry
 In digital photogrammetry, softcopy plotter which is the latest development in the evolution of stereoscopic plotting instruments. The images acquired from digital aerial survey are used. Those plotters use the rigorous mathematical calculation of the ground coordinates of points using computers. All the data such as camera parameters, observed photo coordinates of the images of all points whose ground coordinates are to be determined, and GCPs are input. Once the operator views the 3D- stereomodel and operator moves the floating mark to depict the desired points in the stereomodel. Once the mark is set, the row and column location of the pixels at its location identify the photo coordinates of the point to the computer, which can then calculate its ground coordinates by solving the equations of analytical photogrammetry(Toschi, et. al, 2015), . The elevations are determined from the TIN model and Digital Terrain Model (DTM) of the ground as well as the required topo digital map can be generated (Carter, et.al. 2012). The digital map is examined by field verification (Gilani and Wolf, 2014).
4.4. LiDAR and Digital Scanning
LiDAR is the airborne laser scanning system, scanning device are carried in airborne vehicle with an inertial navigation system (IMU), a GNSS receiver and computer. As the air vehicle started to fly along the trajectory, laser pulses are transmitted towards the terrain below reflected from the ground and detect and record the height image. The IMU records the air vehicle altitude and momentum and GNSS receive determine the positions in the air with respect to the known GCP and compute the coordinates of all the ground points (Carter et. al., 2012). The recording capacity of laser pulses back and forth from scanner to ground is thousands and thousands. LiDAR provide the both the measurement of ground points and the top of the features at the same time so that it is also possible to generate DEM and DTM at the same time. The Accuracy of LiDAR survey is 10-15 cm and its accuracy is going increased as per the technological development (Gilani and Wolf, 2014). The figure below shows the LiDAR aerial survey (Tempfli et. al., 2009).
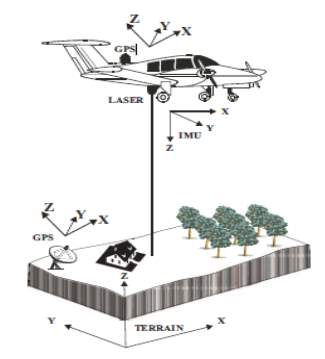
Figure 4‑1: Aerial Survey LiDAR
(Source: Tempfli et.al.2009.Principles of remote sensing, 4th Ed., pp 391)
5. Application of Aerial Survey
Aerial survey has dynamic applications the scope of which is always changing with new user requirements and advanced technologies (Gilani and World, 2014). Six among the major applications of serial survey are described below:
5.1. Topographical Basemap
As mentioned earlier in the introduction section that traditionally earth’s topography is graphically rendered by topographic maps. Today these topographic base maps are derived from data sets known variously as topographic framework data, geospatial core or foundation data (Groot &McLaughlin, 2000).
(Source: GEOGIS, 1997)
These encompass geodetic control data with it appropriate coordinate system, data related to build-up areas, hydrographic and infrastructures, DEM, administrative boundaries, postal codes and geographical names. The aerial survey is the primary source of collecting the geospatial data. The preparation of general topographic maps is largely in the hands of government organization. For example, in Canada, the Canada Centre for mapping and Earth Observation (CCMEO) is the center of excellence (NRCAN, 2013). In Nepal, Survey Department is the responsible national mapping agency has the responsibility to prepare, update and distribution of topographical base maps. The topo-maps are published in quadrangle sheets, which usually include territory ranging from 03’45” by 02’30” at scale of 1:25,000 to 30’ by 20’ at scale of 1:1,000,000(Survey Department, Triangulation Instruction Book, p30). A portion of a typical map, the scale of which is 1:25,000 is shown in Appendix B.
In the digital environment, the cartographer has the opportunity to use the offered zoom functionality so in order to prepare a small scale map need to apply a meaningful generalization. New updates in the GIS provide users to analyze; generalize and organize the geospatial data in between digital landscape model (DLM) and digital cartographic model (DCM) (Kraak &Ormeling, 2003, p77).
5.2. DTM and DEM Generation
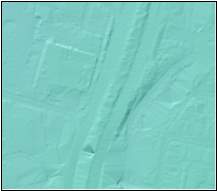
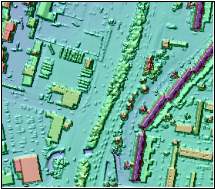 Digital technology has provided the opportunity to work with point cloud of the georeferenced geospatial features. LiDAR mapping collect million of data in short period of time, first returned laser beam collect the thousands of elevations per seconds, the isolated objects in the air such as birds and any other flying stuffs are not included during the mapping but include the vegetation, power lines and building. The highest object encountered by the LiDAR beam, is called as Digital Surface Model (DSM) in figure 5-3. Likewise, the last return of the beam from the bare earth that is the encountered beam to the ground, removing vegetation and building collect the different elevation model is called as Digital Terrain Model (DTM). The picture below taken from US Naval Academy describes the difference as follows. DSM is the model of the geospatial data which includes all the features and their position whereas DTM include the terrain model elevation with features location but they can be merged and analyze the required information (Gilani and Wolf, 2014).
5.3. Orthophoto prodcution
Aerial Photographs are taken by the Aerial Survey; those photos contain the effect of tilt and terrain relief error. The tilt is related with the verticality of the photo with its camera (optical axis) coinciding with the direction of gravity. If the photographs are truly vertical and the ground is horizontal, and if all other sources of errors are neglected, the scale of the photograph will be uniform, such a photograph represents a true orthographic projection and hence the true map of terrain. In the practice, such conditions are never fulfilled. When the ground is not horizontal, the scale of the photo varies from point to point and is not constant. Since the photograph is the perspective view, the ground relief is shown in perspective on the photograph. Every point on the photo is therefore, displaced from their true orthographic opposition. Such a displacement is called as the relief displacement. As shown in the figure below, the relief displacement (D) will be calculated as radial distance from Y (r*T) multiply by height of the ground above the mean sea level (M.S.L.) dividing by the difference between exposure height and height of the ground above the MSL (Punmia and Jain, 1992). The following assumptions can be derived by the definition of orthophoto.
- The Orthophotos are also called by Orthomaps and are the orthographic representation of the terrain in picture form. Scale variations and the image displacements due to relief and tilt are removed in the image and are shown in their true planimetric positions.
- Orthophotos are the combination of both aerial photos and line maps like photos, all the features are shown by their actual images rather than as lines and symbols thus it is more interpretable and understandable in terms of user’s perspective.
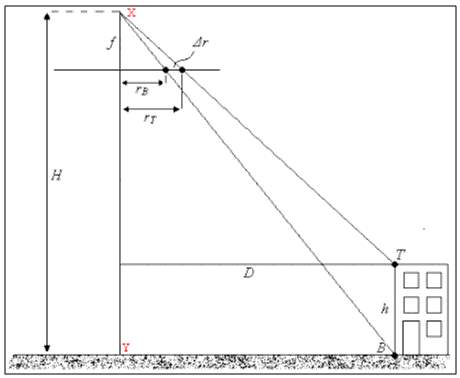
Figure 5‑2: Orthophoto Principle
(Source: http://www.seos-project.eu/modules/3d-models/3d-models-c02-p02-s01.html)
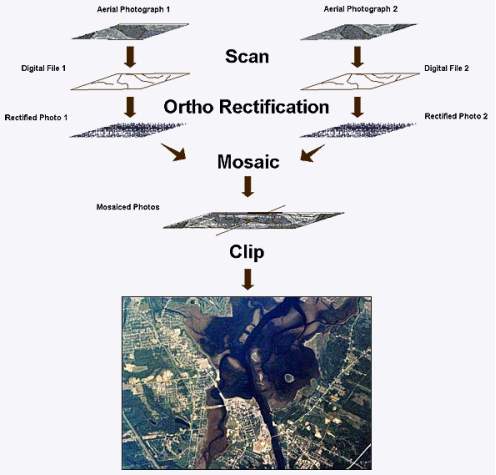
Figure 5‑3: Orthophoto map production
(Source: Softcopy Orthophotomap Data Base (SODB), New Brunswick, 2010)
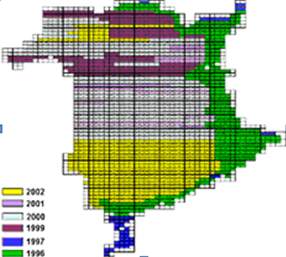
Figure 5‑4: Orthophoto Production Status at New Brunswick
(Source: Softcopy Ortho photomap Data Base (SODB), New Brunswick, 2010)
The combination of the rectified images (error free) and the DTM is used to derive the orthophoto, is also called as another value-added map, a photomap. The interior and exterior orientations of the images are performed by using the image processing software like ERDAS imagining. The oriented image is then georeferenced with the ground control points (GCPs), then, DTM of the assigned project area is overplayed with Image to produce an Orthophoto. This product is user friendly, is used for retrieving the various geospatial information (Kraak &Ormeling, 2003).
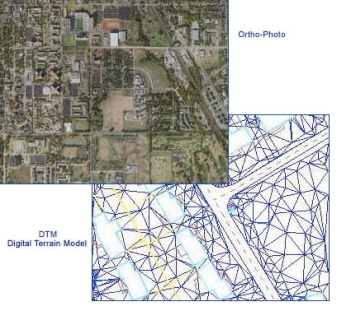
Figure 5‑5: Combination of Image and DTM
(Source: Softcopy Ortho photomap Data Base (SODB), New Brunswick, 2010)
5.4. Mobile Mapping
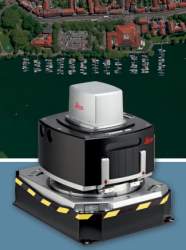
Mobile mapping the LiDAR scanning system is used on the ground based vehicles as shown in the figure below. Google Map uses such a technology to create the street level view on roads. One of the best scanners used in this system is Topcon IP-S3 HD1. This system surveys the continuous data which is controlled by the Mobile Master Office software. The 3D cloud data collected during the survey work is matched with the GCPs and the excellent data is visualized and utilized. The high definition laser scanner (30 megapixels) produces georeferenced panoramas. The Integrated duel frequency GNSS receiver and IMU constantly monitors the vehicle motion and altitude. Other advantage is the vehicle wheel encoder, which helps to enhance accuracy and reliability through the rotation of the wheel (Topcon, 2013). The example of application of the mobile mapping is the Google map street view facility in the Google Street –level view on the roads around the world (Gilani &Wolf, 2014).
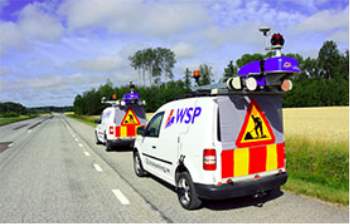
Figure 5‑6: Mobile mapping unit
(Source: WSP mobile mapping unit, Sweden, 2016)
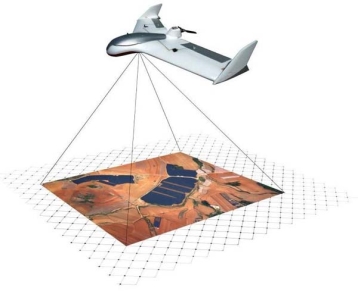
5.5. Unmanned Aerial Vehicle (UAV)
Unmanned aerial vehicle (UAV) is the aerial vehicle fly without a human pilot abroad above the ground in a certain height for collecting the ground information from the air. UAV used for mapping purpose is controlled by a remote human operator with a guided planning. The UAV commonly is known as the Drones. As explained in section 2.2, the latest UAVs is worked with RTK positioning and produce the 3D geospatial data cloud, and cloud-based information management facilities. Another option available in the Unmanned Aerial System (UAS) is the high speed imaging with 16 megapixels of mirrorless on board camera system, the GPS positions, and time are stamped in the images. “Data can be exported to third party-software to generate DEMS, Orthophoto, 3D models, 4D reconstruction, polygonal models and point cloud”(Topcon aerial mapping Solutions, 2014).
In the military purpose, UAV drones are used to destroy the enemy’s target. The drones are equipped with on-board IMU and RTK positioning with infrared camera and laser-guided munitions. Those UAV’s are downlinked to a control station as shown in the picture below (Steve, 2006).
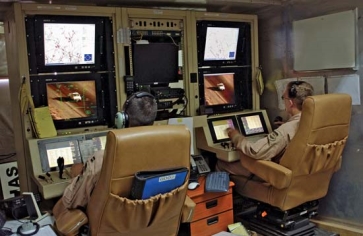
(Source: U.S. Air Force/AP, 2006)
5.6. Laser Scanning
Laser scanner (see Appendix A), is the modern automate digital 3D coordinate measuring reflector less sophisticated instrument. It collected thousands of observation information per second in digital image form. The technology behind this instrument is laser based EDM and the principle is same as terrestrial photogrammetry where the images are taken from a certain reference control point. The reference control points are established with high precise traversing and ties in the control monuments. The accuracy of laser scanner is ±6mm at 50 m and angular accuracy is 0.2” (Gilani & Wolf, Elementary Surveying pp.478-481).
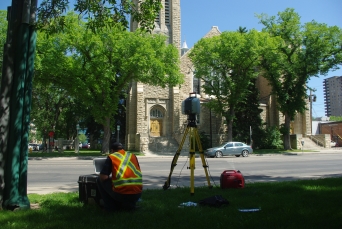
(Source: Stantec, 2016)
6. Future Applications
Newer and upcoming usage of survey technologies has been very interesting with the introduction of Unmanned Aerial Vehicles (UAV) and mobile mapping. Technological development relating to aerial survey has been providing a baseline for users to adopt the technologies as per their own requirements and customize the solutions as per their needs. Some of the modern and futuristic applications of aerial survey are enlisted below:
- Drone mapping is a project based digital mapping application use for quick and cost effective outputs (Gilani and Wolf, 2015).
- With the availability of modern high-end aerial cameras, surveyors are able to generate high-resolution images which can be directly used to interpret, analyze, and geo-visualize the rangeland application, archaeological application for locating lost monuments and tracking features, crop marks and parch marks to detect the irregularities in the crops pattern, discolorations in the crops as a result of prolonged drought, soil mark to outline the prehistoric features, urban studies, climate change, detecting the geological changes, ecological monitoring and management by analyzing the continuous changes in their trend (Rango, Laliberte , Steele,& Herrick, 2006).
- The combination of aerial survey with global navigation satellite system, photogrammetry, remote sensing and geographical information system has been facilitated the high-end product in geomatics engineering. Google Maps and Microsoft Maps can be taken as useful examples. These tools typically aid the end users in querying geo-spatial data for their business needs.
- Topcon Group UAS has designed technologies to produce more accurate solutions for the automated mapping of a wide range of sites. For example construction sites, mines and quarries, and for use in land surveying, power line and pipeline inspection as well as precision agriculture field mapping. UAS uses the real time kinematics instead of using the traditional ground control points and provide the more accurate mapping result with 2-5 cm accuracy. The system allows the operators to use a simple hand launch with precise automatic operation from take-off to landing, upgradeable and can be flown safely in nearly all weather conditions (Falcon, 2014).
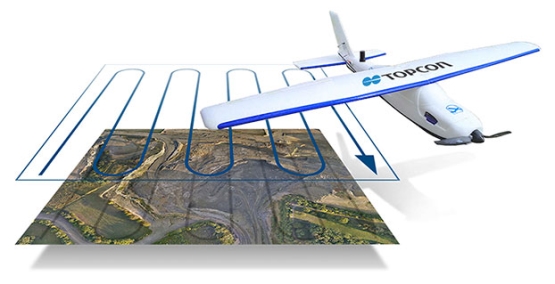
Figure 6‑1: UAS (Unmanned Aerial System)-Topcon Positioning Group
(Source: http://gpsworld.com/topcon-releases-new-uas-for-aerial-mapping,2016)
7. Findings and Recommendations
After the study of current and past surveying technologies, a need was seen to tabulate the features and applications of specific technologies. The following table illustrates the comparison of several survey mapping technologies:
Table 1: Findings of use of different aerial surveys and terrestrial surveys
| Types of Surveys | Image Scale | Accuracy/
Resolution |
Scope of mapping |
| Aerial photography | 1:5000 | ~20 cm | Topo-base map preparation |
| LiDAR | 1:5000 | 10-15 cm | Topo-base map preparation |
| Laser Scanning | 1:8000 | ±6mm @50m. | Project specific small area application |
| Drone mapping | 1:2000 | 5cm@90m. | Project specific mapping small area and patch-based projects |
| Types of Surveys | Image Scale | Accuracy/
Resolution |
Scope of mapping |
| Mobile mapping | 1:2000 | 3-5 cm | Street mapping, and other project specific mapping for continues data streaming application |
Based on the above table, as well as the studies done in the process of writing this report, the group provides following recommendations:
- It is suggested to use the latest aerial survey technology like airborne and space borne option for dynamic update of geographic information instead of relying on previous technologies and having to redo everything in a later project for more useful data.
- Certainty of aerial survey data can never be guaranteed. Thus, it is asked to look for the best possible way for analyzing the uncertainties in aerial survey.
- LiDAR and digital aerial images have accuracy of large scale topographical map so that those technologies are very suitable for any kind of mapping projects. They could be used in many applications.
- Drone has the accuracy of 1:1800 so that the output product will be prepared in centimeter accuracy and suitable for small area project based topographical mapping project making it very applicable for patch-based projects or small topographical projects.
- Census surveys are required to be updated at least in a decade interval, updating the geospatial data is also required in the regular basis of interval of 10 to 15 years because of its changing behavior as per certain interval of time. The aerial survey is found an appropriate method to collect those changing geospatial data or the new geographic data, once the data collection is done then the various semi-automated and automated software will be used to analyze and represent the geospatial data as per the user’s requirement.
8. Conclusion
This section portraits the overview of advancement in the aerial survey data, analog and digital data collection methods and technologies, how the new development in technology has been providing users remarkable opportunity to better understand geospatial relationships. As the scope of the aerial survey increased, geomatics professionals also have new challenges, requirement to be equipped with different kinds of soft-skills such as analyzing capability, uncertainty management, and use of technologies that is needed to know for handling specific projects.
One of the challenges with paper map environment was the high-cost and more manpower in gathering as well as updating the geographic data. Paper map’s counterpart were the digital and on-screen version of maps making process.
After the development of telecommunications technologies, the base-data produced by the national mapping agencies are used and shared with World Wide Web. This saves time, cost, and redundancy of work. Project-workers can focus on their business case instead of having to work on base data preparation etc. The laser technology combined with automated distance and angle measurements has reduced the estimation and position calculation error when collecting the geographic data, and collects the millions of 3D point data with images in short period of time. Also the use of multimedia has been providing the option of virtual solutions of the representation of geographic data. The combinations of internet and data streaming facilities have started the mobile mapping for representing geospatial data so that the trend analysis is possible.
The aerial cameras, stereo-plotters, EDM and theodolites etc. have been transforming into its portable outlooks with high-tech data recording, analyzing and disseminating facilities. The aerial survey has now become indispensable to our modern way of life (Gilani & Wolf, 2013). Aerial survey has the multi-dimensional capability to survey the earth above and below the sea level. The huge amount of themes and layers of information are possible because of the available geospatial data acquire by the various means of aerial survey such as Aerial Photography, LiDAR, Laser Scanning and Drone. At the same time, the concept of GIS developed in order to manage, analyze, present and share data that helps is saving time, cost and scrutiny the qualitative requirement.
Image data has the tremendous ability to explain additional information that everybody can understand promptly. The combination of raster and vector data representation as well as the use of multimedia has opened the various opportunities to make map more informative and understandable. This is a strong example of user’s usability perspective. A challenge in the application of different aerial survey technologies is the uncertainty of identification and choosing suitable technologies, and determine the level of accuracy needed based on what kind of maps product will be chosen for executing the project such as topographical base map, large scale high resolution map, digital terrain model, small area project based drone maps etc. Dissemination of geospatial data information via web is the need of today’ developed world various clearing houses and national geospatial data infrastructure are those initiatives. On this ground, different national mapping organizations, other mapping companies, and international professional organizations, United Nations organization in collaboratively has been working to produce the various theme based web map products in the context of increasing demands from the user community. Later on the main developmental concept and designing have also been exploited in the application of aerial survey. The phase wise discussion on the accuracy improvement along with technological development and its result oriented quick product capacity has helped to draw a better understanding of the concept of aerial survey in geomatics engineering. The vital role of the theme based maps in the effective dissemination of information has been realized.
This report therefore discussed the overall idea about conventional aerial survey and how the transformations into the digital era took place. It also talked about some new developments.
The findings from this report may be used by other scholars to enhance their knowledge about the surveying technologies, as well as to get an overview of how aerial survey has been creating positive interference to transform the conventional mapping procedure into analytical era and then the digital era with recent mobile mapping facilities to respond the geospatial data as per the user’s requirement.
References
Carter, J., Schmid, K., Waters, K., Betzhold, L., Hadley, B., Mataosky, R., & Halleram, J. (2012). Lidar 101: An introduction to LiDAR technology, data, and applications. NOAA Coastal Services Centre. Retrieved from
https://www.google.ca/webhp?sourceid=chrome-instant&ion=1&espv=2&ie=UTF-8#q=National+Oceanic+and+Atmospheric+Administration+(NOAA)+Coastal+Services+Center.+2012.+%E2%80%9CLidar+101%3A+An+Introduction+to+Lidar+Technology%2C+Data%2C+and+Applications.%E2%80%9D+Revised.+Charleston%2C+SC%3A+NOAA+Coastal+Services+Center.
City of Toronto (n.d.).Specification for aerial photography and photogrammetric services. Retrieved from
Https://wx.toronto.ca/inter/pmmd/callawards.nsf/8f833e980fde75cf85257a77004a025b/09087CF7DD92C23485257B03006916CA/$file/SPECIFICATIONS%20FOR%20AERIAL%20PHOTOGRAPHY%20AND%20PHOTOGRAMMETRIC%20SERVICES%202013.pdf). (n.d.)
Daponete, P.,Vito, L.D., Mazzilli, G., Picariello, F., Rapuano, S. A height measurement uncertainty model for archeological surveys by aerial photogrammetry (2016). Retrieved from
http://www.sciencedirect.com/science/article/pii/S0263224116306789
Digital Survey Solutions (2017), Midwest Survey. Retrieved from http://midwestsurveys.com/services/digital-survey-solutions/
Dale, P. & McLaughlin, J. (1999). Land administration. Oxford: Oxford University Press.
Guilmartin, J.F. (2015). Unmanned aerial vehicle (UAV).Retrieved form
https://www.britannica.com/technology/unmanned-aerial-vehicle
Geospatial Information Authority of Japan. (n.d.). Global Map | GSI Home page. Retrieved March 25, 2017, from http://www.gsi.go.jp/kankyochiri/globalmap_e.html
Huges,D.,Friker,P.,Chapuis,A.,Triversari,E.,Schreiber,P.,&Schapira,F.(n.d.).The development of photogrammetry in Switzerland. Retrieved from
http://www.wild-heerbrugg.com/photogrammetry1.htm
Lijian, Z., Zulong, L., Yingcheng, L., Yanli, X., Ming, L., Zhuolei, W., Pei, L., & Xiaolong, L. (2008). Application and analysis of airborne Lidar technology in topographic survey of tidal flat and coastal zone. Retrieved from
http://www.isprs.org/proceedings/XXXVII/congress/3b_pdf/50.pdf
Miller, H.& J., Han, J. (2009), Geographic data mining and knowledge discovery, (Second Edition). CRC Press Taylor & Francis Group, New York.
Olsen, M.J., Roe, G.V., Glennie, C., Persi, F., Reedy, M., Hurwitz, D., Williams, K.,
Tuss, H., Squellati, A., Evans, D., & Knodler, M. (2013). NCHRP 15-44 Guidelines for the use of mobile Lidar in transportation applications. Retrieved from
http://onlinepubs.trb.org/onlinepubs/nchrp/docs/NCHRP15-44_FinalGuidelines.pdf (case study)
Punmia, B.C., and Jain, A.K. (1992). Surveying Vol III, Laxmi Publications,New Delhi, India.
Rango A., Laliberte A., Steele C., Herrick J.E.Using Unmanned Aerial Vehicles for Rangelands: Current applications and future potential (2006).Retrieved from
https://www.cambridge.org/core/journals/environmental-practice/article/div-classtitleresearch-article-using-unmanned-aerial-vehicles-for-rangelands-current-applications-and-future potentialsdiv/C234D98DB6549CD4D3857B9F22D2CFFC
Schenk, T. (2005), Introduction to photogrammetry, (Autumn Quarter). Department of Civil and Environment Engineering and Geodetic Science, Ohio State University, Ohio.
Sheimy, N. E. (2001, January). Report on the Mobile Mapping Symposium. 3rd International Symposium on Mobile Mapping Technology, Cairo, Egypt. doi: January 3-5, 2001.
Schenk, T., (1999). Photogrammetry I. TerraScience, Laurelville pp.422.
S.K.Dhakal,(personal communication, March 09,2017)
Tempfli, K., Kerle, N., Huurneman, G.C., Janssen. L.F.C. (2009) Principles of remote sensing (4th Ed.). ITC studies series. Retrieved from
https://www.itc.nl/library/papers_2009/general/principlesremotesensing.pdf
Toschi,P., Rodriguez, G., Remondino, F,]., Minto, S., Orlandini, A. (2015). Accuracy evaluation of a mobile mapping system with advanced statistical methods. The International Achieves of the Photogrammetry, Remote Sensing and Spatial Information Sciences, Vol.Xl-5/W4, 3D virtual reconstruction and visualization of complex architectures , 25-27 February 2015, Avila, Spain Retrieved from
http://www.int-arch-photogramm-remote-sens-spatial-inf-sci.net/XL-5/W4/245/2015/isprsarchives-XL-5-W4-245-2015.pdf
Survey Department of Nepal (1976). Triangulation instruction book, His Majesty’s Government of Nepal, Geodetic Survey Branch, Kathmandu.
Volkmann, W. & Barnes, G. (2014). Digital surveying: mapping and modeling cadastral boundaries using Unmanned Aerial Systems (UAS), FIG proceedings. Retrieved from
http://www.fig.net/resources/proceedings/fig_proceedings/fig2014/papers/ts09a/TS09A_barnes_volkmann_7300.pdf
Wolf, P., (1980). Elements of Photogrammetry, McGraw Hill Book Co, NY pp 10.
Appendix A
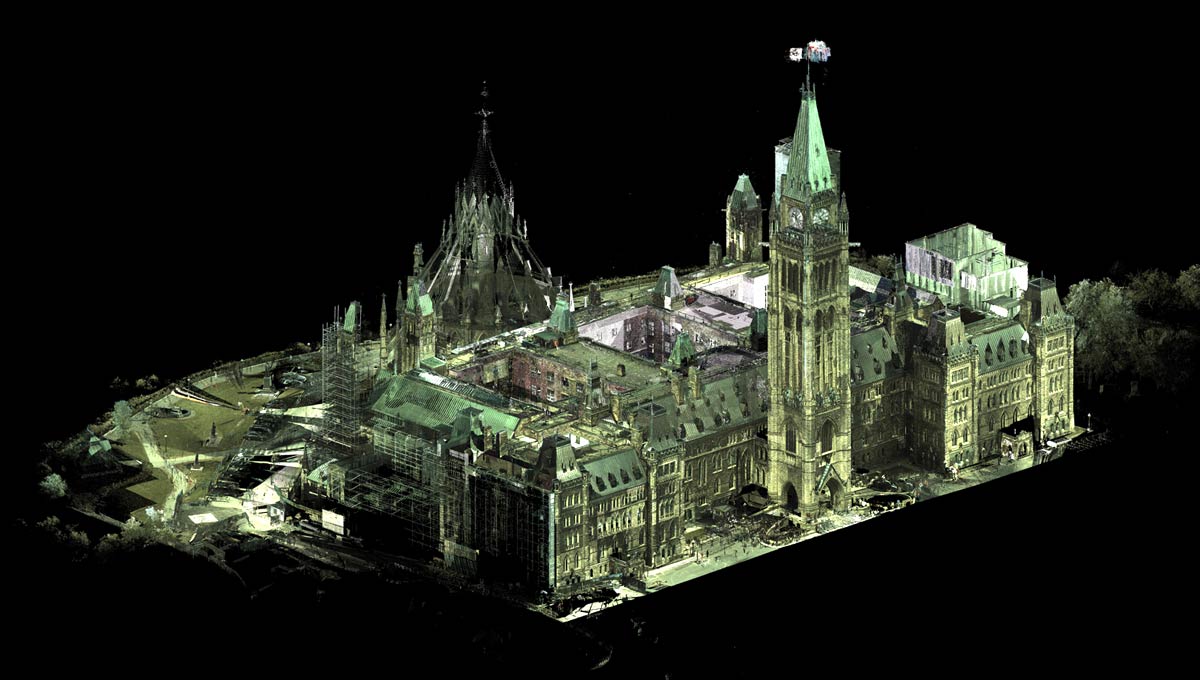
Appendix A: Laser Scanning and Photogrammetry
(Source: Carleton University, 2016)
Appendix B
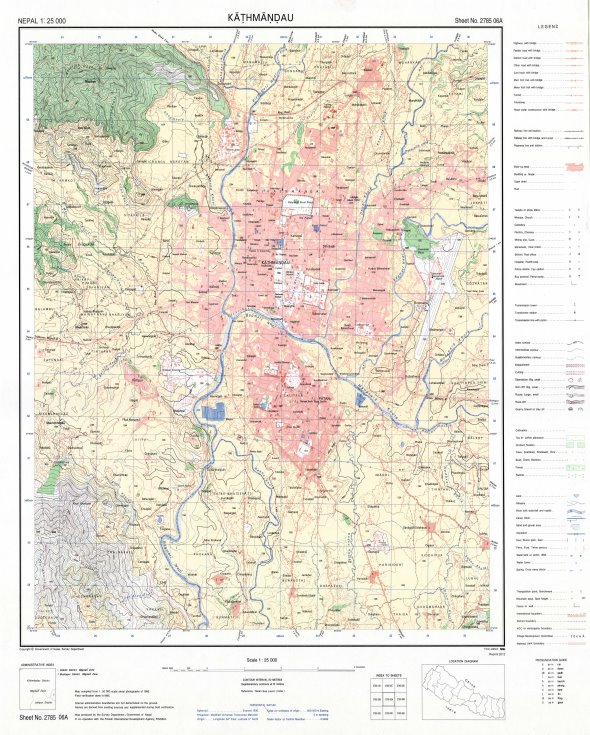
Appendix B: Topographical Base map of Capital of Nepal Kathmandu, Sheet No: 2785-06A
(Source: Survey Department of Nepal, 2017)
Appendix C
CHINA
INDIA

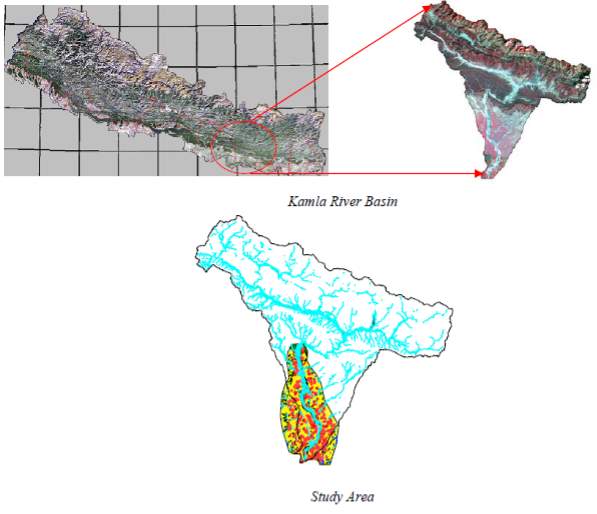
NEPAL
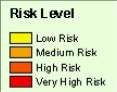
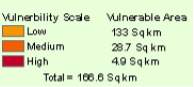
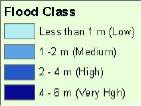
Flood Risk Assessment:
- About 150,000 people affected by 10 year flood
- 167 Sq.km area affected by inundation
Cite This Work
To export a reference to this article please select a referencing stye below:
Related Services
View all


Related Content
All TagsContent relating to: "Technology"
Technology can be described as the use of scientific and advanced knowledge to meet the requirements of humans. Technology is continuously developing, and is used in almost all aspects of life.
Related Articles

DMCA / Removal Request
If you are the original writer of this dissertation and no longer wish to have your work published on the UKDiss.com website then please: