Feasibility of an Active All-Wheel Steering System for the BR-17 Brunel Racing Car
Info: 11592 words (46 pages) Dissertation
Published: 5th Jan 2022
Tagged: EngineeringAutomotive
Abstract
This aim of this report is to decide the feasibility of implementing an active all-wheel steering system in the BR-17 Brunel Racing car for use in the Formula Student competition. Using MATLAB to perform complex simulations to determine performance benefits if any are present as well as allowing calculation of whether the performance is substantial enough to outweigh to drawbacks of such a system. A comprehensive literature review and background of previous and current all-wheel steering systems used on and off the racing track. The proposed system would function in-phase (front and rear wheel’s steer in the same direction) to increase corner stability and agility, through the use of MATLAB simulations I was able to calculated the performance benefits of such a system and through analysis of my results it was determined that an active all-wheel steering system is feasible for the BR-17 car.
Table of Contents
Click to expand Table of Contents
Table of Abbreviations
Table of Symbols
List of Figures
Section 1: Introduction & Literature Review
1.1 Aims and Objectives
1.2 Benefits of All-Wheel Steering
1.3 Past and Present All-Wheel Steering Systems
1.4 Consumer, Commercial and Racing Applications
1.5 Steering Geometry
1.5.1 Ackerman Geometry Method
1.5.2 Instantaneous Centres Method
1.6 Analysis of Steering Forces
1.6.1 Front Steering Forces
1.6.2 Rear Steering Forces
1.7 Steering Trail
1.7.1 Mechanical Trail
1.7.2 Pneumatic Trail
1.9 Previous Formula SAE Rear-Wheel Steering System
Section 2: Background Information
2.1 Formula SAE Competition
2.2 Formula SAE Dynamic Events
2.2.1 Autocross Event
2.2.2 Endurance Event
2.2.3 Skip-Pad Event
2.3 History of Brunel Racing
Section 3: Project Methodology
3.1 Software Packages
3.1.1 Siemens LMS Virtual Lab Software Package
3.1.2 MATLAB
3.2 Steering Geometry Analysis
3.3 Steering Forces
3.3.1 Defined Variables
3.3.2 Load Transfer Forces
3.3.3 Rear Motor Torque
3.3.4 Rear Tie-Rod Forces
3.3.5 Steering Input Force
3.4 Design of an All-Wheel Steer System
Section 4: Results & Discussion
4.1 Steering Geometry Analysis
4.2 Steering Force Analysis
4.3 Proposed All-Wheel Steering System
4.3.1 Steering Actuator
4.3.2 Steering Rack
4.3.4 Chosen Control System
4.4 Feasibility of Proposed System
Section 5: Conclusion
Section 6: Suggestions for Further Work
Section 7: References and Appendix
6.1 References
6.2 Appendix
Abstract
My project was to investigate the feasibility of an active all-wheel steering system for the BR-17 racing car. Due to the BR-17 car not being built yet my calculations were based upon the current car but my MATLAB scripts can be altered to obtain simulated performance once the dimensions for the BR-17 are set. During the project I did a thorough background search on existing systems in the consumer, commercial and racing world with the latter having the least content due to the system often being seen as a driver aid which are quite often forbidden.
Various attempts to bring all-wheel steering have been implemented in the consumer world by many major manufacturers (Porsche, BMW, Toyota, Nissan, Audi etc.) often consisting of both out-of-phase and in-phase functionality depending on the speed of the vehicle. In the commercial world construction trucks have benefitted from an out-of-phase (front and rear wheels steering in the opposite direction) low speed system to effectively shorten the wheelbase allowing a tighter turning circle. The proposed system would function in-phase (front and rear wheels steer in the same direction) to increase corner stability and agility, through the use of MATLAB simulations I was able to calculated the performance benefits of such a system and through analysis of my results it was determined that an active all-wheel steering system is feasible for the BR-17 car.
Table of Abbreviations
| Abbreviation | Full Title |
| AWS | All-Wheel Steering |
| 2WS | Two-Wheel Steering |
| CoG | Centre of Gravity |
| FEA | Finite Element Analysis |
| CAD | Computer Aided Design |
| UK | United Kingdom |
| ECU | Electronic Control Unit |
| FSAE | Formula Society of Automotive Engineers |
| SAE | Society of Automotive Engineers |
| IMechE | Institution of Mechanical Engineers |
| SI | Spark Ignition |
| HICAS | High Capacity Actively-controlled Suspension |
| IC | Instantaneous Centre |
| LUT | Look-up Table |
Table of Symbols
| Symbol | Definition | SI Unit |
| δf | Total Front Steering Angle | Degrees (°) |
| δr | Total Rear Steering Angle | Degrees (°) |
| δif | Inner Front Steering Angle | Degrees (°) |
| δof | Outer Front Steering Angle | Degrees (°) |
| δir | Inner Rear Steering Angle | Degrees (°) |
| δor | Outer Rear Steering Angle | Degrees (°) |
| δInner Total | Total Inner Steering Angle | Degrees (°) |
| δOuter Total | Total Outer Steering Angle | Degrees (°) |
| δTotal | Total Vehicle Steering Angle | Degrees (°) |
| αf | Low-Side Slip Angle | Degrees (°) |
| αr | High-Side Slip Angle | Degrees (°) |
| L | Vehicle Wheelbase | Metres (m) |
| m, W | Vehicle Mass | Kilograms (kg) |
| R,r | Turning Radius | Metres (m) |
| C1 | Distance from IC to Front Axle | Metres (m) |
| C2 | Distance from IC to Rear Axle | Metres (m) |
| wf | Front Track | Metres (m) |
| wr | Rear Track | Metres (m) |
| ξ | Front to Rear Steering Angle Ratio | |
| g | Gravitational Acceleration | Metres per second m/s2 |
| a2 | Centre of Gravity (CoG) to Rear Axle Distance | Type equation here. |
| R1 | Distance of IC and Vehicle Axis | Type equation here. |
| v | Vehicle Velocity | Metres per second (m/s) |
List of Figures
Click to expand List of Figures
Figure 1. Vehicle turning right at less than 20mph (left) and Vehicle turning right at more than 20mph (right)
Figure 2. Comparison of Methods for Front/Rear steer angles (Nissan Motor Co. Ltd., n.d.)
Figure 3. Response and Stability ratings for Front/Rear steer angles (Nissan Motor Co. Ltd., n.d.)
Figure 4. Out of phase turning geometry of an all-wheel steer vehicle (Gillespie, 1992)
Figure 5. Steering angles position of instantaneous centre for turning radius (Lohith, et al., 2013)
Figure 6. SAE Tire Force and Moment Axis System (Gillespie, 1992)
Figure 7. Forces and moments acting on a right-hand road wheel (Gillespie, 1992)
Figure 8. Mechanical and Pneumatic Trail (Gillespie, 1992)
Figure 9. Two Degree of Freedom Bicycle Model (O’Kane & Timoney, 2004)
Figure 10. FSAE Skid-pad Layout (SAE International, 2015)
Figure 11. BR-16 Brunel Racing Car at Brunel’s 50th Anniversary Event
Figure 12. Steering Geometry Variables
Figure 13. The distance from the IC of the rear wheels to the rear axle (eq. 2), the inner front steering angle and both the front (C_1) and rear (C_2) IC’s for each event code
Figure 14. Outer Front, Inner Rear, Outer Rear, Total Front Steering Angles and Front Steering Ratios for each event code
Figure 15. Rear Steering Angles Code
Figure 16. All-Wheel Steer Radii Code
Figure 17. Steering Force Analysis Variables
Figure 18. Load Transfer Code
Figure 19. Rear Motor Torque Code
Figure 20. Outer Rear Steering Force Code
Figure 21. Steering Input Force Code
Figure 22. Rack and Pinion System (Torque Monkeys, 2015)
Figure 23. Rack and Pinion Close-up (Encyclopaedia Britannica, 2015)
Figure 24. Rear Steering Motor Torque Required During a Corner after Deceleration
Figure 25. Rear Steering Force Required Under Total Acceleration
Figure 26. Steering Input Force Required to turn Front Wheels Under Total Acceleration
Figure 27. Motor Performance Characteristics (TQ Group, 2006)
Figure 28. Zedaro zRack 262 Specifications (Zedaro, 2016)
Figure 29. Zedaro zRack 262 Schematic (Zedaro, 2016)
Figure 30. Block Diagram for All-wheel Steer System
Figure 31. Steering Geometry Code Page 1
Figure 32. Steering Geometry Code Page 2
Figure 33. Steering Geometry Code Page 3
Figure 34. Steering Geometry Code Page 4
Figure 35. Steering Forces Analysis Page 1
Figure 36. Steering Forces Analysis Page 2
Figure 37. Steering Forces Analysis Page 3
Figure 38. Steering Forces Analysis Page 4
Section 1: Introduction & Literature Review
Traditionally vehicles have been steering via the front wheels and the front wheels alone, it’s a simple and effective system that provides excellent manoeuvrability whilst maintaining stability at both high and low speeds. But despite the various types of front wheel steering systems available, there is always a limit to what can be achieved with only the front wheels providing the steering of the vehicle. In order to get past these limitations, engineers began researching the idea of utilising the rear wheels to assist in the steering process. All-wheel steering has come about several times throughout consumer and commercial vehicle history with the original consumer debut courtesy of Nissan Motor Co. in 1985, despite the idea originally being patented in 1907.
This system was known as HICAS (High Capacity Actively-controlled Suspension) and differed greatly from the original patent. The initial patent did not incorporate active control over the rear wheels for steering and instead utilised a passive system which linked the front and rear wheels via a shaft with a fixed ratio of front steering angle to rear steering angle. The addition of steering input from the rear wheels allows greater control and agility of the vehicle which can be useful in all types of vehicles (Consumer, Commercial and Racing). Due to rules and restrictions steering via the rear wheels has been limited in racing scenarios but competitions such as Formula 1 have experimented with such a system despite it never being implemented, Formula SAE is a student based racing competition and as of 2015 the FSAE Rules and Regulations T6.5.5 “Rear wheel steering, which can be electrically actuated, is permitted but only if mechanical stops limit the range of angular movement of the rear wheels to a maximum of six degrees (6°)”. (SAE International, 2015)
All-wheel steering has been proven to increase the responsiveness of a vehicles handling by ways of “better control of transient behaviour in cornering”, yielding a quicker response with better camping of the yaw oscillation with the initiation of cornering. (Gillespie, 1992)
1.1 Aims and Objectives
The aim of this project is to look into the feasibility and design of a bespoke rear-wheel steering system to be implemented in the BR-17 Brunel Formula Student Racing car and whether it will improve the performance of the car.
The project objectives are as follows:
- To establish whether a rear-wheel steering system and its components can be packaged into the BR-17 car
- Discuss whether the complexity of the system could cause reliability issues and lead to increased maintenance due to calibration
1.2 Benefits of All-Wheel Steering
The benefits of utilising the rear wheels to steer in addition to the front has been discussed for decades as to whether the benefits are substantial enough to implement into today’s vehicles. The commercial world has adopted all-wheel steering systems due to the reductions it brings to turning circles of large vehicles when the front and rear wheel are operated out of phase with each other, this particular use-case has transitioned to consumer vehicles but in limited capacity with only a handful of manufacturers implementing all-wheel steer systems and usually as expensive options that due to their uncommon nature are rarely picked by consumers when the car is ordered.
The all-wheel steering options available on current and some previous consumer cars utilise a speed adaptive steering system where at low speeds the rear wheels are turned out of phase to the front wheels resulting in a shorter turning circle (allowing larger vehicles to behave like or better then smaller vehicles) as shown below in Figure 1, this is extremely useful in scenarios such as parking or manoeuvring around the tight spaces usually found in car parks. At higher speeds (20mph or above) this would result in an “oversteer influence” (Gillespie, 1992) so the rear wheels are steered in phase with the front wheels, to allow greater stability. Also shown in Figure 1, when the rear wheels are in phase with the front wheels both at angled in the same direction albeit the rear wheels operate at a much lesser angle simply assisting the front wheels and allowing the front wheels to provide the main steering force.
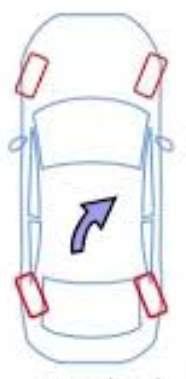
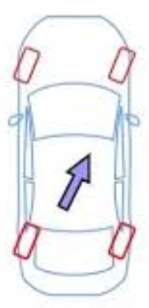
Figure 1. Vehicle turning right at less than 20mph (left) and Vehicle turning right at more than 20mph (right)
1.3 Past and Present All-Wheel Steering Systems
Originally patented in 1907, the idea for AWS by which the front and rear steering mechanisms were connected via a shaft. Unfortunately, it wasn’t feasible to implement into consumer vehicles until 1985 where advanced analysis of vehicle dynamics allowed Nissan to develop the first generation HICAS system. This system incorporated the above method shown in Figure 1 with out-of-phase operation at low speeds to effectively reduce the wheelbase which allows a tighter turning circle while improving ability to park in tight spaces and in-phase at higher speeds to improve cornering stability whilst improving agility. HICAS utilises active control of the front and rear wheel steering angles through the use of an electric motor.
The development of HICAS lead to Nissan creating a simulator vehicle in which further testing could be accomplished, through development and testing with this simulator vehicle Nissan created the second generation HICAS known as “Super HICAS” which had several enhancements over the original system such as utilising “phase reversal control” which allows the system to respond based on driver input giving a more natural feeling to cornering whereas the first generation system suffered from unusual sensations while driving leading to a lack of confidence in the system by consumers. (Nissan Motor Co. Ltd., n.d.)
Several systems have been tested by Nissan before they introduced rear-wheel steering into their consumer products. These systems are (Proportional control, First-order delay control, Phase reversal control and Front/rear wheel control), the performance of these systems are shown in Figure 2 and 3.
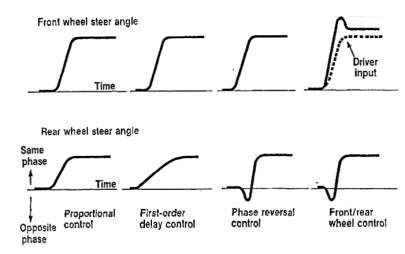
Figure 2. Comparison of Methods for Front/Rear steer angles (Nissan Motor Co. Ltd., n.d.)
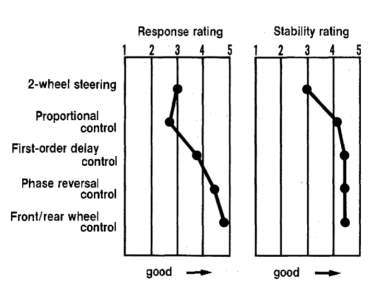
Figure 3. Response and Stability ratings for Front/Rear steer angles (Nissan Motor Co. Ltd., n.d.)
From the figures above we can see that even a basic rear-wheel steering system provides a definitive increase in vehicle stability despite causing a decrease in the response rate for the vehicle, something that is rectified with the more advanced systems were vehicle response is increase significantly. The differences between these different systems is as follows:
- Proportional control: While the vehicle is in a transient state the sideslip angle at the vehicles centre of gravity is produced in the opposite direction of a typical steering system which can feel unusual to the driver resulting in a lack of confidence in the system. During stead-state operation the sideslip angle is reduced
- Delay control: This method reduces the sideslip angle that is generated in the opposite direction while the vehicle is in a transient state but it also has the added effect of an improvement in response of the vehicles direction
- Phase reversal control: This system almost completely removes the sideslip angle generated in the opposite direction during transient conditions while greatly improved the response I the direction of the vehicles turn.
- Front/rear wheel control: This method includes the active control of the front wheels to reduce any response delay and resonance peaks in both lateral acceleration and yaw rate. The end result is that the vehicle is much easier to manoeuvre due to its increase in responsiveness and stability.
1.4 Consumer, Commercial and Racing Applications
Rear wheel steering systems have long been used in commercial vehicles, with the primary focus being to reduce the effective wheelbase of large vehicles that have to operate in varying degrees of space such as construction vehicles. In these commercial applications the focus is almost always on low speed movement rather than high speed cornering stability, therefore the rear wheels turn out of phase with the front wheels to provide a narrower turning circle allowing more manoeuvrability in tight spaces. Modern advances have progressed the commercial rear steering for HGV’s by utilising active and dynamic rear wheel steering with response based on speed, allowing for greater manoeuvrability at low speeds whilst providing greater stability at higher speeds.
With regards to racing, rear wheel steering has never had much of a presence, mainly due to rules and regulations interfering with additional components and classifying such a system as a driver aid, something top racing competitions frown upon to increase the effect of driver skill. A rear wheel steering system was trialled shortly in Formula 1 by Michael Schumacher in 1993 where the Benetton team were testing a new ‘C’ version of the Cosworth B193 featuring a “hydraulically operated rear steering rack”. This system utilised Moog electro-valves to alter the rear wheel steering angles up to 2 degrees left or right, with fail-safes to default to straight in the event of a malfunction. Drivers were also able to turn off the system at will to allow comparison between the addition of rear steering and the conventional front-steering system, a featured utilised by Schumacher due to him preferring the conventional system.
His comments were:
“It feels very good, but actually it doesn’t change things a lot. I am using the same lines and there isn’t a lot of movement at the rear. It makes it a little easier, but right now the system doesn’t work very well in the slow corners, so we might not use it in Adelaide.”
Despite their best efforts the Benetton team were unable to find any meaningful advantage to utilising a rear-wheel steering system meaning the FIA’s decision to ban all-wheel steering under the section of “driver-aids”. (Collantine, 2007)
1.5 Steering Geometry
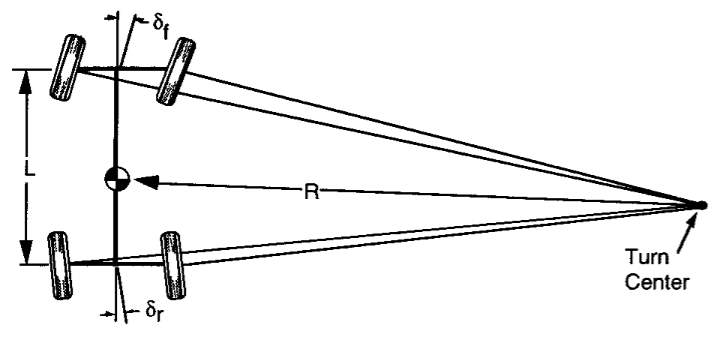
Figure 4. Out of phase turning geometry of an all-wheel steer vehicle (Gillespie, 1992)
Steering geometry plays a major role in the design of a car’s steering system, analysing the steering angles allows the performance of the vehicle to be simulated. There are two methods for determining steering geometry is Ackermann’s Theory with a directly proportionate relationship between front and rear steering angles (Gillespie, 1992) or by utilising the instantaneous centres method (Lohith, et al., 2013).
1.5.1 Ackerman Geometry Method
δr=ξδf
δf+δr=δf+ξδf=δf1+ξ=LR Ackerman Angle
∴ R=Lδf1+ξ (eq. 1)
These equations provide a way to reduce a vehicle’s turning radius by utilising rear wheel steering. The reduction would allow lesser centrifugal force whilst allowing an increase in centripetal force contributing to higher corner speed then simple utilising a conventional front only steer system. The setup for this system is demonstrated in Figure 1 where at low speed the wheels turn out-of-phase with each other (opposite direction) and at higher speeds the wheels turn in-phase with each other (same direction). The reasoning for this is due to out-of-phase causing oversteer at higher speeds resulting in less corner stability. (Gillespie, 1992)
1.5.2 Instantaneous Centres Method
Unlike the Ackerman method, (Lohith, et al., 2013) uses the instantaneous centres of each wheel along with the vehicles centre of gravity to determine the gravity.
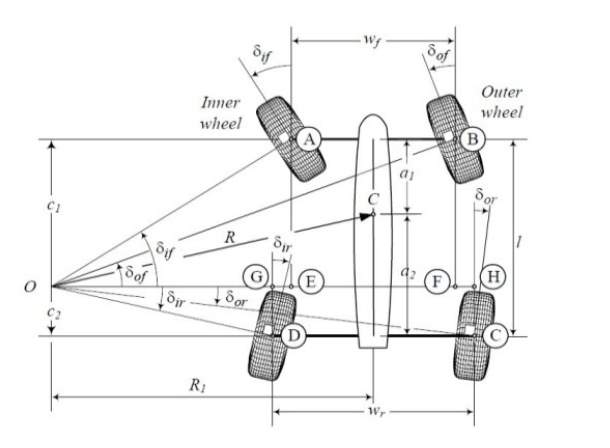
Figure 5. Steering angles position of instantaneous centre for turning radius (Lohith, et al., 2013)
R2=a22+R12 (eq. 2)
Wf=W.a2L (eq. 3)
Using the above equations both
a2 and
R1 can be found for a given turning radius, R.
The method further analyses steering angles, the inner front steeting angle, δif are obtained via simulation or physical analysis but the other steering angles can be obtained via the following equations.
tanδif=C112R1-wf (eq. 4)
C1+C2=L (eq. 5)
tanδir=C212R1-wr (eq. 6)
Using
eq. 4 and
eq. 5 the value of
C1 and
C2 can be determined allowing all other vehicle steering angles to be calculated using eq.4 for front steering angles and eq. 6 for rear steering angles.
This above analysis is for a traditional front wheel steering system for a given turning radius whereas the below analysis allows the comparison of 2WS and AWS for a given turning radius.
R2=a22+L2cot2δ (eq. 7)
cotδ=cotδi+cotδo2 (eq. 8)
Utilising the above equations, a comparison can be made between 2WS and AWS for a given turning radius along with an ability to compare various rear steering angles, allowing the ability to perform optimisation of the rear steering system. It is important to note that a new IC is created for any change in steering angle requiring re-analysis. This analysis provides the basic geometry for an AWS system, due to the aforementioned optimisation procedure a mathematical model can be used to calculate the optimal setup for an AWS system. Unfortunately, this analysis assumes perfect steering which is not a real world scenario and as such adjustments must be made in physical experimentation of the vehicle in order to ensure that the perfect steering assumption does not have a negative effect on performance of the AWS system.
1.6 Analysis of Steering Forces
The forces experienced by a steering system must be calculated in order to design a system that can function correctly in operation, thus analysis of these forces must be performed. This analysis is shown below in section 1.6.1 and 1.6.2 where the equations have been derived from the application of Newton’s 2nd Law to particular components of Figure 6, whilst considering the cornering, normal and longitudinal forces shown in Figure 7.
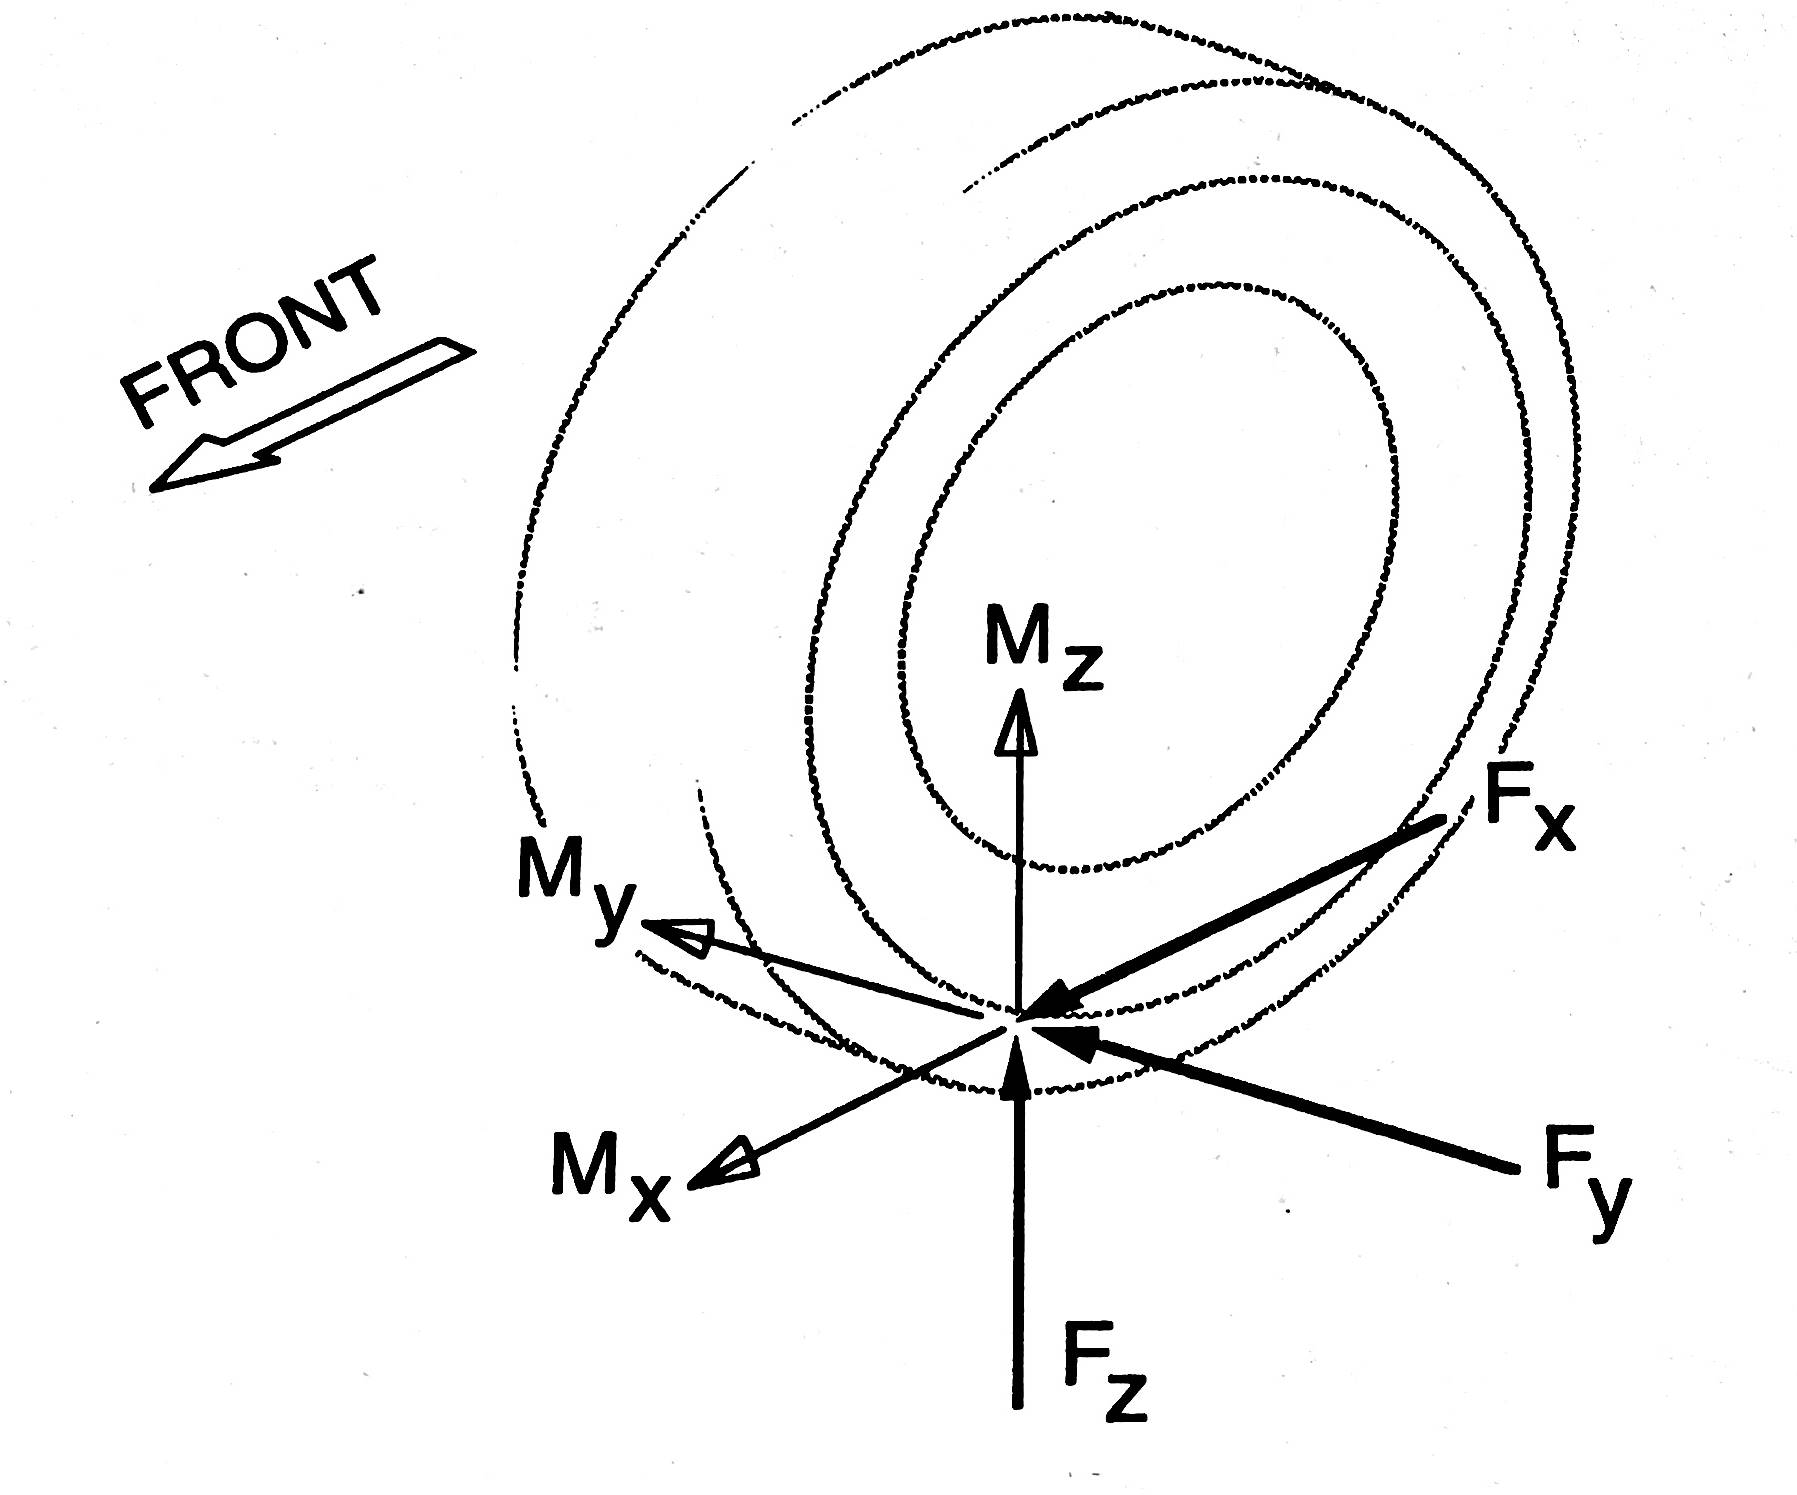
Figure 6. SAE Tire Force and Moment Axis System (Gillespie, 1992)
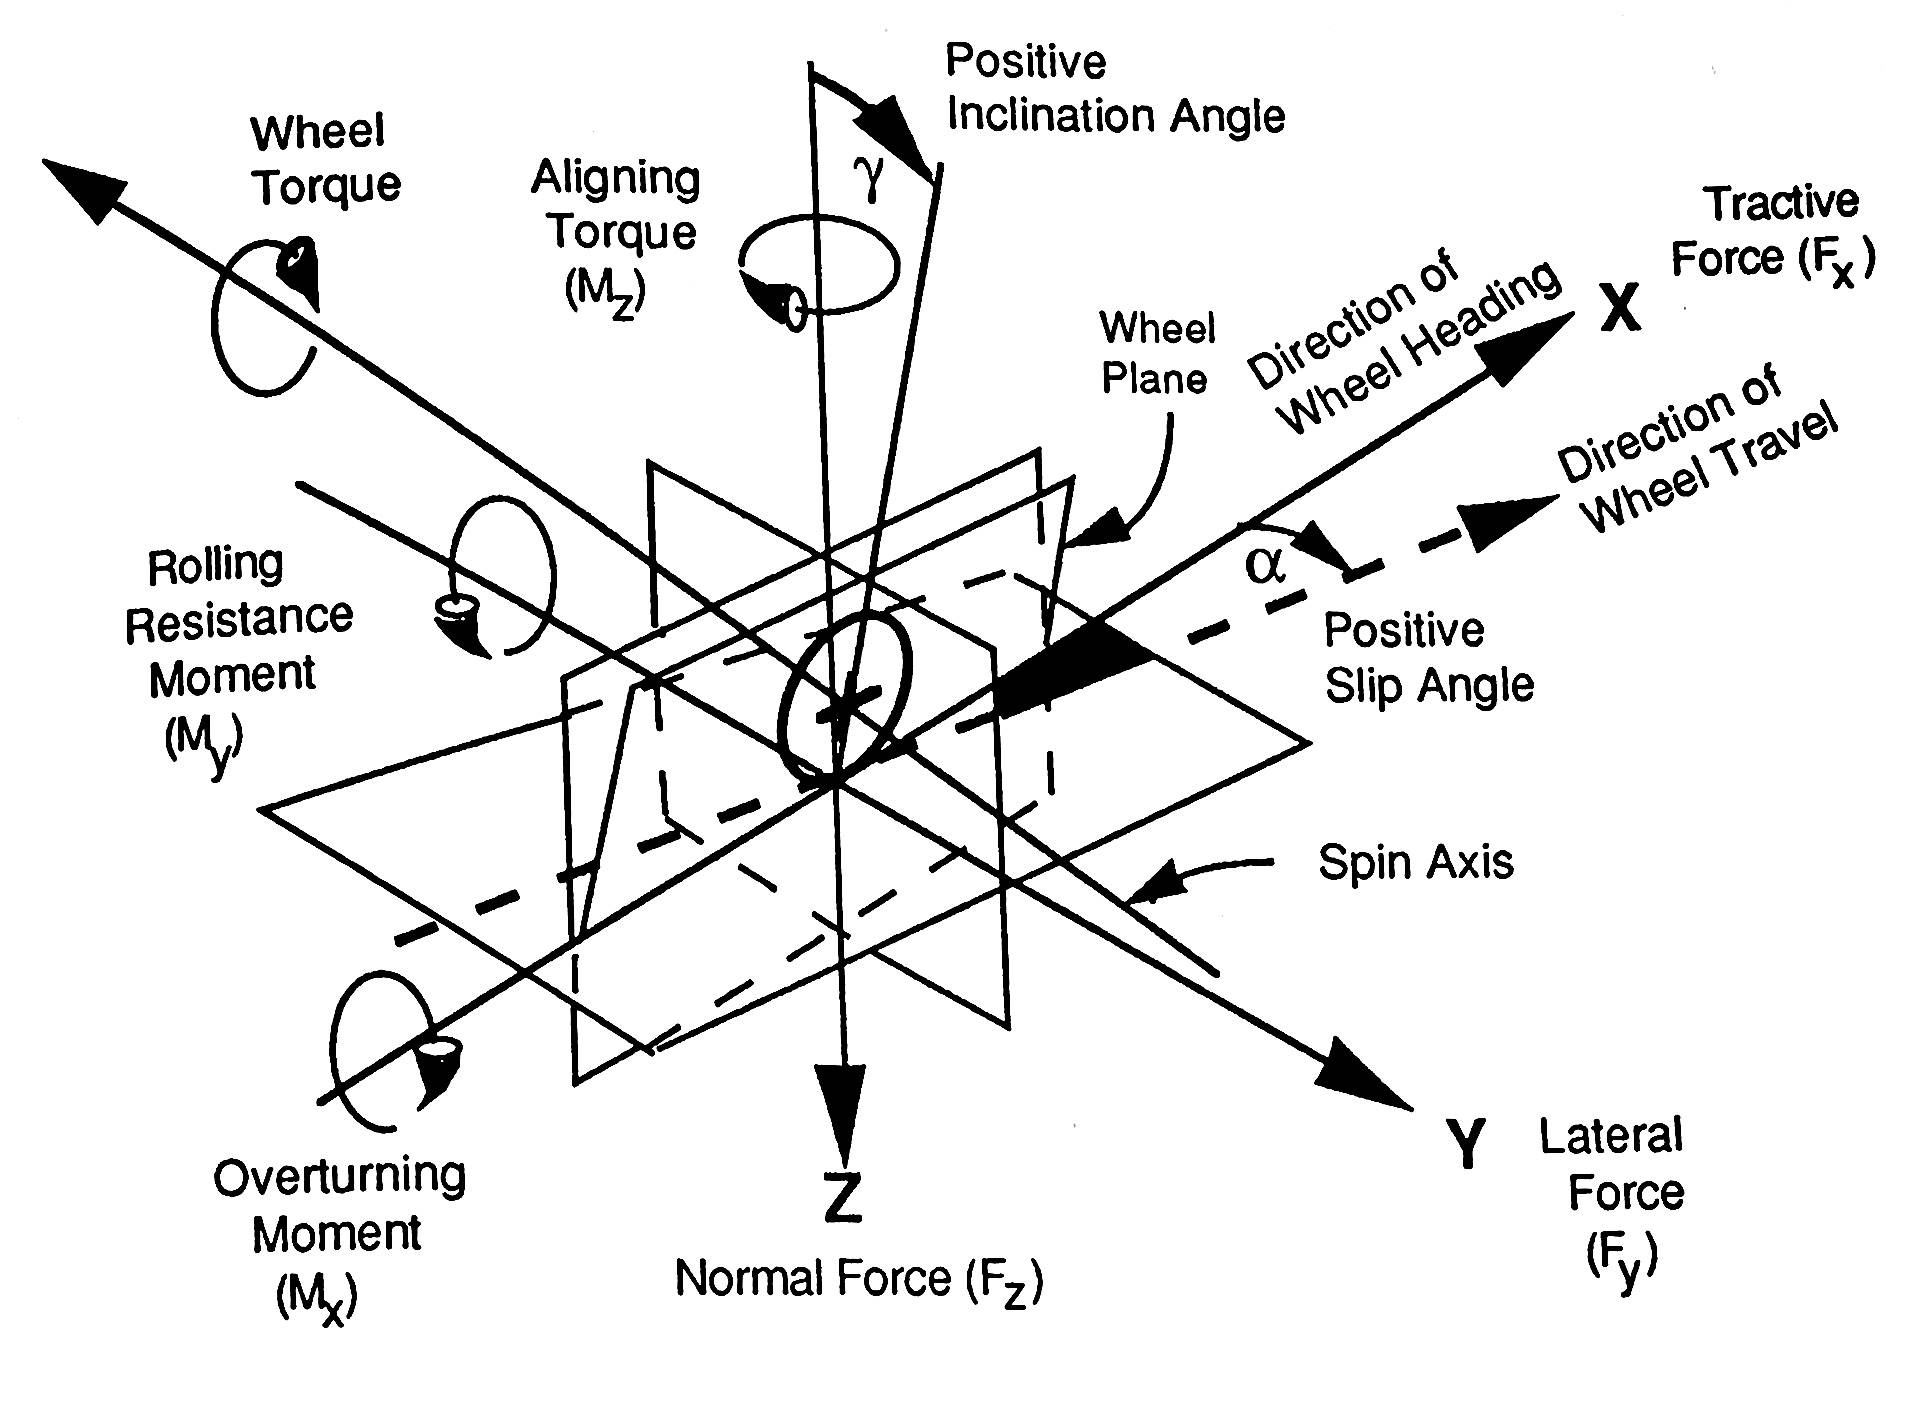
Figure 7. Forces and moments acting on a right-hand road wheel (Gillespie, 1992)
The below equations are taken from a technical paper and can be expanded upon by reading (Bedner, 2004).
1.6.1 Front Steering Forces
FZf=MgWDFL+MaxhL
FZf out=FZfwf2+Mayh(WDF)wf
FZf in=MgWDF-FZf out
FYf vehicle=May
%Yf out=FZf outMg
%Yf in=FZf inMg
FYf out=(FYf vehicle)(FYf out %)
FYf Tie-Rod=(FYf out)(Front Steering Torque) Front Steering Arm Length
FYf Pinion=(FYf Tie-rod)(Df Pinion)2
FYf Wheel=2(Tf Pinion)Ds
1.6.2 Rear Steering Forces
FZr=Mg1-WDFL+MaxhL
FZr out=FZrwr2+Mayh(1-WDF)wr
FZr in=Mg1-WDF-FZr out
FYr vehicle=May
%Yr out=FZr outMg
%Yr in=FZr inMg
FYr out=(May)(FYf out %)
FYr Tie-Rod=(FYr out)(Rear Steering Torque)Rear Steering Arm Length
FYr Pinion=(FYr Tie-rod)(Dr Pinion)2
FYr Wheel=2(Tr Pinion)Dm
1.7 Steering Trail
There are two different types of steering trail. Mechanical and Pneumatic, which when combined are known as the steering torque. The below figure shows the mechanical and pneumatic trails with the tyre slip angles.
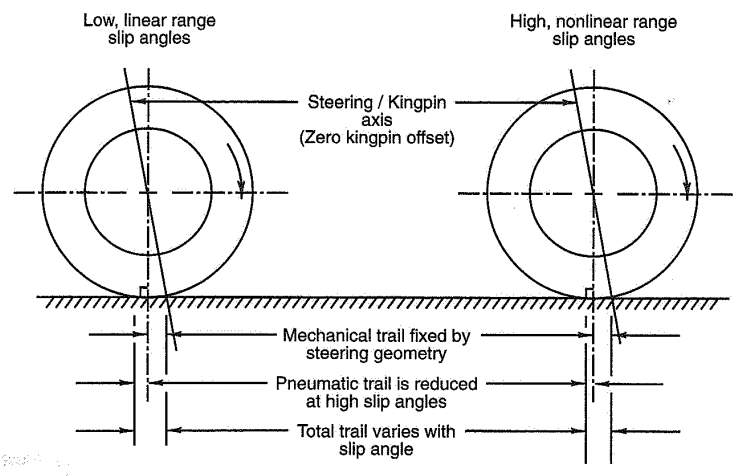
Figure 8. Mechanical and Pneumatic Trail (Gillespie, 1992)
1.7.1 Mechanical Trail
Mechanical trail is introduced through the castor angle for the steering axis, this results in a displacement at the tyre’s contact patch. During the design stage of vehicle development, a kingpin geometry is decided upon meaning the mechanical train remains constant during the operation of the steering system through various angles, tyre side-slip and load.
1.7.2 Pneumatic Trail
Pneumatic Trail, also known as Aligning Torque is a torque and is defined as the distance from the contact patch’s centre to the centre of the cornering force acting upon the tyre, it is possible that the force generated by the tyre is related to the slip angle of the tyre.
1.9 Previous Formula SAE Rear-Wheel Steering System
An algorithm was developed by students at the University College Dublin for a four-wheel steering system for a Formula SAE car, this algorithm was based upon a speed dependant all-wheel steering system. Without discussing the actual equations and coding will not be provided but can be obtained in the report by (O’Kane & Timoney, 2004).
MATLAB and Simulink software packages were utilised by using the bicycle method as shown below in Figure 11.
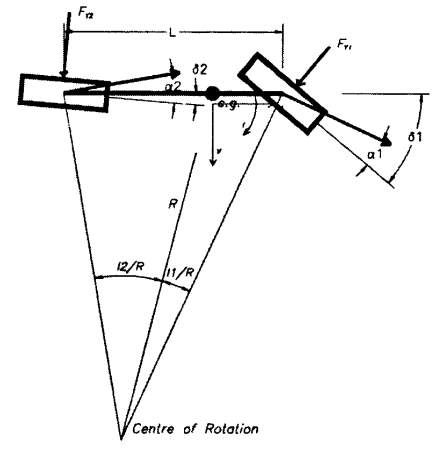
Figure 9. Two Degree of Freedom Bicycle Model (O’Kane & Timoney, 2004)
This linear method of modelling is very popular when researching and developing all-wheel steering systems, this simplified model was used to develop an optimisation algorithm to optimise the vehicles yaw response. (O’Kane & Timoney, 2004) also created a 3D model using the DADS software, this model included the non-linear components such as tires, body roll and weight transfer. This project provides a starting point for any Formula SAE team looking to apply all-wheel steering to their car, considering the same simulations that every team has to use for the FSAE competition were used. These models and algorithms for an all-wheel steering system resulted in an optimised yaw response that improved the stability of the vehicle, whilst also acknowledging that direct yaw control has the potential to further improve vehicle stability.
Section 2: Background Information
The purpose of this section is to provide knowledge on the FSAE competition itself and what it entails, as well to highlight the history of the Brunel Racing team.
2.1 Formula SAE Competition
Formula SAE, also known as Formula Student is an annual competition run by SAE. With the first competition in 1979 after Mark Marshek contacted SAE in 1978 to discuss the addition of a ‘Mini Indy’ event. Organising the event is no small feat, a realisation many organisers’ found the hard way resulting in no events in 1980. This failure led to a handful of University of Texas students approaching Dr. Ron Matthews with the idea to run another ‘Mini-Indy’ but with a more open rule structure to allow the competition to advance engineering to new heights, previous competitions allowed a lot of progress for chassis design but students were anxious to work on engines as well and so the new rule scheme kept engine restrictions to the bare minimum with any four-stroke engine allowed for the first four years with nothing by a 25.4mm intake restriction to limit the power output.
Formula SAE is designed to emulate a ‘fictional manufacturing company’, one that has contracted a team of students to design and develop a race car to be evaluated for it’s potential for real production. The target marketing group is the non-professional weekend autocross racing enthusiast. Teams in the competition design, build and tests their prototypes based upon a set of rules in order to promote clever problem solving whilst providing students with a practical approach to engineering and physical experience that can never be gained through lectures and seminars. This project covers all aspects of engineering from research and design to manufacturing, testing, development and even marketing, management and financing, giving students a real-world look on engineering and increase their value to engineering companies for their future careers.
The competition has been largely successful with operation now at an international level and for comparison sake in the USA alone 1981 there were 6 registered teams whereas in 2015 there were 120 registered teams. (SAE International, 2015)
2.2 Formula SAE Dynamic Events
Formula SAE consists of several dynamic events:
- Acceleration
- Skid Pad
- Autocross
- Efficiency
- Endurance
These events put the submitted vehicle to the test to ensure that they have been correctly designed, each test results in a score and every team strives for the highest score. Due to the nature of this project the focus will be on 3 of the 5 events, Acceleration and Efficiency don’t have any relation to the steering system and an improvement in vehicle cornering capabilities will not affect these events.
2.2.1 Autocross Event
The objective of the autocross event is to evaluate how manoeuvrable the car is and put its handling performance to the test on a tight course without competing cars getting in the way of pushing the car to its limits. Acceleration, braking and cornering are all evaluated in one event.
The following specifications are set for this event:
- Average speed: Should be between 40km/hr (25mph) and 48 km/hr (30mph)
- Straights: No longer than 60 m (200 feet) with hairpins at both ends (or) no longer than 45m (150 feet) with wide turns on the ends.
- Constant Turns: 23 m (75 feet) to 45 m (148 feet) diameter.
- Hairpin Turns: Minimum of 9 m (29.5 feet) outside diameter (of the turn).
- Slaloms: Cones in a straight line with 7.62 m (25 feet) to 12.19 m (40 feet) spacing.
- Miscellaneous: Chicanes, multiple turns, decreasing radius turns, etc. The minimum track width will be 3.5 m (11.5 feet).
The length of each run will be approximately 0.805 km (1/2 mile) and a driver will complete the specified number of runs.
2.2.2 Endurance Event
The endurance even is designed to evaluate the car’s overall performance while testing its durability and reliability.
The following specifications are set for this event:
- Average Speed:Should be between 48 km/hr (29.8mph) and 57 km/hr (35.4 mph)
- Top Speed: Approximately 105 km/hr (65.2 mph)
- Straights: No longer than 77.0 m (252.6 feet) with hairpins at both ends (or) no longer than 61.0 m (200.1 feet) with wide turns on the ends. There will be passing zones at several locations.
- Constant Turns: 30.0 m (98.4 feet) to 54.0 m (177.2 feet) diameter.
- Hairpin Turns: Minimum of 9.0 m (29.5 feet) outside diameter (of the turn).
- Slaloms: Cones in a straight line with 9.0 m (29.5 feet) to 15.0 m (49.2 feet) spacing.
- Miscellaneous: Chicanes, multiple turns, decreasing radius turns, etc. The standard minimum track width is 4.5 m (14.76 feet).
2.2.3 Skip-Pad Event
The skid-pad event is designed to measure the car’s cornering capability on a flat surface while making a constant-radius turn.
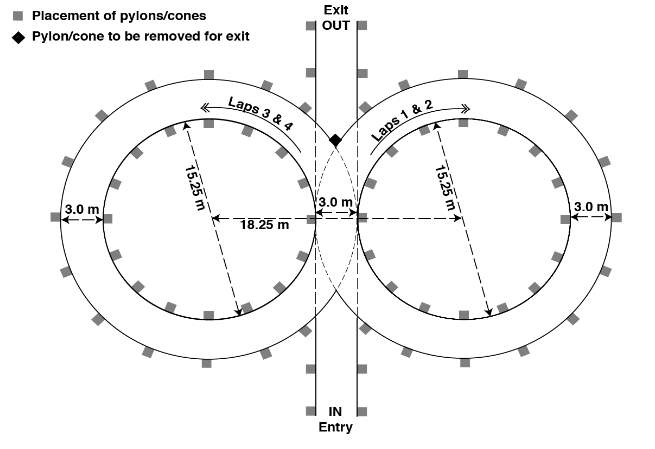
Figure 10. FSAE Skid-pad Layout (SAE International, 2015)
As shown in Figure 9 on the previous page, the skidpad has the following layout:
“There will be two (2) pairs of concentric circles in a figure of eight pattern. The centers of these circles will be 18.25 m (59.88 feet) apart. The inner circles will be 15.25 m (50.03 feet) in diameter, and the outer circles will be 21.25 m (69.72 feet) in diameter. The driving path will be the 3.0 m (9.84 feet) path between the inner and outer circles. The cars will enter and exit through gates on a 3.0 m wide path that is tangential to the circles where they meet. The line between the centers of the circles defines the start/stop line. A lap is defined as traveling around one (1) of the circles from the start/stop line and returning to the start/stop line.” (SAE International, 2015)
2.3 History of Brunel Racing
Brunel University annually takes part in the Formula SAE competition with its student built vehicle, originally operating a one-year cycle where a new car was built from scratch every year which has now been changed to a two-year cycle. Allowing third year students to get involved with the beginning stages of the new car and then carry on developing that car into their master’s year. Building and producing a race ready car in less than 12 months has proven to be very difficult in the past due to the Brunel Racing team consisting of student’s with assignments and other work to do and resulted in less the ideal performance in the FSAE competition, the new two-year cycle will allow Brunel Racing to achieve their potential and hopefully lead to better performance in the FSAE competition.
Brunel students do all of design and building in-house unlike some teams where various parts are outsourced to professional companies, this allows students to get invaluable lot of hands on experience in designing and building the car providing vital experience for their future roles as engineers. In 2005 the Brunel Racing team won the FSAE Class Two Competition and in 2006 an FSAE award for Best Virtual Development. (Brunel University, 2006)
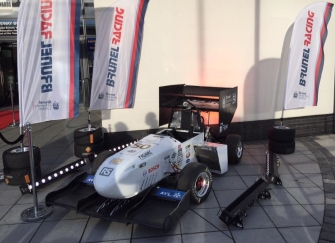
Figure 11. BR-16 Brunel Racing Car at Brunel’s 50th Anniversary Event
Section 3: Project Methodology
This section will contain the methods in which testing was performed and explain how results will be obtained for analysis and discussion in Section 4.
3.1 Software Packages
3.1.1 Siemens LMS Virtual Lab Software Package
The LMS Dads application contained within this software package would have allowed creation of a 3D model to simulate steering geometry in a more meaningful way then by using MATLAB alone. Unfortunately, this software package was not available due to cost.
3.1.2 MATLAB
Utilising the MATLAB software package a set of scripts were created in order to simulate and compare the performance the current front-wheel steer system to an all-wheel steer system, along with calculate forces to be overcome by the entire steering system with emphasis on rear steering forces in order to choose suitable components for said system.
3.2 Steering Geometry Analysis
Using the MATLAB script in Appendix pages iii-vi analysis of the steering geometry for both front-wheel steer and all-wheel steer. The results from this script will provide the comparison and performance advantages in terms of the three FSAE events for the proposed all-wheel steering system.
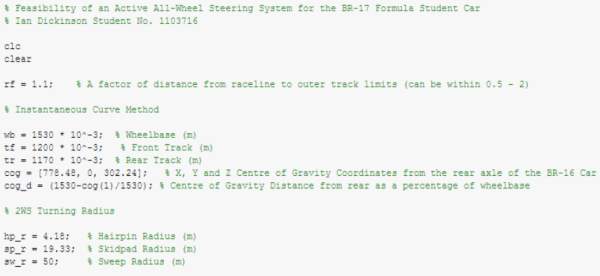
Figure 12. Steering Geometry Variables
The code shown in Figure 12 defines the vehicle parameter’s required to calculate the steering geometry, the current system’s Hairpin, Skid-pad and Sweep test radii were also included to be compared with later in the report. The raceline factor variable is defined as a multiplier factor to control how close or far a car is to the apex/wall of a track, varying this number between 0.5 and 2 allows optimisation of the steering system to be performed.
The next step in determining the steering geometry is to calculate the distance from the IC of the rear wheels to the rear axle (eq. 2), the inner front steering angle and both the front (C1) and rear (C2) IC’s for each event. This is shown in the figure below.
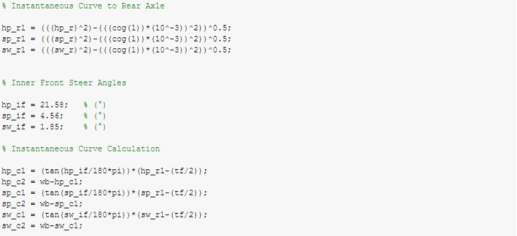
Figure 13. The distance from the IC of the rear wheels to the rear axle (eq. 2), the inner front steering angle and both the front (C_1) and rear (C_2) IC’s for each event code.
Then, the inner and outer steering angles for both the front and rear wheels is to be determined along with the total front steering angle and the inner to outer front steering ratio as shown below.
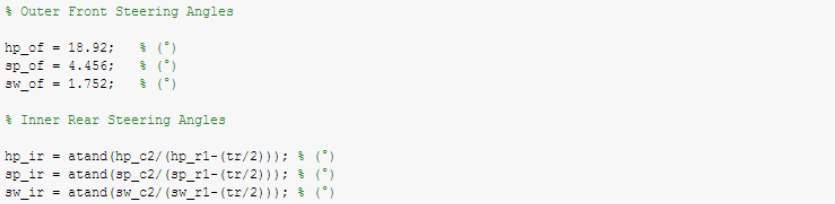

Figure 14. Outer Front, Inner Rear, Outer Rear, Total Front Steering Angles and Front Steering Ratios for each event code
As discussed by (Lohith, et al., 2013), the next stage of his IC method is to use the front steering angle as the rear steering angle which for simulation purposes is adequate despite the limitation of a maximum rear steering angle of 6° (SAE International, 2015). The below script shows how the Rear Steering Angles are to be simulated with the FSAE limit only being reached during the Hairpin event.
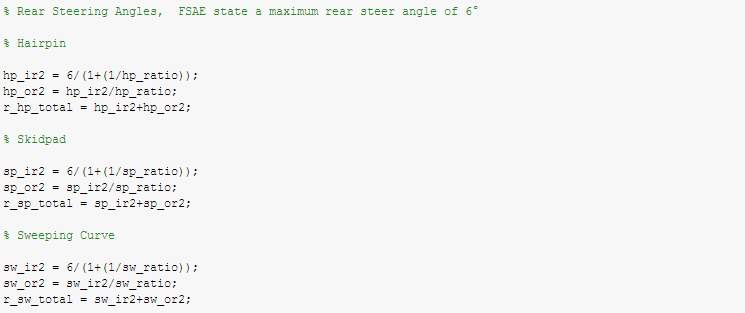
Figure 15. Rear Steering Angles Code
Last but not least, the total inner and outer steering capability is to be determined along with the combined total vehicle steering capability (eq. 8). The AWS turning radius from (eq. 7) and the percentage reduction in turning radius when compared to the existing 2WS system.
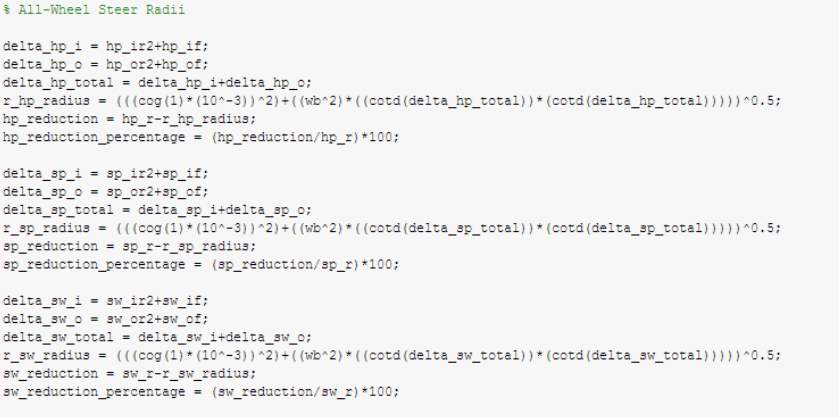
Figure 16. All-Wheel Steer Radii Code
This script can be modified to alter the results allowing AWS and 2WS comparing and performance simulation for any FSAE vehicle constrained by the 6° limit which can also be altered should FSAE rules change in the future or for another competition etc.
The results of this script can be found in Section 4 of this report.
3.3 Steering Forces
The last simulation to be performed is that of calculating the forces experienced by the steering system along with what a proposed AWS system would have to overcome allowing suitable components to be chosen. Once again MATLAB has been used to simulate this via a script due to its efficiency and capabilities to analyse in both the 2D and 3D domains. Steering input force will also be calculated to determine whether an AWS system provides any benefits in terms of driver exertion to perform the FSAE events, something that can prove important in any long duration events or tracks consisting of many turns where performance is often lost due to driver fatigue.
3.3.1 Defined Variables
The below figure shows the vehicle parameters required to calculate the steering forces whilst also providing a way for the script to be modified for a different vehicle.
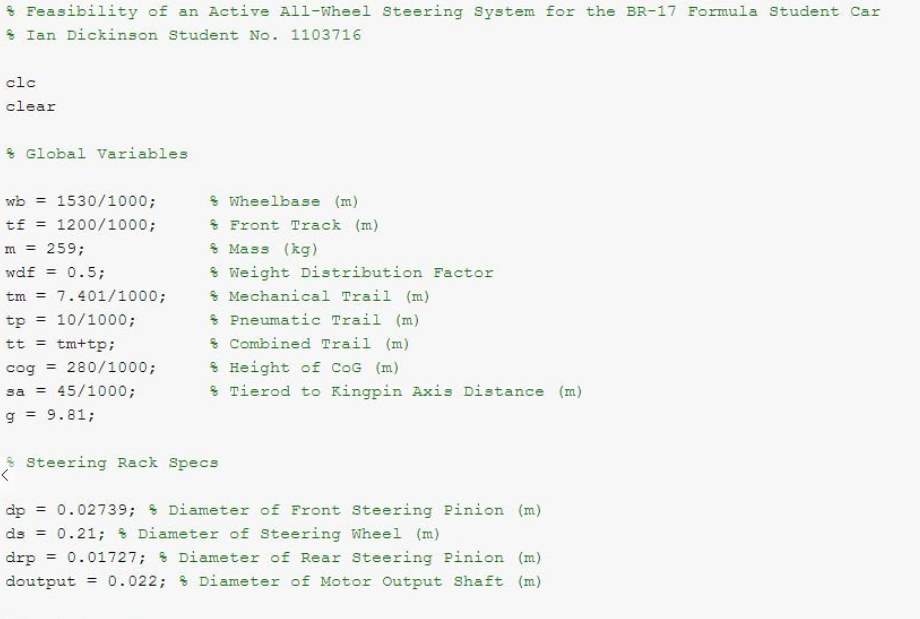
Figure 17. Steering Force Analysis Variables
All of the above variables can be altered to obtain different results depending on the use-case.
3.3.2 Load Transfer Forces
The figure below serves to demonstrate the MATLAB script created to model the forces described in Section 1.6, using the method described by (Gillespie, 1992). Load Transfer show the forces acting upon the steering system and have been modelled for differing load and acceleration conditions that have been determined appropriate for the FASE events.
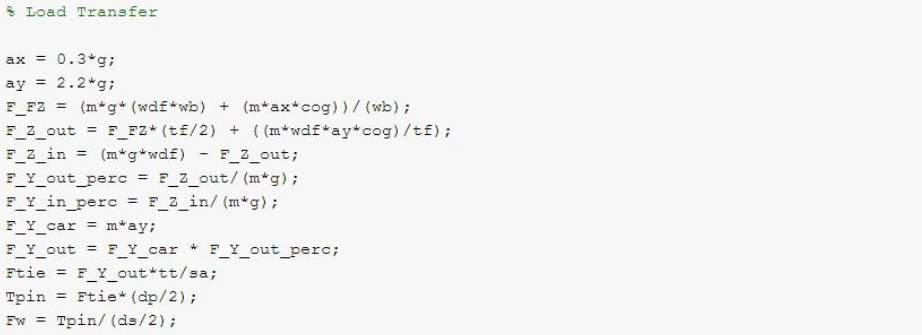
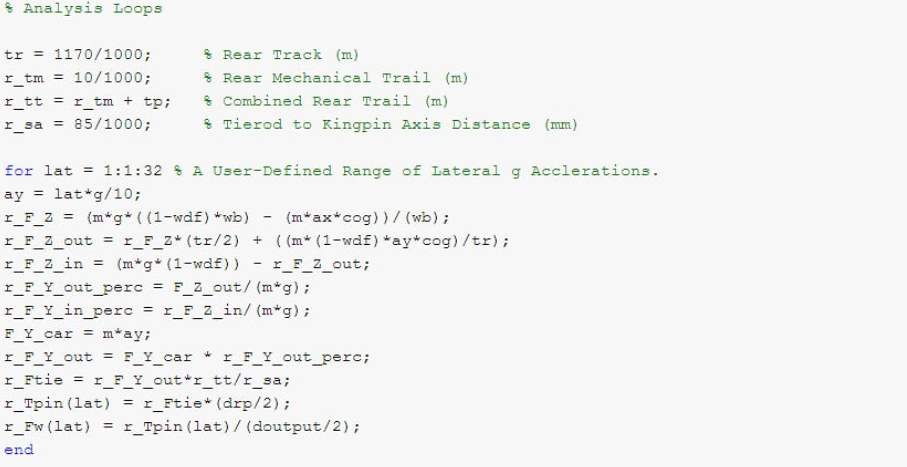
Figure 18. Load Transfer Code
The above code demonstrated a variation in lateral acceleration which was achieved through the use of a “for” loop, initially the equations were determined and then the calculation was repeated for each case of lateral acceleration. This section provides the main chunk of the steering force analysis and as before the results along with graphs will be provided in Section 4.
3.3.3 Rear Motor Torque
The below code shows how the previous force analysis can be utilised to calculate the rear motor torque.
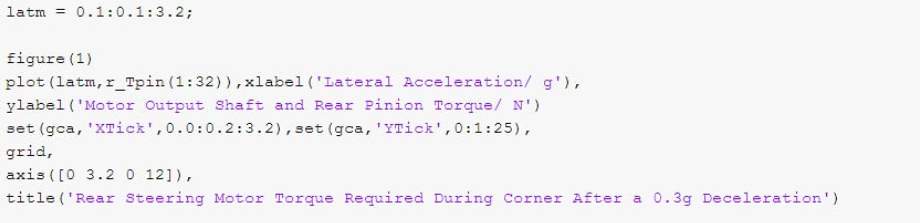
Figure 19. Rear Motor Torque Code
As before various lateral accelerations were used by utilisation of a “for” loop and this section of code outputs a 2D graph to determine the required torque for the rear steering actuator (DC Servo Motor) eventually allowing a suitable component to be chosen. This graph can be found in Section 4.2.
3.3.4 Rear Tie-Rod Forces
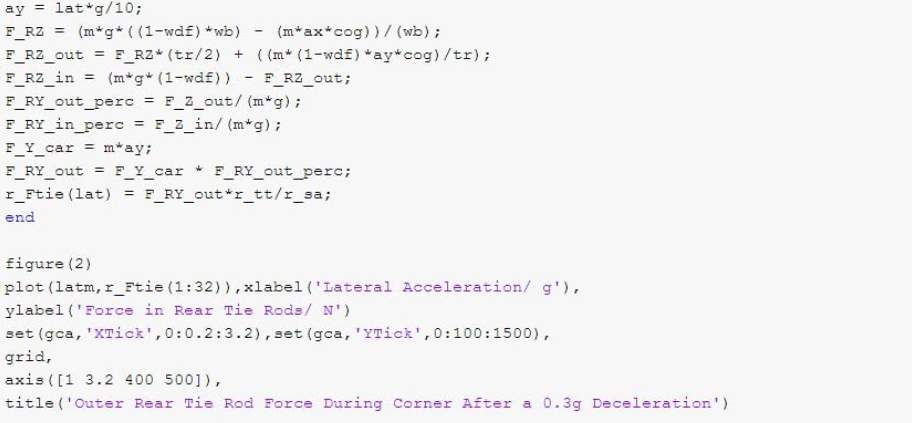
Once again the trusty “for” loop is used in the same situation as before with the difference being in the output graph showing the forces that are experienced by the outer rear tie rod from the actuation of the motor.
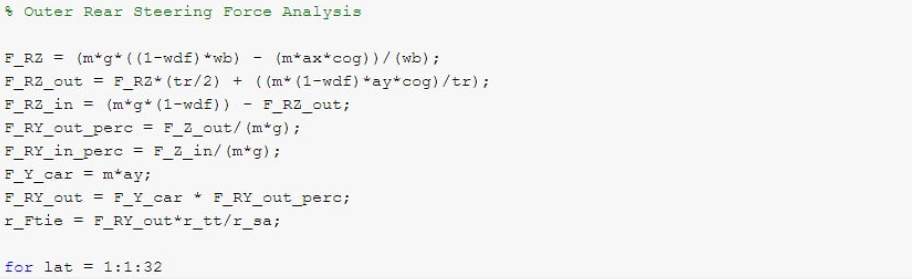
Figure 20. Outer Rear Steering Force Code
As before the resulting graph from the code in the above figure can be found in Section 4.2 of this report.
3.3.5 Steering Input Force
Two “for” loops will be required in this next section due to the presence of two system variables. Rather than just lateral acceleration, longitudinal acceleration is also present and when the two are combined the resultant total acceleration can be obtained for the vehicle. Utilising the equations for both front and rear steering forces found in Section 1.6.1 and 1.6.2 allowing the comparison between front and rear steering input forces.
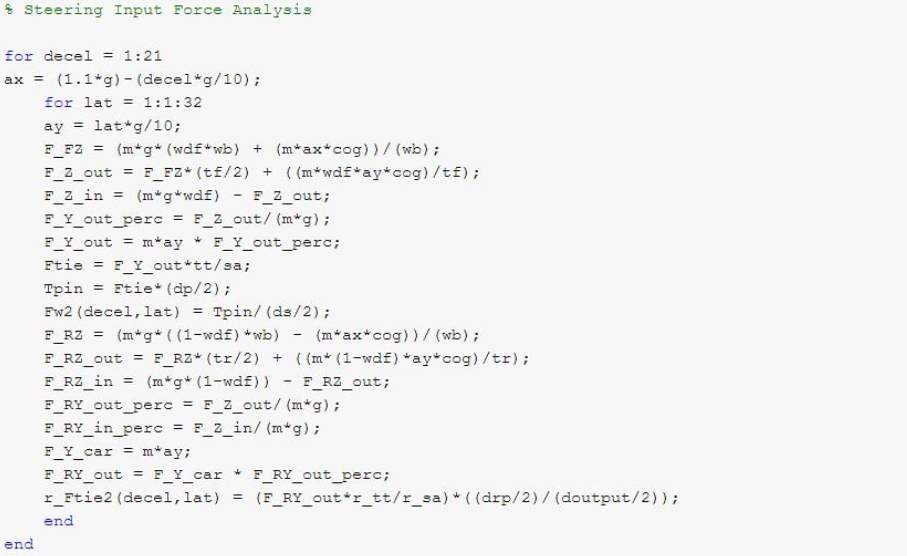
Figure 21. Steering Input Force Code
Due to width constraints the output code for the graphs to be shown in Section 4.2 for the Steering Input Forces can be found in the Appendix page x.
3.4 Design of an All-Wheel Steer System
The design of the system can be achieved in various ways, my chosen method was electrical through the use of a traditional rack and pinion system as seen below in Figure 22 that is electrically actuated by the use of a DC Servo motor rather than a steering input shaft connected to a steering wheel. This actuator will be controlled by an ECU that takes into account the current level of front steer to determine the amount of rear steer with a maximum of 6°. Feedback of the actuators last actuation will be introduced into the ECU in order to ensure that the actuator does not try to move outside of its mechanically implemented limit resulting in damage to the rear steering rack and potentially causing a crash during FSAE events.
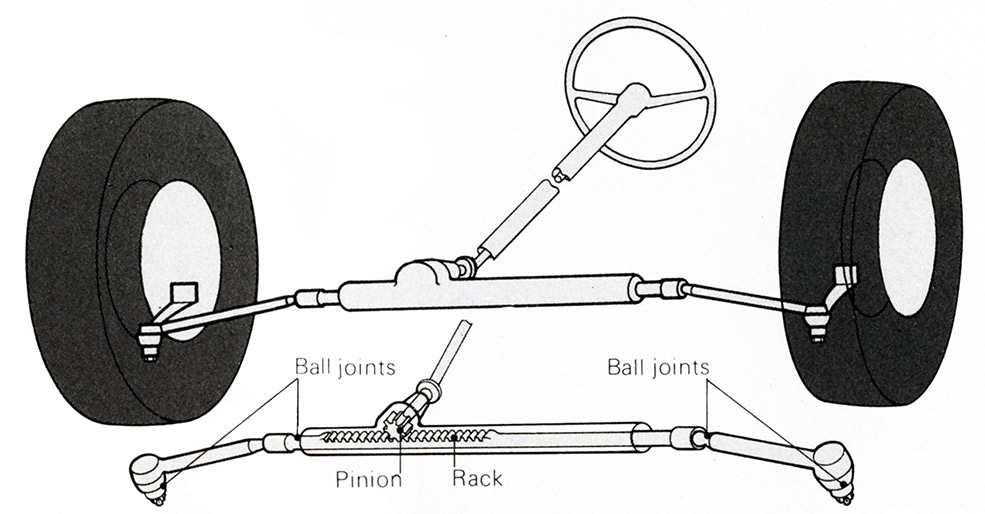
Figure 22. Rack and Pinion System (Torque Monkeys, 2015)
A more detail view of the rack and pinion itself can be seen in the figure below.
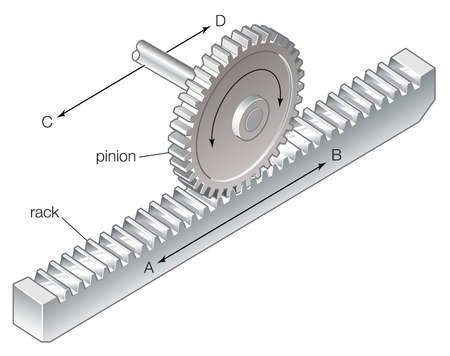
Figure 23. Rack and Pinion Close-up (Encyclopaedia Britannica, 2015)
As the steering wheel is turned, a shaft connected to the pinion is rotated resulting in the Pinion moving along the rack in either direction, this rack is connected to the wheels and results in a turning of the connected wheels. For the AWS system the pinion shaft will be rotated using a DC Servo motor.
Section 4: Results & Discussion
4.1 Steering Geometry Analysis
The following results are from the analysis of the AWS steering geometry in comparison to the traditional 2WS system.
Skidpad
Inner Front Wheel: 4.56°
Outer Front Wheel: 4.46°
Inner Rear Wheel: 0.11°
Outer Rear Wheel: 0.11°
Total Steering Angle Ability: 9.02°
Inner Front to Outer Front Ratio: 1.02
Hairpin
Inner Front Wheel: 21.58°
Outer Front Wheel: 18.92°
Inner Rear Wheel: 2.32°
Outer Rear Wheel: 1.75°
Total Steering Angle Ability: 40.50°
Inner Front to Outer Front Ratio: 1.14
Sweeping Corner
Inner Front Wheel: 1.85°
Outer Front Wheel: 1.75°
Inner Rear Wheel: -0.08°
Outer Rear Wheel: -0.07°
Total Steering Angle Ability: 3.60°
Inner Front to Outer Front Ratio: 1.06
The negative angles seen in the above results are due to rear oversteer of the vehicle.
The steering geometry results are from simulations of three FSAE events (Hairpin, Skid-pad and Sweeping Corner). The analysis of the current 2WS system has been included in order to draw comparisons to the proposed AWS system.
For the purpose of this analysis an out-of-phase rear wheel steering system was assumed due to the limitations of MATLAB and the equations gathered.
Hairpin
Inner Rear Wheel: 3.20°
Outer Rear Wheel: 2.80°
Total Rear Steering Angle Ability: 6.00°
Skidpad
Inner Rear Wheel: 3.03°
Outer Rear Wheel: 2.97°
Total Rear Steering Angle Ability: 2.20°
Sweeping Corner
Inner Rear Wheel: 3.08°
Outer Rear Wheel: 2.92°
Total Rear Steering Angle Ability: 0.87°
The above results show the Inner and Outer steering angles experienced at the Rear wheels in an AWS system.
It can be seen from the above results that only the hairpin event resulting in the total 6° of rear steering angles being utilised, with the skid-pad and sweeping corner even producing 2.2° and 0.87° respectively. This is expected due to the nature of the hairpin being a tight turn requiring the most steering input and in this test the utilisation of an AWS system would provide a great benefit by reducing the turning radius, as shown on the next page’s results.
Hairpin
Turning radius: 1.65m
Reduction in radius (m): 2.53m
Percentage reduction in radius: 60.59
Total Steering Angle Ability: 46.50°
Skidpad
Turning radius: 5.76m
Reduction in radius (m): 13.57m
Percentage reduction in radius: 70.22
Total Steering Angle Ability: 15.02°
Sweeping Corner
Turning radius: 9.08m
Reduction in radius: 40.92m
Percentage reduction in radius: 81.85
Total Steering Angle Ability: 9.60°
The reduction in turning radius is a dramatic one across all three events but this particular performance is most beneficial in the Hairpin test due to it consisting of a tight turn where the maximum steering input is given and the reduction in turning radius would lead to a much improved score, whereas the other events would benefit from the increase in cornering stability provided by the addition of steering input from the rear wheels. The sweeping corner would benefit the most from this system due to it testing the vehicles performance under a high speed corner, AWS allows for the vehicle to have a better yaw response allowing greater stability.
4.2 Steering Force Analysis
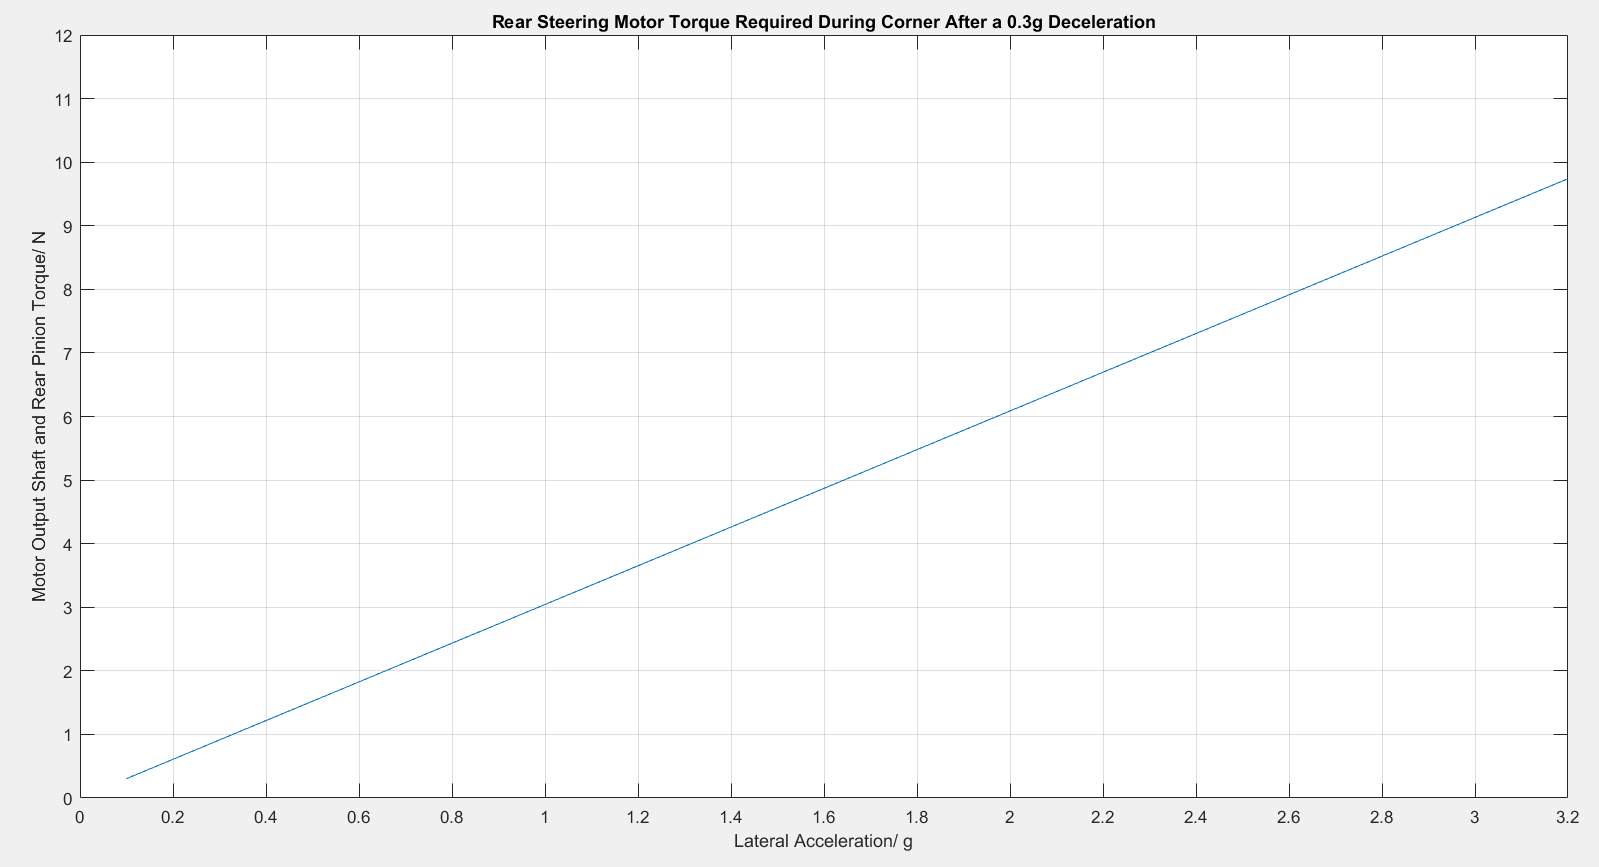
Figure 24. Rear Steering Motor Torque Required During a Corner after Deceleration
The above figure represents the following equation from Section 1.6.2.
FYr Pinion=(FYr Tie-rod)(Dr Pinion)2
Demonstrating the torque requirements of the rear steering motor, this torque is what the rear steering motor would be required to produced and from this analysis it can be seen that the maximum torque required of the rear steering motor would be
≈10Nm at the lateral acceleration of
3.2g, with the minimum torque required being
≈0.2Nm at the lateral acceleration of
0.1g.
In order to use these results effectively it should be noted that real world torque requirements way vary slightly and so a motor should be chosen with adequate headroom to account for such discrepancies in the simulated vs real world performance. This will also provide a safety function in the sense that the motor doesn’t fail during an event due to a greater torque being required resulting in a crash.
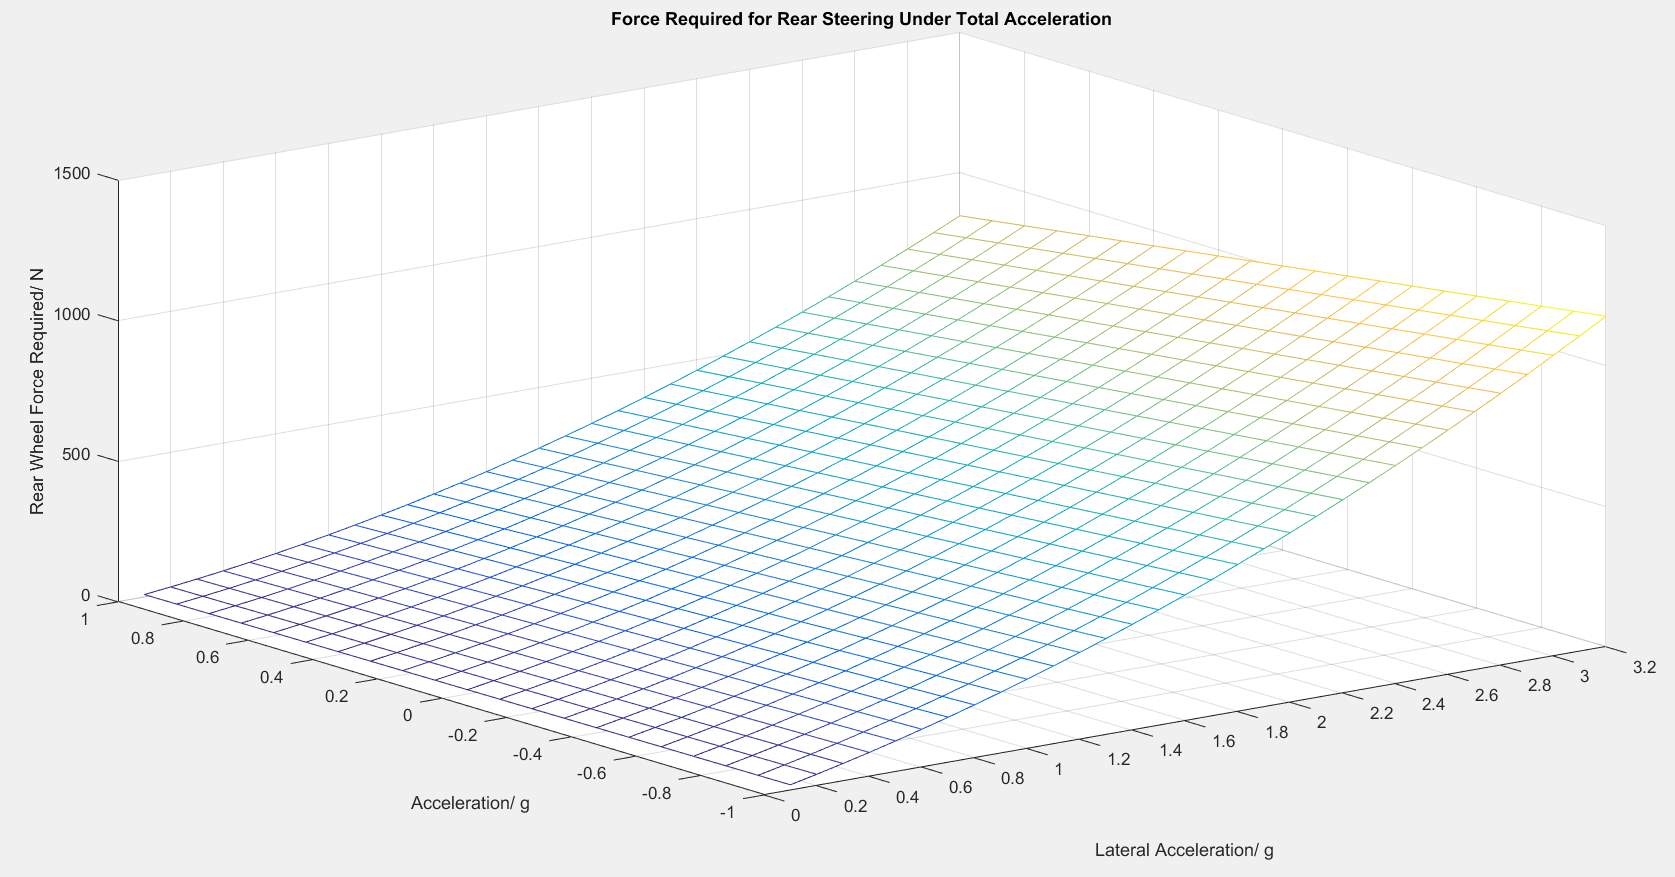
Figure 25. Rear Steering Force Required Under Total Acceleration
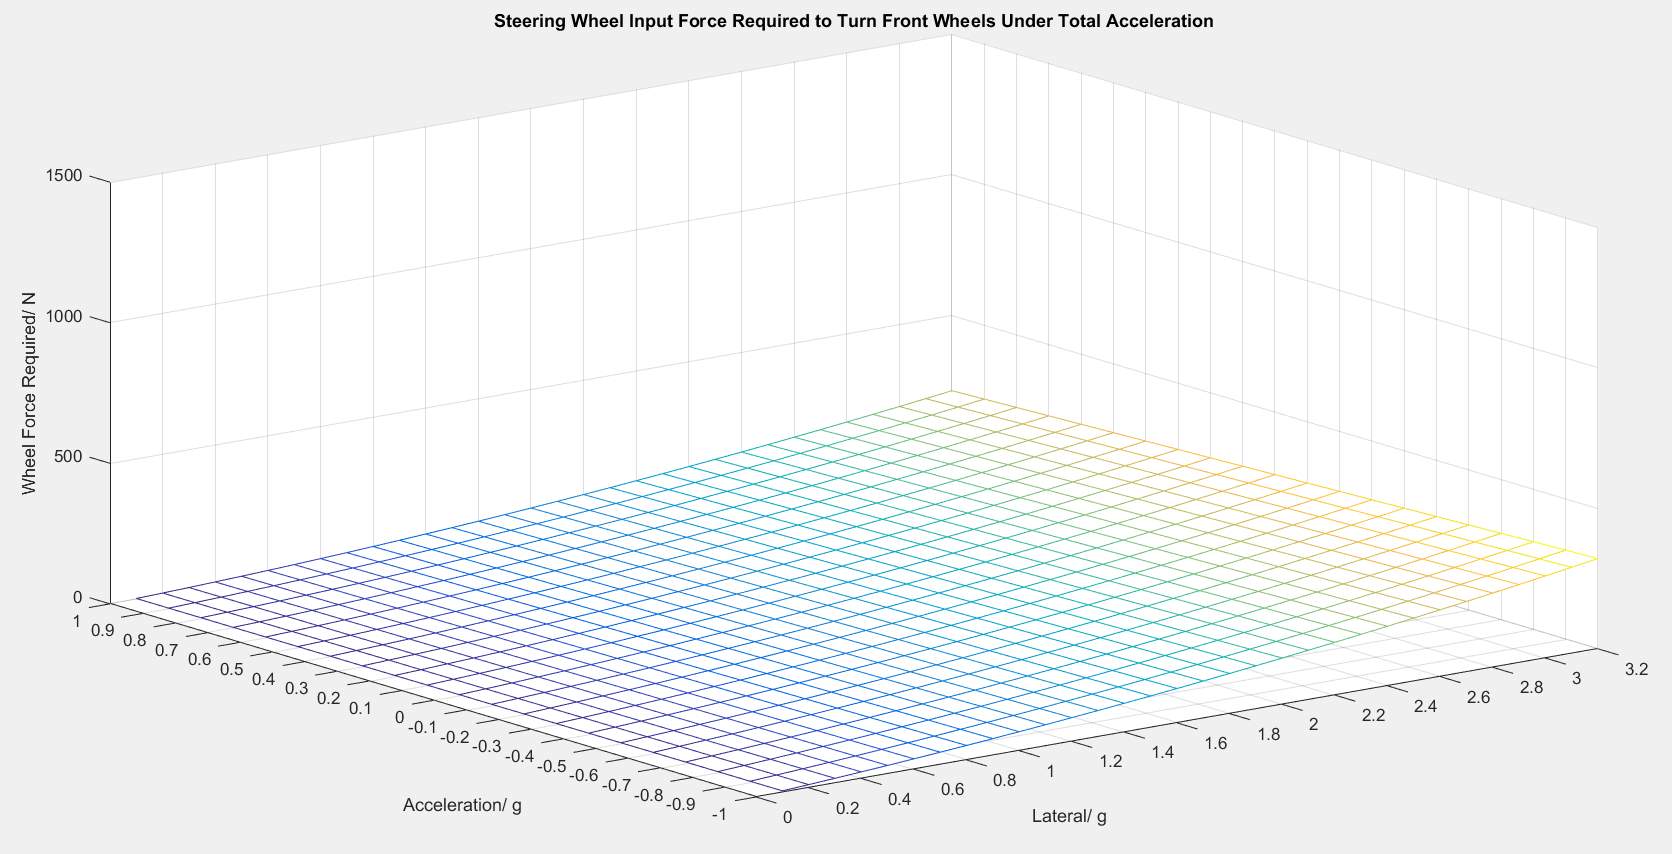
Figure 26. Steering Input Force Required to turn Front Wheels Under Total Acceleration
The above figures compare the force required to steer at the front and rear of the vehicle with variation in both lateral and longitudinal acceleration.
As seen in Figure 28 the maximum force required to steer the front wheels is ≈ 300Nat a lateral acceleration of 3.2g and longitudinal acceleration of -1g. Whereas the maximum force required to steer the rear wheels is ≈1200Nat the same lateral and longitudinal acceleration. Steering the rear wheels requires 4 times the force of steering the front wheels and this multiplier remains relatively consistent throughout the entire range of lateral and longitudinal acceleration.
The variation between front and rear required forces to steer is possibly cause by the elimination of the human input via a steering wheel connected to the pinion via a steering shaft, instead an electric motor output shaft is connected to the rear pinion and due to the smaller diameter of the electric motor output in comparison to the front steering shaft. This leads to an overall decrease in the output shaft to pinion ratio on the rear rack and as such there is a much greater force required to generate the same torque as the front wheel steering system. This is shown in the bottom equations in Section 1.6.1 and 1.6.2.
The force required for steering of both front and rear wheels is minimal where lateral acceleration is zero and longitudinal acceleration is positive. Due to longitudinal acceleration being controlled by the drive of the vehicle it would be very difficult to control as any reductions would cause the vehicle’s acceleration to be reduced, on the other hand utilising Direct Yaw Control could provide the ability to minimise the lateral acceleration in order to cause a massive reduction in the forces required to steer both front and rear wheels.
From analysis of the forces required for steering actuation of the front and rear wheels it can be seen that higher lateral acceleration leads to a dramatic increase in the forces required for steering, as so a key element of any AWS system implemented had to utilise a form of Direct Yaw Control in order to keep lateral acceleration to a minimum.
The equation used for Figure 26 can be seen below.
FYf Wheel=2(Tf Pinion)Ds
And the equation used for Figure 27 is shown below.
FYr Wheel=2(Tr Pinion)Dm
4.3 Proposed All-Wheel Steering System
4.3.1 Steering Actuator
Requiring an output torque of ≈10Nmleft little choice with TQ Group providing the best motor suitable for the task, the 0880W from the below spec table of their current available motors.
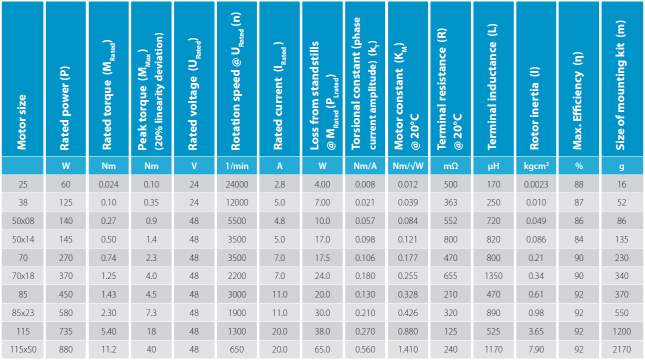
Figure 27. Motor Performance Characteristics (TQ Group, 2006)
The chosen motor met the criteria of maximum torque required to steer the rear wheels as determined in Section 4.2. The motor is also highly efficient reducing the strain on the electrical system of the vehicle which in this case in a lightweight racing car with a very small electrical output in order to reduce weight and maximise performance. The mass of this motor is 2.17kg and comes at a cost of around £1,900.
The motor provides a high power density allowing it to take up minimal space considering the amount of power it can output and due to TQ Group’s policy for their ‘Embedded Drive’ range Brunel’s racing team will be able to customise the requested motor based upon their own individual use-case allowing for a truly bespoke system that is designed for the Brunel Racing car removing the downsides of buying a generally available motor, this is particularly useful for any further optimisation done on the requirements of the rear steering motor as well as allowing packaging to be as bespoke as possible to not interfere with other components in the vehicle.
4.3.2 Steering Rack
The steering rack to be used for the Rear steering portion of the car will be the zRack 262, whose properties can be found below. “The zRack is an ultra-light weight Formula SAE and Formula Student steering rack.” (Zedaro, 2016)
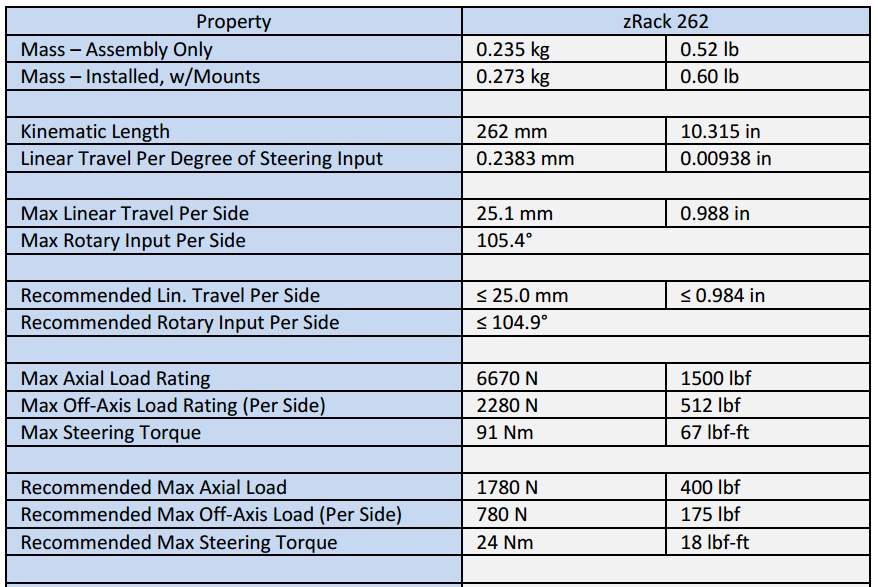
Figure 28. Zedaro zRack 262 Specifications (Zedaro, 2016)
The schematics of the zRack 262 can also be seen below.
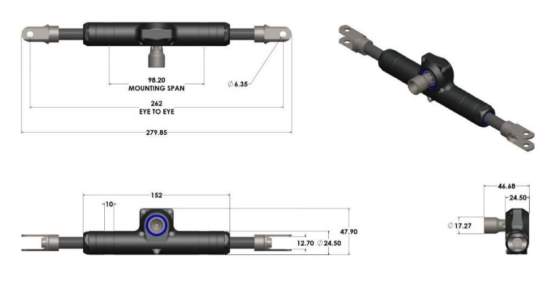
Figure 29. Zedaro zRack 262 Schematic (Zedaro, 2016)
4.3.4 Chosen Control System
The below figure serves to demonstrate the block diagram for the control functionality of the system.
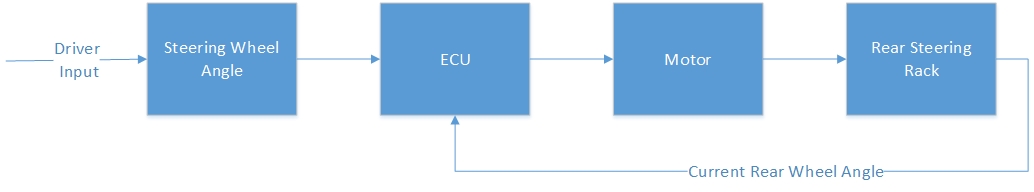
Figure 30. Block Diagram for All-wheel Steer System
Utilising an LUT allows for a simpler ECU to be used in order to control the rear actuator, all of the values for rear steer dependant on the value of front steer are calculated before hand and then input in an LUT allowing for the system to simply look at the current Front Steer angle and then use a set value for Rear Steer angle with a feedback of the Current Rear Steering Angle to avoid the motor being asked to do something outside of the limits of the rear steering rack.
4.4 Feasibility of Proposed System
The total mass, m of the entire system is:
0.273+2.17=2.443kg
The total cost of this system is:
£840+£1,900=£2740
Both of these figures are rough estimates with the cost being the most fluctuating as it depends on exchange rates between the USD and GBP due to the Zedaro zRack being priced in USD.
The packaging constraints within the Brunel Racing car are always extremely tight especially at the rear of the vehicle due to it being the location of the engine, but the small size of the Zedaro zRack and the compact and highly dense nature of the TQ Group 880w motor the entire rear steering system should fit without disrupting many components, the BR-17 or any future vehicle will require this system be designed and thought about during the initial design process to ensure that everything packages nicely but due to its compact nature it should be relatively easy to add in to the design without much complication.
Section 5: Conclusion
This project’s aim was to determine whether it was feasible to implement an all-wheel steering system into the Brunel Racing car for use in the Formula SAE competition. Through analysis of the existing 2WS system and comparison to the simulated AWS system the potential performance benefits have been observed as positive. The put forward steering system components have some expense but the performance benefits are definitely substantial enough to overcome those costs, the weight gained by the system is minimal compared to the overall weight of the vehicle and due to its reduction in turning circle and improvement in vehicle stability during high speed cornering situations this system could prove invaluable in making the Brunel Racing car better than the competition.
To conclude the outcome of this report is the following findings:
- Analysis of 2WS and AWS geometry have shown that an AWS system provides a great reduction in turning radius of the vehicle and results. Optimisation of the front to rear steer angle ratio can be determined through usage of the MATLAB scripts in the appendix allowing the Brunel Racing team to tailor it to future vehicles should parameter’s change.
- The reduction in driver input required would go greatly towards reducing driver fatigue and minimise any performance losses from the driver tiring due to fighting with the steering wheel.
- By active monitoring of the front steering angle determining the rear steer angle the system would always provide the optimum ability for the vehicle’s turning capability.
- The proposed components are extremely lightweight and provide a great performance benefit which is perfect for the racing use case where every slight weight increase has to have a greater performance benefit.
- The result is an All-wheel steering system that would increase the competitiveness of the Brunel Racing vehicle in all events, while improving high speed vehicle cornering stability and providing a reduction in driver fatigue hopefully leading to more races being won.
Section 6: Suggestions for Further Work
All-wheel steering has been an on and off idea in consumer vehicles for decades now, experts are constantly deciding whether it’s worth the additional complexity and cost for the added performance, many manufacturers have some form of rear wheel steering available but almost always as expensive options which are rarely chosen due to their unpublicised nature.
If more time and resources were available, I would have done the following things:
- Using the Siemens LMS package I would have created a 3D model of the BR-16 car in order to accurately simulate the performance in the events of the FSAE competition with both 2WS and AWS, this would provide a much more accurate simulation then using MATLAB as all assumptions would be taken out of the equation and only real-world performance would be observed.
- Physically building a prototype with the control system would allow more hands on work whilst allowing much more realistic performance gains being observed. The physical build process would also allow a more in-depth design and create the opportunity to look at the potential packaging issues by physically implementing it into a Brunel Racing car.
- Further research into other potential control systems that would allow for better control of the lateral acceleration further reducing the force required for the rear steering system and allowing a smaller, lighter and cheaper DC Servo motor to be used.
Section 7: References and Appendix
7.1 References
Acura, 2014. Precision All-Wheel Steer™ (P-AWS®). [Online] Available at: http://owners.acura.com/vehicles/information/2014/RLX/features/Precision-All-Wheel-Steer-and-Agile-Handling-Assist-Systems [Accessed October 2015].
Audi, 2015. Audi Q7 3.0 TDi Quattro All-Wheel Steering Animation. [Online] Available at: https://audimedia.tv/en/vid/q7-3-0-tdi-quattro-all-wheel-steering-animation [Accessed October 2015].
Bedner, E. a. C. H., 2004. A Supervisory Control to Manage Brakes and Four-Wheel-Steer Systems, s.l.: SAE Technical Papers.
BMW, 2011. BMW Insights – Integral Active Steering. [Online] Available at: http://www.bmw.com/com/en/insights/technology/technology_guide/articles/integral_active_steering.html?source=index&article=integral_active_steering [Accessed October 2015].
Brunel University, 2006. Award for Brunel Racing team. [Online] Available at: http://www.brunel.ac.uk/news-and-events/news/news-items/press/ne_24849 [Accessed January 2016].
Collantine, K., 2007. Banned! Four wheel steering. [Online] Available at: http://www.f1fanatic.co.uk/2007/03/22/banned-four-wheel-steering/ [Accessed October 2015].
Encyclopaedia Britannica, 2015. Image: 506900 Diagram of a rack and pinion, New York: illustration source.
Gillespie, T. D., 1992. Fundamentals of Vehicle Dynamics. 1st ed. Warrendale: Society of Automotive Engineers.
Katayama, T. et al., 2008. Development of 4 Wheel Active Steer. Steering and Suspension Technology Symposium, Volume SP-2189.
Lin, Y., 1992. Improving Vehicle Handling Performance by a Closed-Loop 4WS Driving Controller. SAE Technical Papers, Volume 921604.
Lohith, K., Shankapal, S. R. & Gowda, M. H. M., 2013. Development of Four Wheel Steering System for A Car. SASTech, 12(1), pp. 90-97.
Milliken, W. F. & Milliken, D. L., 1995. Steering Systems. In: Race Car Vehicle Dynamics. s.l.:SAE International, pp. 713-716.
Nissan Motor Co. Ltd., n.d. 4WS Technology and the Prospects for Improvements of Vehicle Dynamics. SAE Technical Papers, Volume 901167.
O’Kane, C. & Timoney, S., 2004. Investigation of Four-wheel Steering Algorithms for a Formula SAE Car. Vehicle Dynamics & Simulation, Volume SP-1869.
Porsche, 2013. 911 GT3 Rear-axle Steering. [Online] Available at: http://www.porsche.com/uk/models/911/911-gt3/chassis/rear-axle-steering/ [Accessed October 2015].
SAE International, 2015. Formula SAE Events History. [Online] Available at: http://students.sae.org/cds/formulaseries/history/ [Accessed November 2015].
SAE International, 2015. Formula SAE Rules and Regulations. [Online] Available at: http://www.fsaeonline.com/content/2015-16%20FSAE%20Rules%20revision%2091714%20kz.pdf [Accessed October 2015].
Torque Monkeys, 2015. TECH GUIDE – RACK AND PINION STEERING. [Online] Available at: http://www.torquemonkeys.com/cars/guides/tech-guide-rack-and-pinion-steering [Accessed January 2016].
TQ Group, 2006. Performance Characteristics Table, s.l.: TQ Group.
Zedaro, 2016. Zedaro zRack. [Online] Available at: http://fsaeparts.com/products/zrack?variant=530966633 [Accessed February 2016].
7.2 Appendix
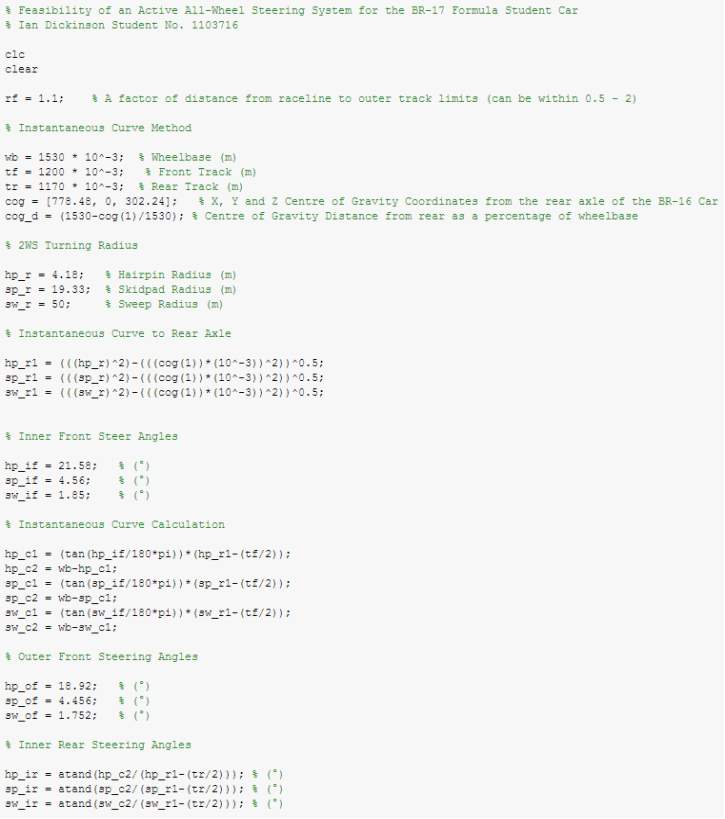
Figure 31. Steering Geometry Code Page 1
Figure 32. Steering Geometry Code Page 2
Figure 33. Steering Geometry Code Page 3
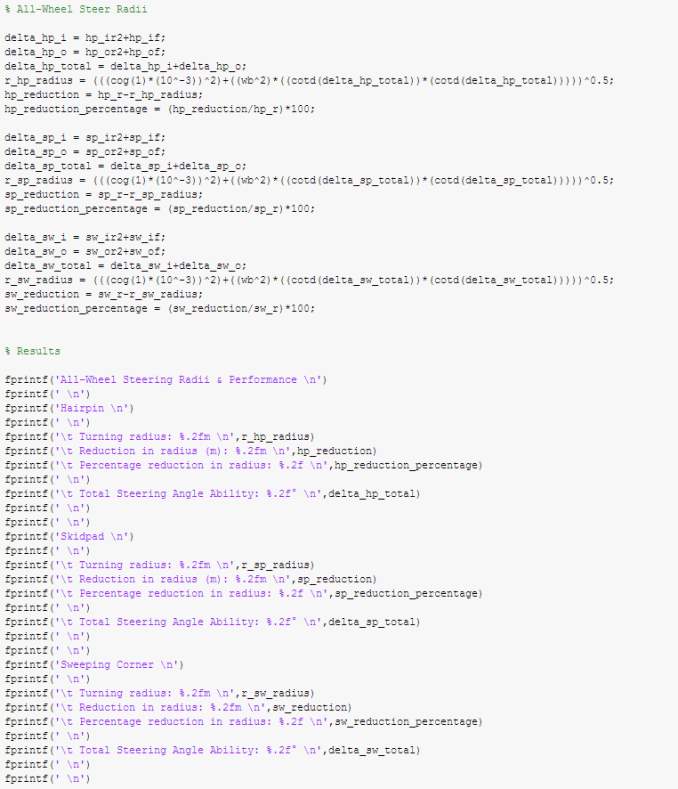
Figure 34. Steering Geometry Code Page 4
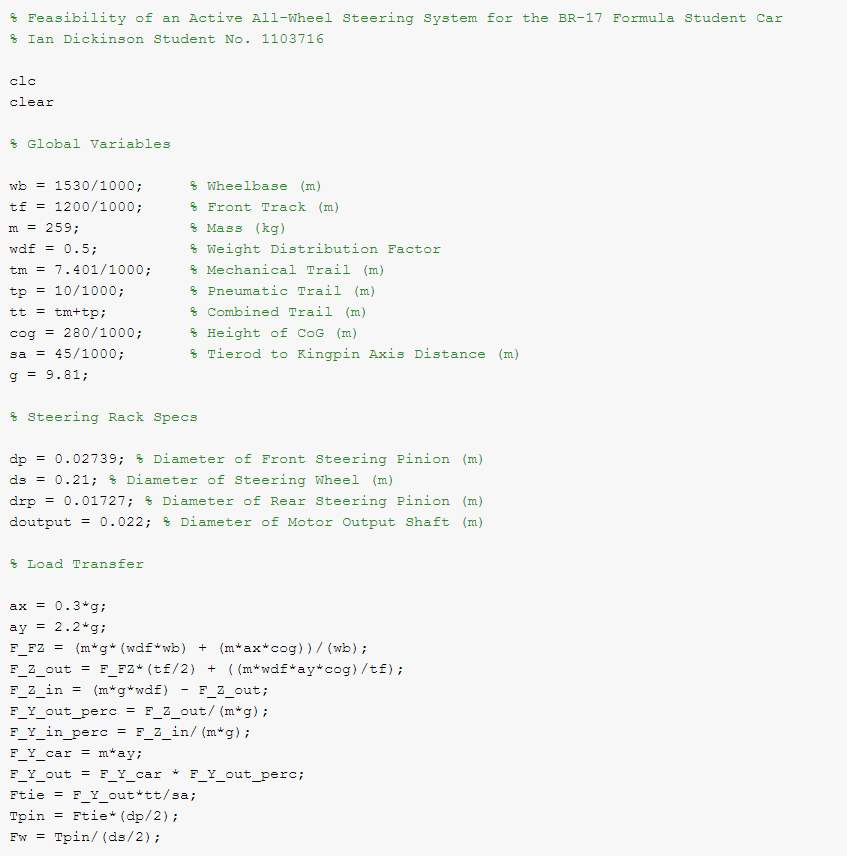
Figure 35. Steering Forces Analysis Page 1
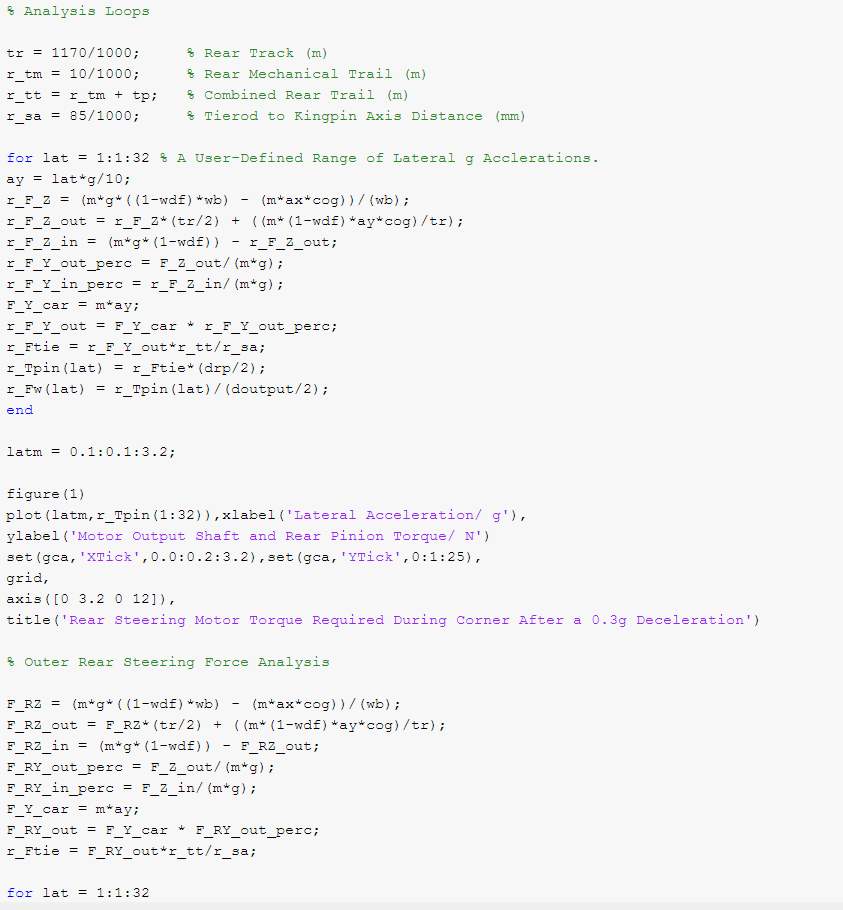
Figure 36. Steering Forces Analysis Page 2
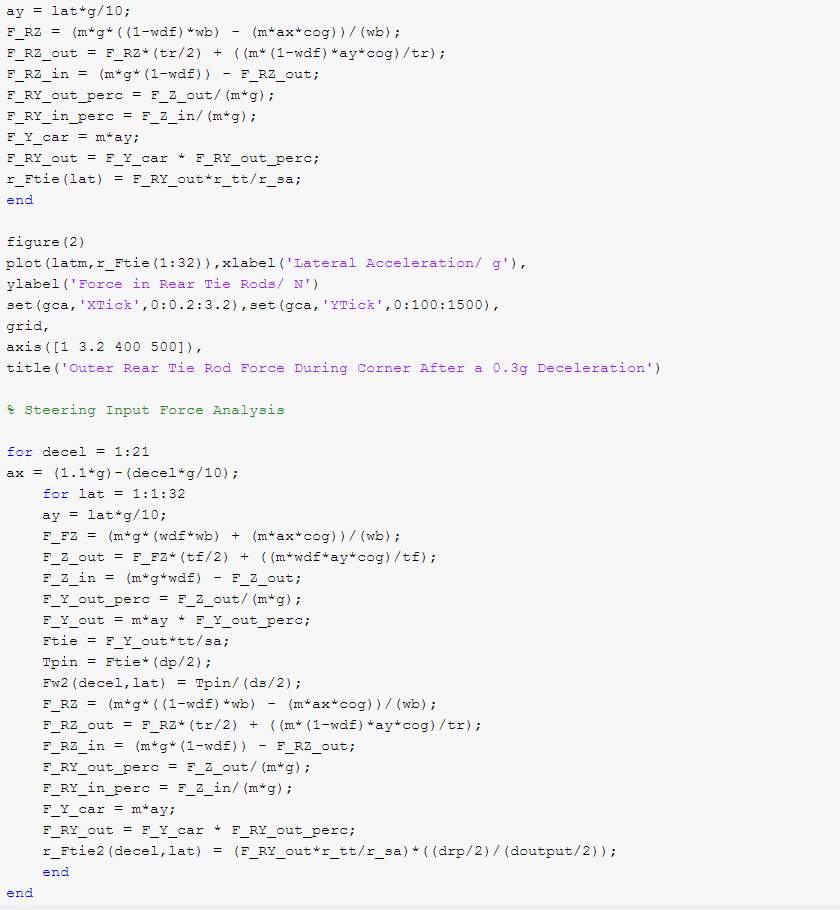
Figure 37. Steering Forces Analysis Page 3
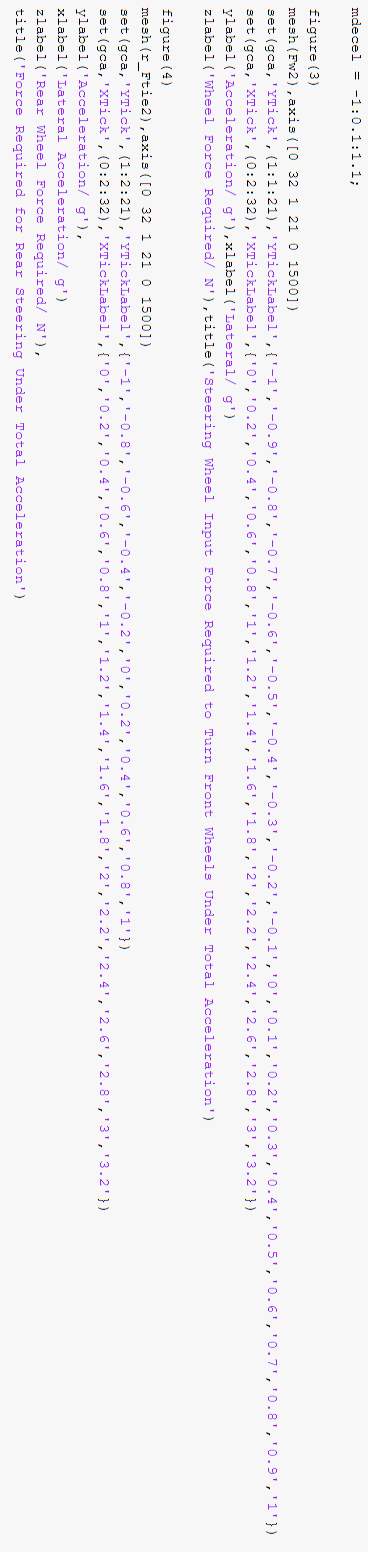
Figure 38. Steering Forces Analysis Page 4
Cite This Work
To export a reference to this article please select a referencing stye below:
Related Services
View all


Related Content
All TagsContent relating to: "Automotive"
The Automotive industry concerns itself with the design, production, and selling of motor vehicles, such as cars, vans, and motorcycles, and is home to many multi-billion pound companies.
Related Articles

DMCA / Removal Request
If you are the original writer of this dissertation and no longer wish to have your work published on the UKDiss.com website then please: