The Study of the Performance of Acoustic Materials for Automotive Application
Info: 10829 words (43 pages) Dissertation
Published: 11th Dec 2019
Tagged: Automotive
Summary
This project aims to study the acoustic performance of porous material for automotive application. This type of material is developed in recent years and is novel for vehicle noise control. The porous material meets all the requirements in automotive production, which is cheap, light, and recyclable and most importantly with good sound absorbing ability; therefore, it will be used widely in automotive industries. In this study, five different types of specimens (Autobloc, Melamine, Sample 10, Sample 14, Sample 16) provided by John Cotton Ltd was tested by two microphones impedance tubes with a 100-mm diameter under the standard ISO 10534-2:2001. The acoustic performance of these samples is compared with melamine foam. Padé Approximation was used to predict the non-acoustics parameters such as porosity and tortuosity. These parameters were put into Alpha-Cell to predict the acoustical properties for combined materials and to test the overall sound absorption performance. It has been suggested that, Sample 14, Sample 10 and Melamine are three best absorbers. Specially, the absorbing ability of Sample 14 is largely determined by its thickness, while melamine is the lightest material with good sound absorbing performance. However for the prediction given by Alpha-Cell, Melamine and Autobloc composite has best overall performance in high frequency noise field. In medium frequency range, Sample 10 combined with Melamine would give the best sound absorbing solution. Finally, in low frequency range, there is no big difference among different combinations, although composition of Sample 14 and Sample 16 is slightly better than the others. The use of each type of material in automotive has been introduced. In addition, there are four possible uncertainties for the experiments which may cause errors: 1. poor calibration of impedance tube, 2. poor specimen fit, 3. the thin specimen was not uniform, and 4. environmental influence. The error of this work has been calculated as
±0.077Pa∙s/m3. Repetition of the experiments will reduce the uncertainties with higher accuracy.
Nomenclature
Table of Contents
Table of Contents
2.3 Air Flow Resistivity and Acoustical Models
1 Introduction
In modern society, the demand for vehicles is increasing dramatically. Particularly in last few decades, there was a large growth in the number of both production and sales of passenger cars. Since the human interaction with cars is becoming more complex, now we have attached the definition ‘feeling’ to customers. The determining factors of customers’ decision are not only the outlook but more importantly the fuel consumption and the total cost. The comfortability of passenger vehicles also has aroused widespread concern of customers. To improve the driving experience, vehicle industries also put large efforts in enhancing the sound quality in order to get a higher respond from customers. For example, some of passengers would love to listen to classic music while driving which require a relatively ‘quiet’ space in the car for getting a much better feeling of enjoying the music; for long-travel passenger coach, the noise caused by passing cars or trucks would annoy passengers while resting. Also, according to the research of some institutes, vision, hearing and intelligence of people would be damaged if keeping staying in a noisy environment with long period. Therefore, to test the acoustics performance of different materials for automotive applications is meaningful in vehicle design and will help auto-industries enhance the overall customer experience. This type of study is called NVH (Noise, Vibration and Harshness) in automotive engineering. This project will particularly look at sound absorption performance of fibrous materials. For achieving this aim, this project also set up four targets:
- Determine the intrinsic parameters that influence sound absorbing ability of the fibrous materials.
- Predict the sound absorbing performance of single material samples and get accurate estimated parameters.
- Predict the sound absorbing performance of combined materials through simulating multiple layers of different materials in ‘Alpha-Cell’.
- Give suggestions on material selection in vehicle design with testing results.
2 Literature Review
2.1 Sound Sources
Generally, noises in the cars are generated by 3 types of sources: powertrain, road and wind. Usually, thesе noises are classified into three categories: low frequency (<500Hz), medium frequency (1000Hz-2000Hz) and high frequency (>2000Hz) (1). When noises from different frequency range superimposed in the car cabin, the noise will spread via air and vehicle structure.
2.1.1 Powertrain
In common, the sound generated by engine is believed to grow linearly with revolution speed of engine. When a car is running in relatively low speed, low frequency noises such as engine noise is dominating.However, in the case of vehicles powered by an internal combustion engine (take four-cylinder engine as an example), the unexpected noise will normally occur in the frequency range of 126.6Hz-166.7Hz.(1)Therefore, the noise caused by powertrain is a type of low frequency noise. Here the word ‘boom’ called by vehicle engineers should be introduced. ‘Boom’ is the situation where the peak value of sound exhibits in
6~7dBdeviations from its mean value. A more straightforward explanation has been given by ‘autohausAZ’ for BMW trouble shooting (2) as ‘A hollow, low-frequency sound/sensation which makes you feel as if you are riding inside a metal drum and the atmospheric pressure is rapidly changing between positive and negative.’ This type of noise can not only be caused by engine but also can be triggered by other form of vibration such as tire friction. Low frequency noises have long wavelength; thus, it is very difficult to decay and can easily bypass the barriers. Therefore, the low frequency noises are believed as the hardest type to be eliminated.
2.1.2 Tire/Road Noise
Many car companies have been successfully applying the noise reduction techniques between the cabin and powertrain system. Therefore, the tire/road noise is becoming the main type of unexpected sound which arouses great concern. In common, road noise is generated by the friction between tires and road surfaces which later propagates into vehicle via both the frame and airborne path (Figure 2.1). It has been pointed out by Gabriella Cerrato(1) that the road noise will start to be heard at the speed of vehicle
30mph and above but the maximum noise is made between 40 mph and 60 mph and with higher speek, the noise will conversely drop down. Gabriella also claims that the difference between good and bad road noise quality occurs between 500 Hz and 1300 Hz. However, the different standard has been presented a well -known tire company Michelin (3) (Figure 2.2) that tire noise will start to occur at 30 Hz and then it will become the dominate part of noise above 250 Hz. Despite Gabriella and Michelin have different standard to define tire noise frequency ranges, it is quite clear that this type of noise is often within the range between 500 Hz and 1300 Hz. Therefore, the friction between tires and road would be the main noise source when the car runs between 40 mph and 60 and tire/road noise is classified as medium frequency noise.
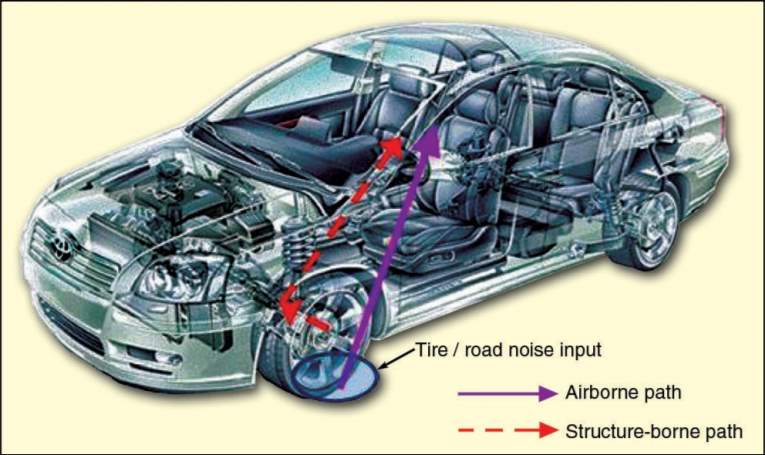
Figure 2.1 The Tire/road noise propagating path of Airborne and Structure -borne in a vehicle (1)
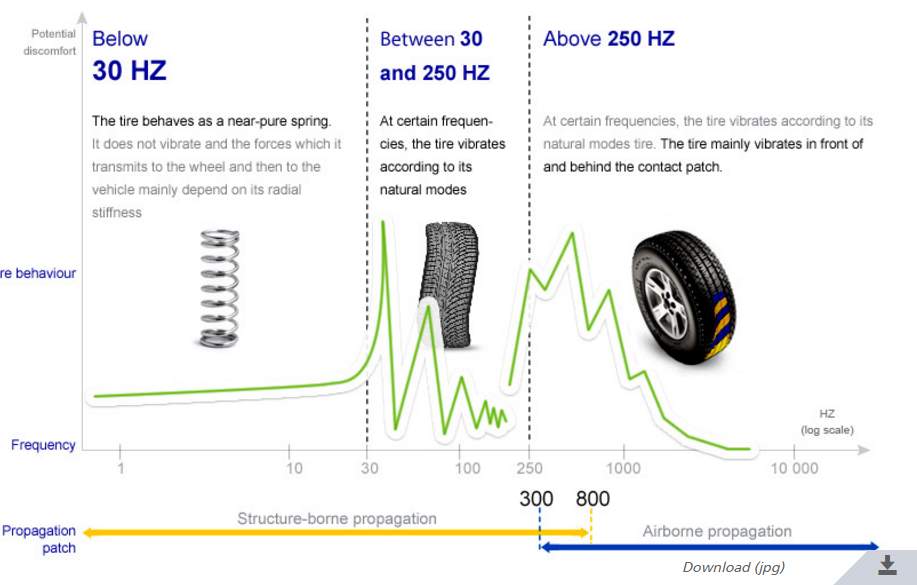
Figure 2.2 Tire/road noise frequency range evaluation given by Micheline company (3)
2.1.3 Wind Noise
The wind noise is a very broad concept. Gabriella organized it in 4 types of branch(1).
1. Aerodynamic noise caused by the movement of vehicle: when the vehicle is moving very fast in the steady-state air, the drag will occur which will generate sounds and this is related to the shape and cross-section of the car.
2. Aerodynamic noise made by poor sealing. For example, as vehicle running at high speed, the turbulence flow would get through the gap between doors and windows.
3. Wind noise generated by the environment out of car cabin. This type of wind noise is different because it generally believed as the random factor.
4. Extremely low frequency beating noise, usually in 10Hz to 20Hz. It also has been pointed out by Gabriella that, this situation happens while rear window or sunroof are partially open. In this case, there will be Helmholtz resonance in the car cabin. Noise will be generated by the air flow pass through the boundary of either window or sunroof.
Apart from the last type, the rest of three kind of phenomenon is particularly obvious when the vehicle runs at high speed.
It also has been suggested by JAWS(4), a well-known Chinese noise insulating material company and SINA (5), a Chinese mainstream media that for the vehicle driven in different speed, the methods for reducing noise would be different. The scheme has been organized in Table 2.3:
| Vehicle Speed | Related Constructing Part |
| Low Speed Noise | Fender,Chassis |
| Medium speed Noise | Door, Engine Cover, Fire Wall, U-Slot and Trunk |
| High Speed Noise | Gap between each part of vehicle |
Table 2.1 Scheme of vehicle development for different speed.
Also for different types of Noise, the solution has been shown in Table 2.4.
| Noise Type | Related constructing part |
| Wind Noise | Engine Compartment, Doors, Trunk and Gaps |
| Engine Noise | Engine Cover, Fire Wall and U-Slot |
| Tire/Road Noise | Fender |
| Vibration Noise | Chassis |
Table 2.2 Scheme of vehicle development for different type of noise.
So far, vehicle companies have given lots of solutions to solve these problems such as active noise reducing and sealing development. Most of them invest a large amount of money on doing the study about advanced car interior noise control techniques. As the design of automotive is becoming increasingly complicated, many different parts need the installation of these techniques. However, when considering about the total cost in order to increase competition, there is a high requirement for the reduction of total weight of cars and high standard of interior sound quality. Fibrous materials are likely to be a satisfied solution. They not only have very good acoustical and mechanical performance, but also are relatively light, cheap and recyclable. Therefore, fibrous materials tend to meet most of the requirements of car industries.
2.2 Acoustical Materials
Acoustical materials particularly refer to materials which could reduce the effect of noise (i.e. insolate or absorb sounds) in the interior of cars. To meet the requirements for a ‘quiet’ car, acoustical materials not only should have good performance in noise control, but also need to be light-densified with low price and perform well in thermal insulation, mechanical properties and corrosion resistance.
In the last few decades, automotive industries pay a lot attention to the study of absorbers and the most common type of sound absorptive material is porous material. Porous materials have two branches, open-cell and closed-cell. It is generally agreed by many authors that open-cell porous material have better sound absorbing performance (6). Open—cell materials contain lots of small pores connected by each other or by further forms of small channels. The mechanism of open-celled porous material is that the incident sound wave propagates through air and gets into the materials via the small holes on the surface of absorbers. Due to the frictions between the wall of channels and air particles, the sound energy will be converted to heat in the pores. Therefore, the parameters such as air flow resistance, porosity, mean pore size, tortuosity and so on are very important for determining the absorption ability of noise. This will be further discussed specifically in later section.
Some structures of porous materials have been shown in Figure 2.5 (8).
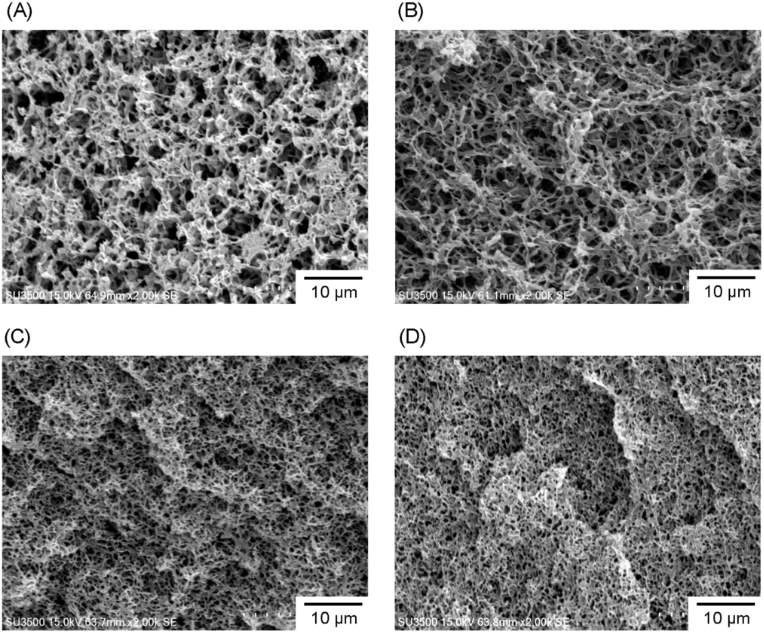
Figure 2.3 Microstructure of P3HB3HH6 monoliths with different polymer concentration (A) 50 g·L−1; (B) 100 g·L−1; (C) 150 g·L−1; and (D) 200 g·L−1(8)
It has been presented by Kirill V Horoshenkov (8) that there are 3 typical kinds of porous media, 1. rigid-frame; 2. elastic frame and 3. limp. The key parameter to distinguish these 3 kinds of material is density. If the density of material is higher than air and it is relatively stiff, it is believed as ‘rigid-frame’; if material density is comparable to the air density and its frame is not self-supportive, this material is called ‘limp.’ However, if the density of material is close to the air and meanwhile it is self-supporting then this material is considered as ‘elastic-frame.’ This section will talk about two typical rigid-frame porous materials including foam and fibers.
The most common type of open-cell porous material used in automotive industries would be foam. Foam is usually made by plastics and it is a good sound absorber, relatively light and cheap. It also has very good thermal resistance and corrosion resistance. Undoubtedly, it seems that foam is an ideal sound absorber which meets nearly all the criterias of automotive industries. It is reasonable because it is widely used for cars till today. However, to consider the safety of cars, foams have a very obvious defect with high level of combustibility. Because plastic is organic material, when the temperature increases in the surroundings, especially when traffic accidents happen, the material is likely to function as combustion agent, leading to possible casualty. In this case, a possible solution suggested by Fusheng (6)is to use metal frame foam. It has been suggested in his paper that open-cell aluminum foam has reasonably good mechanical properties and particularly work well in the frequency range of 1500-3500Hz. However, the main issue of using metal foam is that it is relatively expensive. Most of vehicle companies are trying to reduce the total cost of the car. In addition, metal has very good electric conductivity which is also a potential risk because the passengers may suffer from electricity leakage. Furthermore, in the hostile environment with heavy raining and muddying whenwater is stored, the material itself will be rusty. Although foam is a widely used as a sound absorbing material, the shortage of it is also obvious as well.
Another type of porous material, fibrous media, however, has significant advantages. Firstly, fibrous materials can function well with very wide frequency range for sound absorption. It has been present by M.T.Fadzlita (9) that coir fibers has significant noise reducing performance from 200 Hz to 3000 Hz, and particularly works well in the range between 500 Hz and 2000 Hz. In addition, the fibrous materials in automotive application generally are glasswool and rockwool that they are non-organic; this means a better flame retardant and corrosion resistivity. Furthermore, fibrous materials are easily made and cheap that it would be very attractive for those companies who want to reduce the cost. Finally, most fibrous materials are recyclable. In current world, with the progress of science and technology, it is also promoted that we should considered sustainable development. Recyclable fibers not only reduce the total cost, but also contribute to the preservation of the environment.
2.3 Air Flow Resistivity and Acoustical Models
2.3.1 Air Flow Resistivity
The air flow resistivity (σ) is a very important parameter which controls the ability of pores material to absorb sound. It originally purposed by Nichols in 1947(10). Flow resistance is the friction which occurs while the air particles passing through the channels between fibers. It is determined by the size, shape and total numbers of fibers in a certain volume of sample. The distribution and orientation of fibers also related to the magnitude of air flow resistance. Sound propagation in the air can be considered as the flow of air particles, therefore air flow resistivity is the key parameter to quantify the acoustics performance of porous material.
However, the ‘bulk flow resistivity’,
σ=α∞σx∅ has been introduced by Horoshenkov et al(11) which replace flow resistivity of single pore,
α∞is tortuosity, which is a parameter to describe the how do the internal channels consisted by pores tortuous (twisted and have many turns) and
∅is porosity which is a parameter to show the percentage of empty volume in a porous material.
For non-uniform pore, the expression of
σx also has been derived by Horoshenkov et al from JCA model (12) and Champoux-Stinson (13) as:
σx=8ηs̅2e6(σslog2)2
Equation 2.1
where
η=1.81×10⁻⁵ Pa·sis dynamic viscosity of air,
s̅is mean pore size in the media,
σsis standard deviation of pore size. Therefore, the air flow resistivity can be expressed in a new form:
σ=8η·α∞s̅2∅e6(σslog2)2
Equation 2.2
In addition, there is a relationship has been given by Notes on Sound Absorption Technology (K.Uno Ingard) (14):
R=r0cL/∅ρc
Equation 2.3
Ris total DC resistance of the layer of sound absorb material,
r0cis flow resistance,
Lis the thickness, H is porosity,
ρis density of air and
c is sound speed in the air. It also has been suggested by K.Uno, according to figure at the certain wavelength and thickness (
Lλ=Constant), there is indeed an optimum R for calculating the maximum sound absorption coefficient. For example, the optimum R is around 3 when
Lλ=0.1. However, in ideal case, porosity
∅is tend to be between 0.95-1 for good sound absorbing performance. Therefore the following relationship could be obtained for the maximum air flow resistivity with
∅≈1:
r0cL≈3ρc
This equation can be rewritten as:
σ∙h≈3ρ0c0
Equation 2.4
A good sound absorb should satisfied by this relationship because if the value of
3ρ0c0, most of the incident sound would not penetrate the material. Also, if the value is much lower than
3ρ0c0, the propagated sound would not meet much resistance in the material pores to get absorbed.
2.3.2 Acoustical Models
The acoustic models are able to predict the characteristic impedance and propagation constant for fibrous materials by their intrinsic parameters. The characteristic impedance
ZCand boundary conditions at the surface of material determine the ability of sound waves to enter the porous media. In addition, the wave number
k presents the speed of sound propagated in porous media and the rate of decay (8).
To combine the theories of plane wave propagation, the sound absorption coefficient could be obtained. There are quite a lot of work related to acoustical models. Perhaps Delany and Bazley (15) model is the most famous one. They presented that for fibrous material with porosity close to 1, the characteristic impedance
Zc=ρ0c01+9.08103fσ-0.75-j11.9103fσ-0.73
Equation 2.5
k=ωc01+10.8103fσ-0.7-j10.3103fσ-0.59
Equation 2.6
ρ0and
c0are the density of air and speed of sound in the air,
ω=2πfis the angular frequency and σ is static air flow resistivity in the wave direction of propagation. Delany-Bazley model is a one-parameter model of
fσ . The boundaries for validity of these power law expressions are:
0.01<fσ<1.0
Another famous model, Miki model which proposed by Miki Y in 1990 (16). It is a three-parameter model and can be expressed as:
Zbf=α∞∅1+0.07fσ-0.632+0.107ifσ-0.632
Equation 2.7
kbf=2πfa∞c01+0.109fσ-0.618+0.160ifσ-0.618
Equation 2.8
.
This model was based on the Delany and Bazley model. Miki pointed out that at the low frequency range, sometimes the real part of the characteristic impedance in the Delany and Bazley model would become negative which does not make any sense in physics. Therefore Based on the data measured by Delany and Bazley, Miki correct the characteristic impedance and gave new expression which has been shown above. It is generally believed that Miki model is an accurate and reliable model for fibrous material.
However in 2007, Japanese researcher Takeshi Komatsu(17) proposed a modified Delany-Bazley and Miki model. He tested more than 15 types of fibrous material samples by 2 microphones impedance tube. The details of his experiment will be discussed in the section 2.4. Takeshi Komatsu believed that his measurement was relying on the data from the advanced equipment, it would be more accurate. Thus he proposed a new model which has been shown below:
Zc=ρ0c01+0.00027(2-logfσ)6.2-0.0047(2-logfσ)4.1j
Equation 2.9
k=2πfc0{0.00692-logfσ4.1+(1+0.0004(2-logfσ)6.2)j}
Equation 2.10
This model is particularly work well when
fσ<0.01m3/kgor
fσ>0.1m3/kg.
The Padé Approximation model is using Padé Approximate theory to obtain the viscosity correction function to correct the characteristic impedance and wavenumber in the porous material. It was presented by Horoshenkov et al (11) and the expression has been shown below.
ρx(ω)=ρ0-RxiωF(ω)
Equation 2.11
where is
ρx(ω)approximated dynamic density
Rx=-limω→0(τ(ω)u(ω))
Equation 2.12
Is effective DC flow resistivity averaged over the pores (18) and then
Fω=τ(ω)u(ω)[limω→0(τ(ω)u(ω))]-1
Equation 2.13
Is the viscosity correction function given by Yamamoto and Turgut
It also has a relationship about complex wavenumber
k:
kx2ω=ω2ρx(ω)Cx(ω)
Equation 2.14
where
Cxωis complex compressibility. In addition, here the bulk medium dynamic complex density
ρb=α∞2Φρxand therefore we have:
ρb=α∞2Φ(ρ0-Rbiωα∞2F(ω))
Equation 2.15
then the complex wave number is:
k=ωρbCb
And the characteristic impedance is:
Zc=ωρbk=ρbCb
Equation 2.16
2.4 Pervious Experiment
The similar experiment was done by Takeshi Komatsu, Industrial Research Institute of Shizuoka Prefecture in 15 January 2007. (17) The purpose was to improve the Delany-Bazley and Miki models for fibrous sound-absorbing materials. The work followed ISO-10534-2:1997 standard. There were 15 kinds of glass wool materials with
8-54mmthickness and density of
20-102 kg/m3 had been tested. He also tested some rock wool materials. The equipment used in this work was 2 microphones 40 mm diameter impedance tube which is a 40-mm diameter cylinder with 2 microphones on the side. The sample was put in the middle of microphones (see Figure2.4) (17). The results from his study shows that compare with Delany-Bazley and Miki models, a new model presented by him was particularly work well under the condition of which
fσ>0.1 m3/kg.The experiment of my parject is was following the standardISO-10534 (19)The apparatus used was 2 microphones impudence tube with 100 mm diameter. In addition, unlike the sample put in the middle of two microphones, the samples in my experiment were put on the hardback which is attached a side of the tube. It has been mentioned by Heinrich Kuttruff (20), for standing wave tube (impedance tube) the diameter should be satisfied by the following relationship:
d<0.586λ, where
λis wavelength. Also, it should be noticed that
λ=cf, where
cis speed of sound and
fis frequency. Therefore, the using the tube with larger diameter could help look at the performance of the materials under low frequency conditions.
The details will be discussed later in the section: Experimental Methodology.
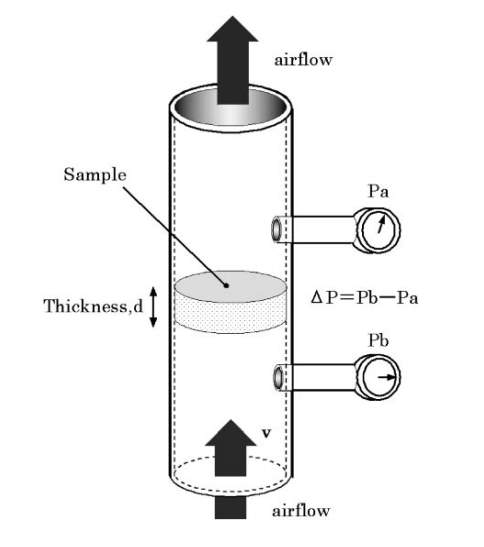
Figure 2.4 The equipment set-up for Takeshi Komatsu’s experiment (17)
3 Experimental Methodology
This experiment was to use 100 mm 2 microphones impedance tube to test the sound absorption performance for 5 kinds of fibrous material. Initially, specimens were cut as 100 mm diameter cylinders. the density for each specimen was simply calculated by
mass(kg)/volume(m3). The masses were measured by an electronic scales of Kern KB10000-1N and volume was calculated by the dimensions of samples which were measured by digital calipers.
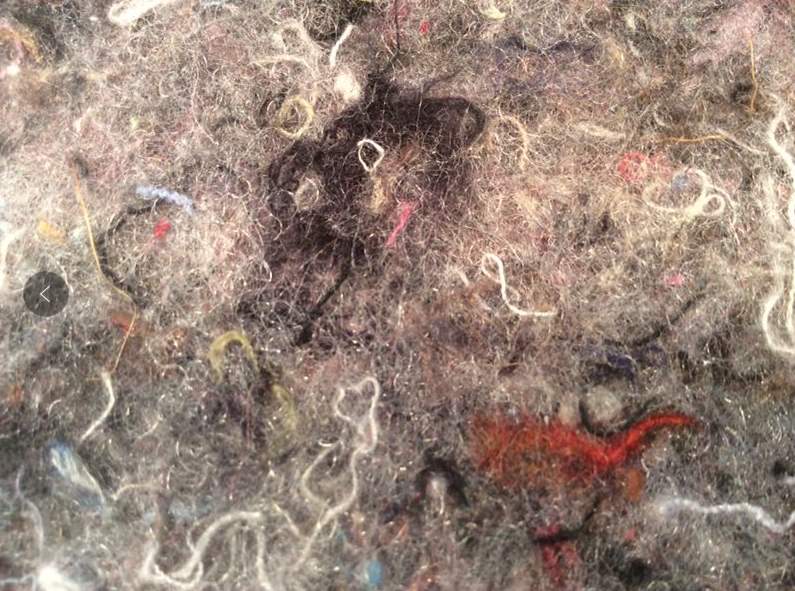
All the samples tested in this project were provided by John Cotton Ltd. Figure3.1-3.5 present photographs of the samples used in these experiments. In order to be accurate, the test for each type of samples was divided by two groups, single layer and triple layers. It is also helpful to understand the relationship between the thickness and sound absorbing performance. In the experiment, sound absorption coefficient, surface Impedance and phase of these material specimens were measure in accordance with the ISO-10534-2:2001(19). The apparatus used in the measurement was 2 microphones 100 mm diameter impedance tube produced by Materiacustica.(21)The test specimen was put on the hardback attached on the side of tube. The set-up of entire equipment has been shown in Figure3.6. (22)
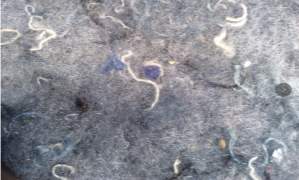
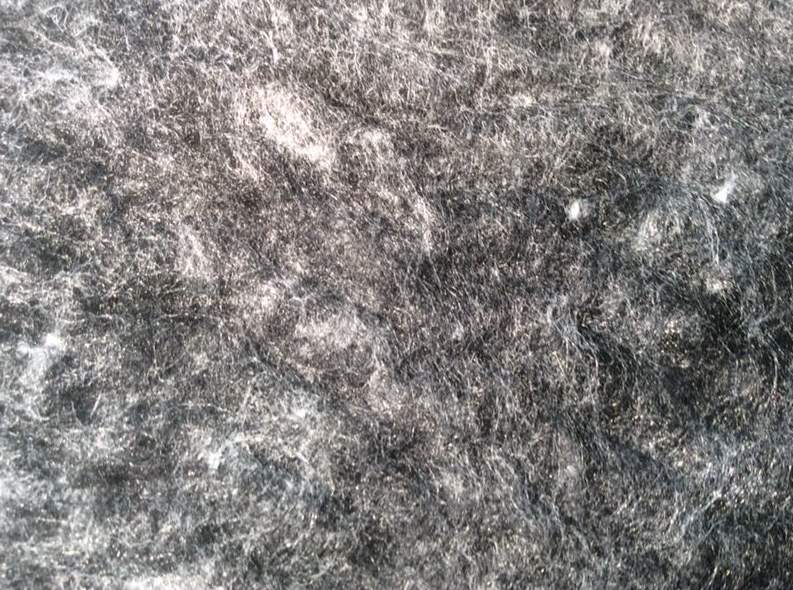
Figure 3.1 Sample 14 |
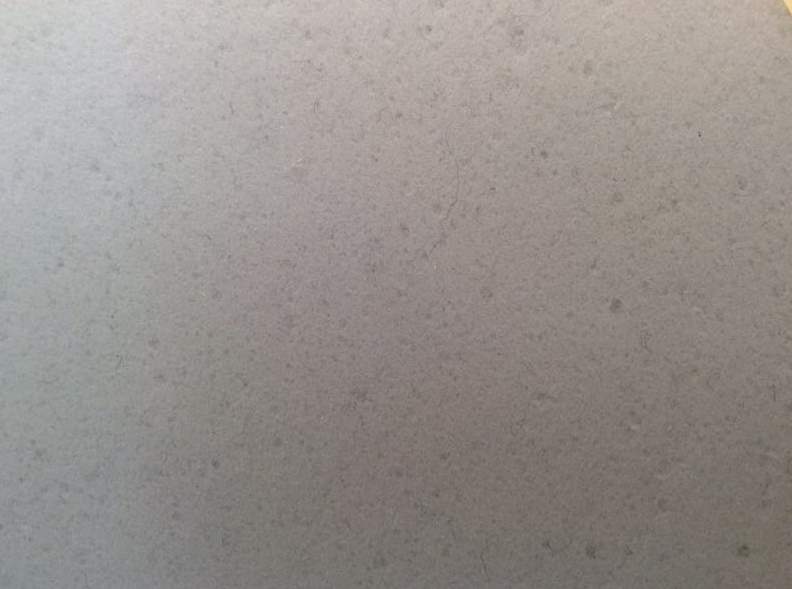
Figure 3.2 Melamine |
 |
 |
| Figure 3.3 Autobloc | Figure 3.4 Sample 16 |
 |
|
| Figure 3.5 Sample 10 |
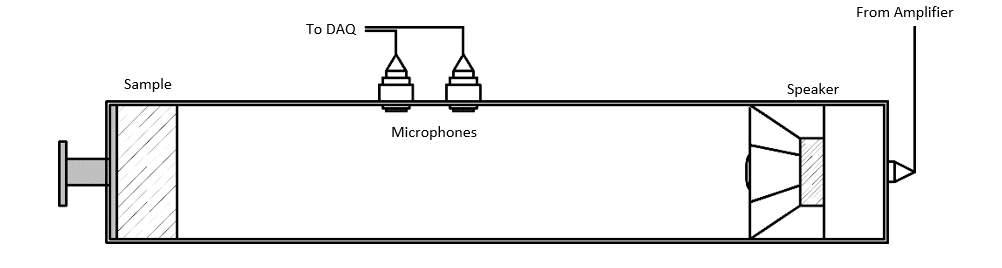
Figure 3.6 The set-up of 100mm diameter 2 microphones impedance tube (21)
The acoustical model used was Padé Approximation. Because it would be very difficult to calculate acoustics properties of the porous media with non-uniform pores by using the other acoustical models. The measured values of impedance and other parameters were substituted to equation below by using function ‘fminsearchbnd’ given by MATLAB:
Fx=∑n=1N{Zexp∅,fn-Zth(fn,σ)}→min
Equation 3.1
where
Zexp∅,fnis the measured surface impedance and
Zth(fn,σ)is predicted surface impedance.
fn={σ,α∞}is sound frequency, where σ is calculated air flow resistivity and
α∞is tortuosity.
The next step was utilising ‘DataRecoverPANUP3’ function to fit Padé Approximation model and measured values for sound absorption coefficient. The example graphs to show measured and predicted values of sound absorption coefficient for 66mm thick Sample 16 and 18mm thick Melamine have been shown in Figure3.7 and Figure3.8.
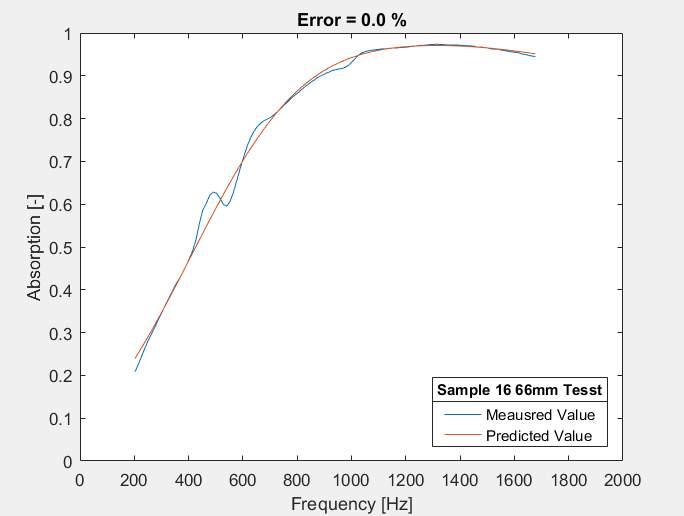
Figure 3.7 Model-data fit graph for 66mm thick Sample 16 simulation
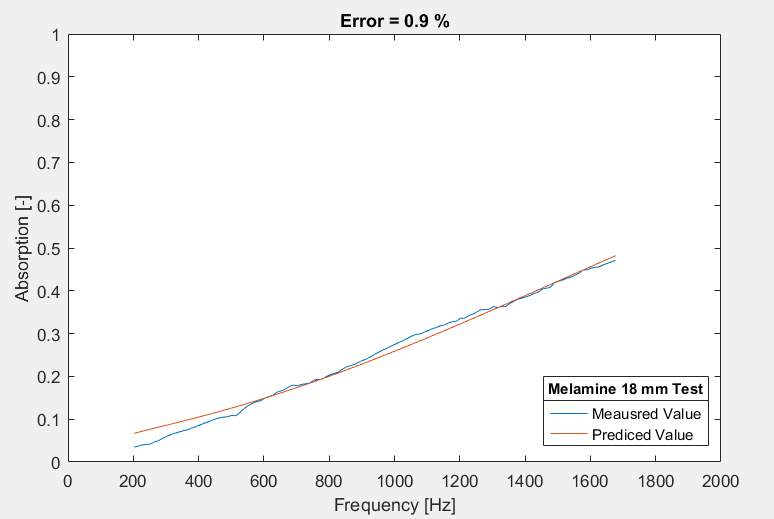
Figure 3.8 Model-data fit graph for 18mm thick Melamine simulation
By giving the estimated intrinsic parameters (porosity, tortuosity, mean pore size and standard deviation of pore size) to the model, the predicted values would be obtained. These values were the key parameters which used to calculate air flow resistivity by the equation. It should be reviewed that
σ∙h≈3ρ0c0. The results would be compared for knowing which type of material performs as a ‘good’ absorber.
The final step of the experiment was to use Alpha- Cell to model the multiple layers of different material. The main function of this software is to simulate the overall sound absorbing performance of combined materials. The model used in the simulation was Miki model and sound incident angles were set to oblique incident and diffusion. By inputting the parameters of different specimens tested previously and add them layer by layer, Alpha-Cell would automatically generate the graph of sound absorption coefficient to show ability to absorb sound for combined materials. This work was related to the material selection for automotive application. To help vehicle industries make judgement whether porous medias meet the specific requirement of different parts in a car, the prediction given by Alpha-Cell is an important reference.
4 Results
4.1 Experimental Data
The test results and modelling graph have been shown in the appendix. The parameters such as
s̅,∅,σsand
α∞of materials were calculated by Padé Approximation in MATLAB. For each type of material, the samples were set as single layer and triple layers to do two groups of tests.
σis air flow resistivity calculated by Equation2.2. The results have been shown in Table 4.1 and Table 4.2.
Table 4.1 Calculated results
| Sample16 66mm test | Sample16 21mm test | Sample14 59mm test | Sample14 18mm test | Sample 10 62mm test | Sample 10 19mm test | |
| Thickness [h] (m) | 0.066 | 0.021 | 0.059 | 0.018 | 0.062 | 0.019 |
| Mean pore size [s ̅] (m) | 3.41E-04 | 2.62E-04 | 2.57E-04 | 2.11E-04 | 1.87E-04 | 1.53E-04 |
| Porosity [∅] | 9.60E-01 | 9.60E-01 | 9.60E-01 | 9.60E-01 | 9.70E-01 | 9.70E-01 |
| Tortuosity [
α∞] |
1.10E+00 | 1.00E+00 | 1.26E+00 | 1.00E+00 | 1.23E+00 | 1.55E+00 |
| Standard Deviation [
σs] |
6.13E-01 | 6.58E-01 | 6.18E-01 | 7.46E-01 | 1.00E-02 | 1.00E-02 |
| Air flow resistivityσ | 4.64E+03 | 7.63E+03 | 1.09E+04 | 1.68E+04 | 6.58E+03 | 1.53E+04 |
| h
∙σ |
3.06E+02 | 1.60E+02 | 6.44E+02 | 3.02E+02 | 4.08E+02 | 2.91E+02 |
| Volume (
m3) |
2.07E-03 | 6.59E-04 | 1.85E-03 | 5.65E-04 | 1.95E-03 | 5.97E-04 |
| Mass (kg) | 1.36E-02 | 4.70E-03 | 2.08E-02 | 6.70E-03 | 1.77E-02 | 5.90E-03 |
| Density (
kg/m3) |
6.57E+00 | 7.12E+00 | 1.12E+01 | 1.18E+01 | 9.09E+00 | 9.88E+00 |
Table 4.2 Calculation results
To be more specific, the comparisons of each key parameters have been shown below:
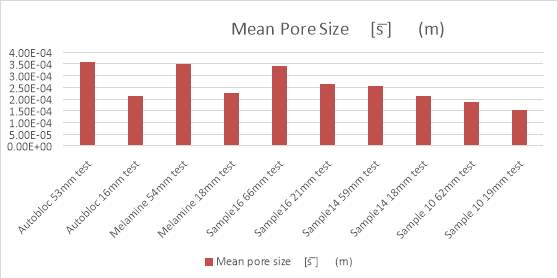
Figure 4.1 Mean pore size for each sample
The Figure4.1 shows the mean pore size of each kind of samples. Even for the same kind of material, the average value of pore size would be different. It is generally believed that for the thicker material sample, the mean pore size estimation would be more accurate.
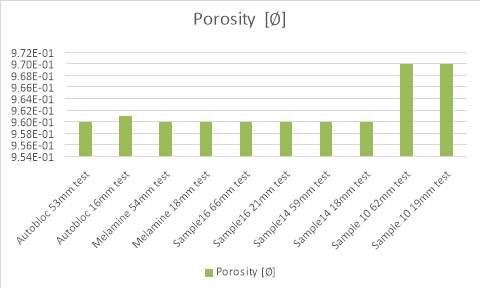
Figure 4.2 Porosity of each sample
Figure4.2 shows the porosity of each samples. Porosity
∅is the measure of ‘empty’ space in a certain volume of object. ‘0’ means no pores exist in the object and ‘1’ means full of pores. The porosities of materials are all very close. Sample 10 porosity is relatively higher.
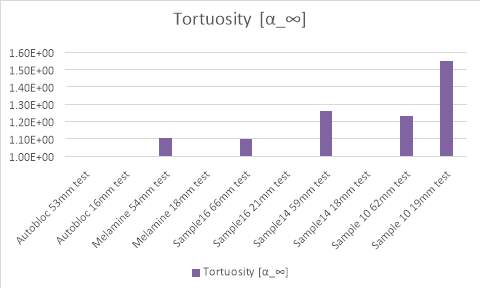
Figure 4.3 Tortuosity for each sample
Figure4.3 shows the tortuosity for each sample. Tortuosity is the parameter which describes the shape of the channel made by pores. The tortuosity is higher, the channels are more complex (i.e. Have many turns and be twisted). In common, tortuosity for porous media should r be higher than 1.
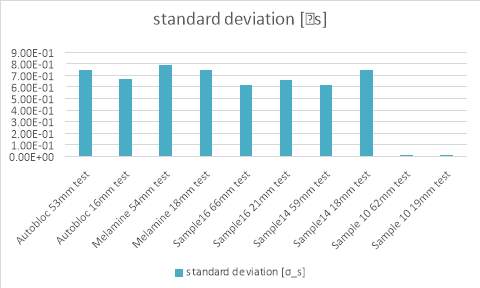
Figure 4.4 Standard deviation for pore sizes of each sample
The standard deviation of pore size for different types of material have been illustrated by Figure4.4, the high standard deviation means the difference for pore sizes is huge in a material sample. In this estimation,0.3 was set as the reference. Sample 10 seems have very average pore size.
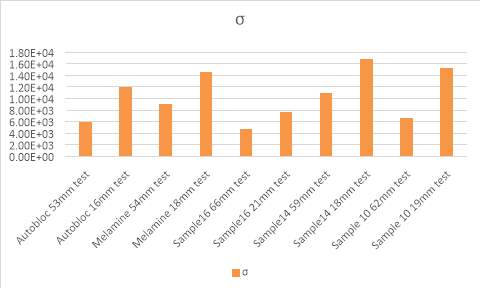
Figure 4.5 Calculated air flow resistivity for each sample
Figure4.5 provides the air flow resistivity calculated for each sample.
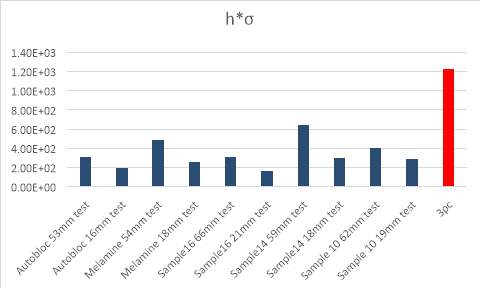
Figure 4.6 Sound absorbing abilities for each sample and the comparison with
3ρc
It has been talked already in pervious sections, the product of air flow resistivity and sample thickness provides the information about the ability of absorbing sound for pores media. The results have been shown in Figure4.6.
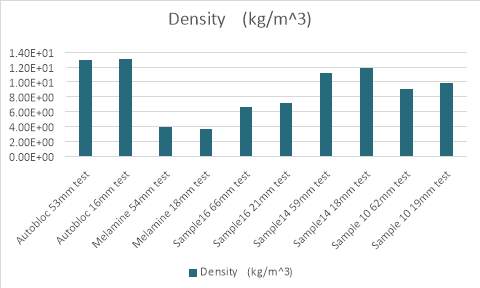
Figure 4.7 Density of each sample
Figure4.7 shows the density for each sample.
4.2 Alpha-Cell Simulation Results
The parameters of each single layer of material has been predicted by acoustical models. However in automotive industries, sound absorbers are usually combined to use. In order to find out the overall performance of composite materials, Alpha-Cell should be introduced. It is a powerful software developed by Matelys Compony which helps to simulate the overall sound absorption coefficient (
α) in different types of sound field by using acoustical model and parameters obtained. There are two main way that sound waves go through the object, oblique incident and diffusion. Usually, the noise gets into the car cabin via diffusion, however the test completed in the impedance tube would only indicate the oblique incident sound wave absorbing performance of a sample. It is particularly useful for Alpha-Cell to simulate the performance of materials in both oblique incident and diffused sound field. In this project, Miki model was used. It has been introduced that Miki model has 3 parameters: air flow resistance, porosity and tortuosity. These values have been calculated in pervious sections, the overall sound absorption coefficient curve will be generated by input these parameters.
The graphs to show sound absorption coefficient (
α) varies with frequency for combined materials have been shown in Figure 4.21-Figure 4.29
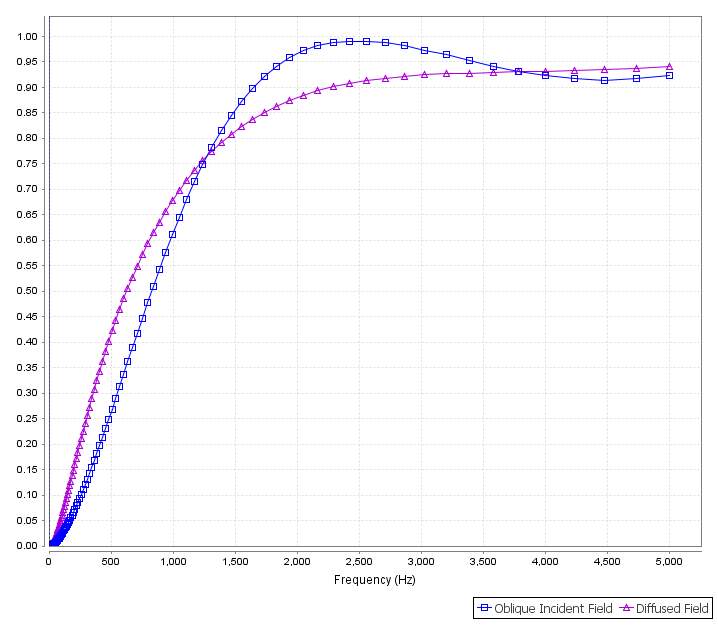
Figure 4.8 The sound absorbing performance of 34 mm Melamine (18mm, Top) and Autobloc (16mm, Bottom) composite material in oblique incident field (blue) and diffused field (purple).
In both oblique incident and diffused sound field, this combination performed very good in high frequency range(>2000Hz) with
α>0.9, however in low frequency range(<500Hz), it has relatively low sound absorption coefficient.
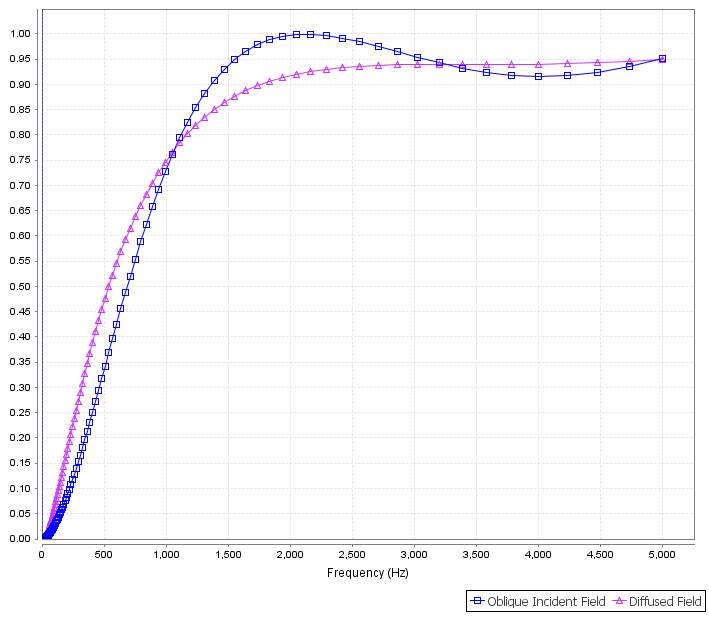
Figure 4.9 The sound absorbing performance of 37 mm Melamine (18mm, Top) and Sample 10 (19mm, Bottom) composite material in oblique incident field (blue) and diffused field (purple).
This kind of combination seems performed very well in medium and high frequency range (>1000Hz) and relatively good in 0Hz-500Hz. Practically in 1000Hz-2000Hz, the sound absorption coefficient in two different kind of sound field are all higher than 0.8.
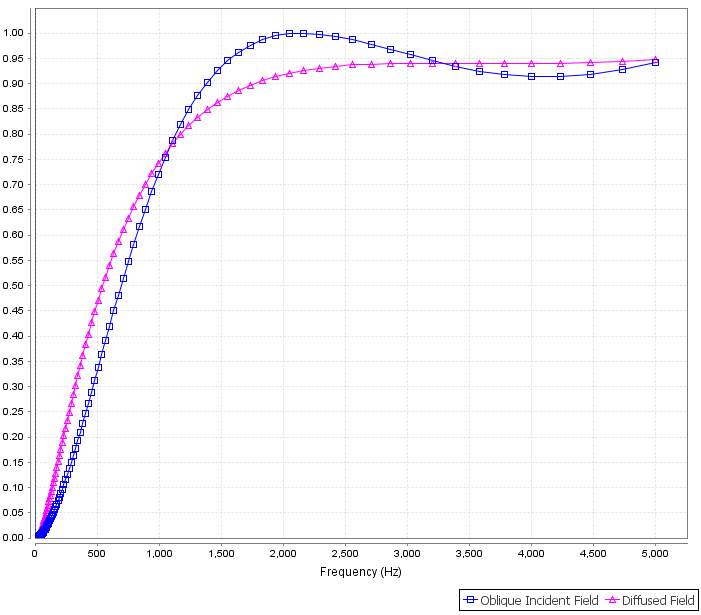
Figure 4.10 The sound absorbing performance of 36 mm Melamine (18mm, Top) and Sample 14 (18mm, Bottom) composite material in oblique incident field (blue) and diffused field (purple).
The Melamine and Sample 14 composite material performs similarly with Melamine and Sample 10 composite material. However α in this case is a little lower than Melamine and Sample 10 composite.

Figure 4.11 The sound absorbing performance of 39 mm Melamine (18mm, Top) and Sample 16 (21mm, Bottom) composite material in oblique incident field (blue) and diffused field (purple).
This combination has acceptable performance in low and medium frequency range(<2000Hz), however it is a good absorber in high frequency range.
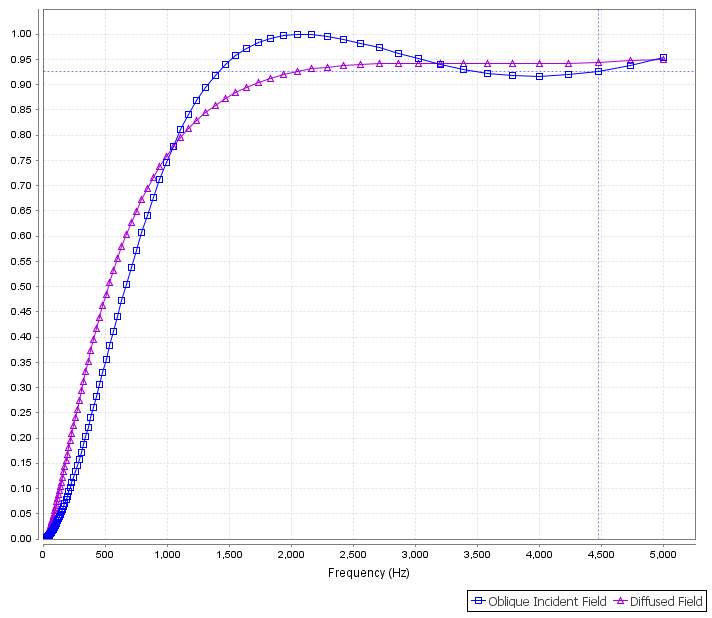
Figure 4.12 The sound absorbing performance of 37 mm Sample 10 (19mm, Top) and Sample 14 (18mm, Bottom) composite material in oblique incident field (blue) and diffused field (purple).
The combination of Sample 10 and Sample 14 has highest sound absorption coefficient in diffused field and oblique incident field with around 0.52 and 0.37 respectively in low frequency. For the frequency between 1000Hz and 2000 Hz, it performs slightly worse than Melamine and Sample 10 composite material. In addition, it has very good absorption coefficient in high frequency range with 0.9 above.

Figure 4.13 The sound absorbing performance of 35 mm Sample 10 (19mm, Top) and Autobloc (16mm, Bottom) composite material in oblique incident field (blue) and diffused field (purple).
This material has poor absorbing ability in the range at 500Hz with α = 0.28 for oblique incident field and α= 0.43 for diffused field, but has considerably good performance in high frequency range.
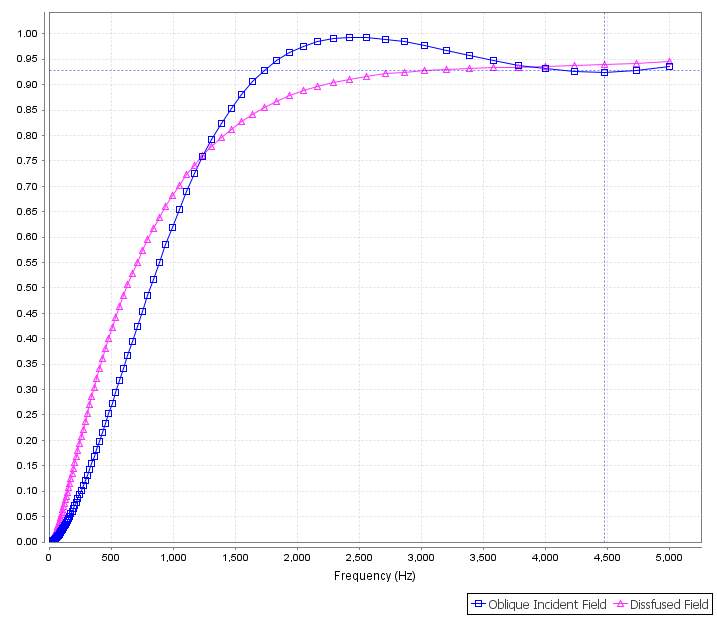
Figure 4.14 The sound absorbing performance of 34 mm Sample 14 (18mm, Top) and Autobloc (16mm, Bottom)composite material in oblique incident field (blue) and diffused field (purple).
The performance in low and medium frequency is relative low for both two types of sound field but α keeps higher than 0.85 in the frequency higher than 2000Hz.
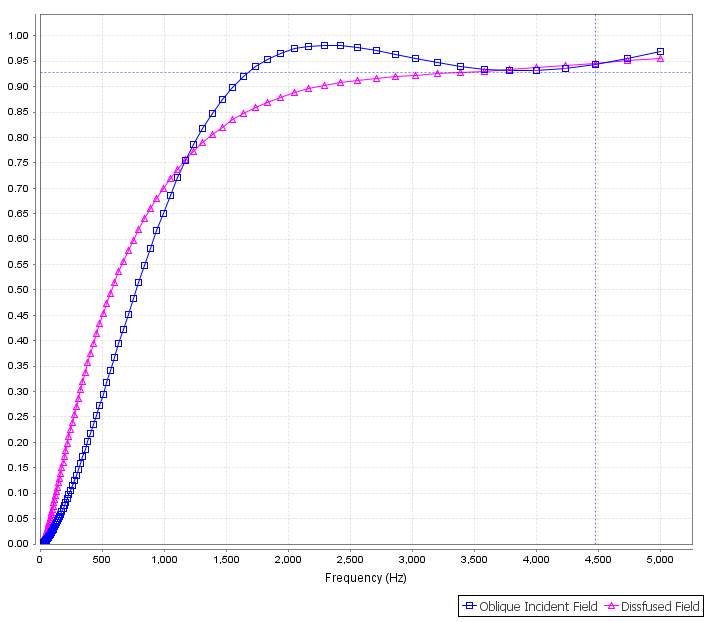
Figure 4.15 The sound absorbing performance of 39 mm Sample 14 (18mm, Top) and Sample 16 (21mm, Bottom) composite material in oblique incident field (blue) and diffused field (purple).
The combination of Sample 14 and Sample 16 is acceptable for low frequency range with α of 0.33 and 0.48 respectively for oblique incident field and diffused field.

Figure 4.16 The sound absorbing performance of 37 mm Sample 16 (21mm, Top) and Sample 10 (19mm, Bottom) composite material in oblique incident field (blue) and diffused field (purple).
Sample 16 and Sample 10 composite material pretty well in high frequency range with 0.87 of α(2000Hz as reference) for diffused field.
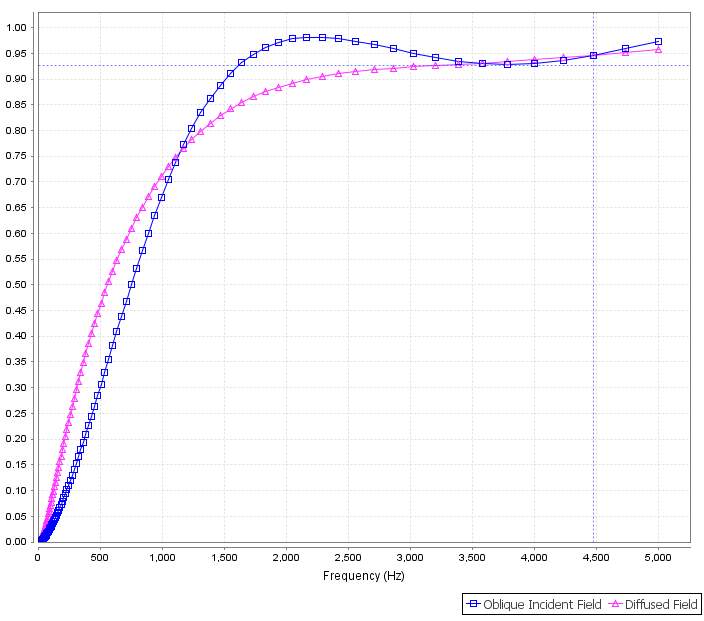
Figure 4.17 The sound absorbing performance of 37 mm Autobloc (16mm, Top) and Sample 16 composite (21mm, Bottom) material in oblique incident field (blue) and diffused field (purple).
The performance of this combination in low frequency is acceptable, however in medium and high frequency range. The values of sound absorption coefficient are relatively lower.
4.3 Results Analysis
Figures shows the overall sound absorption coefficient curves for two-layer combined material. In general, all the combinations are believed as good absorbers. For each case in different frequency range, the performance would be slightly different. These materials are used for automotive application. Therefore, the material selection should be dependent with vehicle design criteria.
It is very clear that for each combination of the material, if the sound wave was set to oblique incident, sound absorption coefficient will decay around 10% after about 2000Hz. However, for the sound diffusion, it is never the case. Therefore, in the high frequency sound field (2000Hz above), sound absorption performance of absorbers will decrease around 10% for oblique incident sound wave.
However, the combination of Melamine and Autobloc seems to be the best solution in this case. Sound absorption coefficient drops very late from 2500Hz instead of 2000Hz. In addition, after decay, it also could maintain more than 0.9. This also is the lightest composite material because the thickness is 34mm, which is the thinnest among all the group and the density of this composite material is relatively low with about
12kg/m3+4kg/m32=8kg/m3. Even though it is considered as a good absorber for high frequency, in the medium frequency, the sound absorption coefficient is only 0.62(1000Hz as reference and see Figure4.8). Thus, this material is more suitable to be used in the positions of the car where perhaps have oblique incident high frequency sound field such as doors and firewall. It seems to be reasonable because firewall is normally dealing with the noise transmitted from the engine room which is in front of it. As for the door, the fibrous materials filled into the door could possibly have large thickness and absorb the wind noise generated from out of vehicle. This combination has Melamine as reinforcement which is very light, thus it is very suitable for thickening.
For the medium and high frequency diffused noise (1000Hz above), the combination between Sample 10 and Melamine would be the best absorber solutions, which have the highest sound absorption coefficient with 0.77 (1000Hz as reference and see Figure4.9). In addition, the positions of a car which should be optimized in this frequency range would be doors and engine cover. The thickness of it is 37mm, which is considerably good for fillings of vehicle doors. This solution is competitive for Autobloc and Melamine composite. However noise generated in engine room not only transmits into cabin via firewall but also via total structure. For the engine cover, generally it would face diffused noise. The absorber also should have good heat conductivity to ensure the heat well-dissipated. Since thermal performances have not been tested, it could possibly deduce that thinner material has good conductivity. 37mm thickness is relative good and it has best performance in diffusion field. Therefore Sample10 and Melamine composite would be suggested for engine cover.
In the low frequency range (500Hz below), the sound absorbing abilities of these composite material do not have too much difference. The Sample 10 and Sample 14 seem to have best overall performance with 0.52 and 0.37 of sound absorption coefficient for oblique incident and diffused sound field respectively. (See Figure4.12) Moreover it should be noted that vehicle runs at low speed, low frequency noise domains and relevant parts should be optimized are fender and chassis. Since these two parts should be solid, so the suggestion is using Sample 16 and Sample 14 composite material as a thin coat cover the top surface of the chassis, then put vibration absorption plastic on the fibrous material coat. In addition, it also should be suggested that the interior environment of car cabin such as floor, ceiling and seats needs to apply huge amount of fibrous material.
5 Disscusion
Overall, the results were satisfied. However, there were unexpected situations happened during the experimental data modelling. The modelling solutions of some thin samples have very large errors. There are four main reasons which may cause the error. Firstly, the calibration issue. The calibration quality is very important for experimental accuracy because the characteristic impedance
Zcis a very sensitive parameter, especially for measuring thin samples. Poor calibration possibly is the main source of error. Therefore in this case, the error caused by poor calibration would be estimated as
∆A=±0.05Pa∙s/m3. Secondly, the non-acoustical parameters such as porosity, tortuosity etc. control the performance of absorbing sound. These parameters in thin specimen perhaps have certain degrees of particularity and it is not as averaging as the parameters in thinker specimen. Therefore, the modelling results of think material seems not as reliable as results of thinker material. The error of each parameter caused by non-uniform was calculated by Error=|
Parameterthick-ParameterthickParameteraverage|,So for 4 parameters air flow resistivity model, the overall error for non-uniform would be:
∆B=(3.58×10⁻⁴-2.14×10⁻⁴(3.58×10⁻⁴+2.14×10-42))2+(0.961-0.960.961+0.962)2+(0)2+(0.749-0.6710.749+0.6712)2=0.0514 Pa∙s/m3
(Autobloc as example). The third potential uncertainty would be the poor fit between the sample, tube diameters and backplate. The samples were put on the hard backplate. Either if the diameter of the sample is smaller than tube diameter or specimen did not contact with backplate properly, there will be the air gap between the sample and tube, which directly affects the accuracy of the experiment. However, if it is larger than tube diameter, those non-acoustical parameters include the thickness would be changed and further cause the error in data measurements and air flow resistivity calculation. It may assume that the error of poor-fit material could be
∆C=±0.02Pa∙s/m3.Finally, the experiment environment also could be the source of error. This experiment was completed in a relatively noisy environment, the impedance tube was put on the test bench which was also used to do structure vibration test. The vibration would be transmitted via test bench which affect the experiment. The error caused by environment interference was estimated as
∆D=±0.02Pa∙s/m3. Therefore the overall error can be calculated as:
∆Z=∆A2+∆B2+∆C2+∆D2
=0.052+0.05142+0.022+0.022
=0.077Pa∙s/m3
The overall error seems quite large. Thus, to get good calibration quality, well-cut samples and the relatively no-interference environment is desirable for getting expected accurate results. This experiment is repeatable and so it is expected to repeat the work to make it more accurate.
6 Conclusion
In this study, 100mm diameter 2 microphones impedance tube was used to test 5 fibrous material samples, the data was used to compare with Padé Approximation results and further calculate the non-acoustic properties such as porosity, mean pore size, tortuosity etc. These parameters are very important for predicting the sound absorbing abilities
∙h, by comparing with
3ρc=1229.1 kg/m2∙s, Sample 14, Sample 10 and Melamine are three best absorbers among 5 materials. Particularly for Sample 14, the ability of absorbing sound grows significantly with its thickness. Melamine has lowest density with
4kg/m3. Thus for the single layer of fibrous material, Melamine would be the most light material while keeping good sound absorbing performance. To consider about the vehicle design noise criteria and the prediction given by Alpha-Cell, in the high frequency range, Melamine and Autobloc composite material has the best sound absorption performance, which can be applied as doors fillings and firewall coat. However for the medium frequency, Sample 10 and Melamine composite material would be the best absorber. It is particularly useful for engine coat and competitive with Melamine and Autobloc composite in terms of doors fillings. As for the low frequency noise, there is no much difference in sound absorbing performance for all of materials. The only thing that is worth noting is Sample 14 and Sample 16 composite material has very tiny advantages, the relevant suggestion in this case is using it with vibration absorbing plastic as floor coat. Because fibrous porous material is light, cheap, recyclable and have outstanding sound absorbing abilities, therefore making a lot of use in the interior environment of vehicle such as floor, ceiling and seats is suggested for vehicle company. This experiment has some obvious uncertainties which has been discussed such as calibration issue, specimen fit problem etc. The overall error has been calculated as
±0.077Pa∙s/m3 .It is expected to repeat it in order to get more accurate results, which is meaningful for vehicle industries to do automotive design and noise absorbing material selection.
Reference
1. Gabriella, C. Automotive Sound Qquality-Powertrain, Road and Wind Noise. SOUND&VIBRATION. 2009.
2. BMW Noise Troubleshooting:. autohausAZ. [Online] Autohaus Arizona, Inc., 2008. [Cited: 17th March 2017.] http://www.autohausaz.com/bmw-auto-parts/bmw-noises.html.
3. MICHELIN. Noise and Comfort. Michelin tires. [Online] [Cited: 17th March 2017.] http://thetiredigest.michelin.com/performance-noise-and-comfort.
4. JAWS. Lecture of Automotive Noise Control. [Online] 14th July 2015. [Cited: 20th March 2017.] http://www.qichegeyin.com/news-307.html.
5. SINA. Keep away from the noise, the recommendation for automotive noise control. SINA AUTOMOTIVE. [Online] 13th January 2014. [Cited: 22nd March 2017.] http://auto.sina.com.cn/news/2014-01-13/17421264035.shtml.
6. Fusheng. Han, Gary. Seiffert, Yuyuan. Zhao and Barry.Gibbs. Acoustic absorption behaviour of an open-celled aluminium foam. JOURNAL OF PHYSICS D: APPLIED PHYSICS. 2003, 294-302.
7. Takashi Tsujimoto, Nao Hosoda and Hiroshi Uyama. Fabrication of Porous Poly(3-hydroxybutyrate-co-3-hydroxyhexanoate) Monoliths via Thermally Induced Phase Separation. Polymers. 2016, 10.3390/polym8030066.
8. K.V.Horoshenkov. Characterisation of acoustic porous materials. Proceedings of the Institute of Acoustics. 2001, Vol. Pt.1.
9. M.T. Fadzlita, K.B. Yeo, W.H. Choong and M. Melvin. Absorption Coefficient of Acoustic Coir Fibre Panel and Effects of Varying Percentage of Perforated Plates. Journal of Applied Sciences. 2014, 3106-3109.
10. Nichols, R.H.Jr. Flow-resistance characteristic of fibrous acoustical materials. Acoustical society. 19, 1947, Vol. 5, 866-871.
11. K. V. Horoshenkov, J-P. Groby,O.Dazel. Asymptotic limits of some models for sound propogation in porous media and the assignment of the pore charachteristic lengths. Journal of Acoustical Society (America). 2016, 2436247.
12. Johnson-Champoux-Allard (JCA) model. Acoustical Porous Material Recipes. [Online] [Cited: 5th April 2017.]
13. Stinson, Y.Champoux and M.R. On acoustical models for sound propagation in porous materials and the influence of shape factor. Journal of Acoustical Society (America). 1992, 1120-1131.
14. Ingard, K.Uno. Rigid porous absorbers I. Notes on Sound Absorption Technology. 1994.
15. Delany-Bazley model. Acoustical Porous Material Recipes. [Online] MATELYS. [Cited: 5th April 2017.]
16. Y, Miki. Acoustical properties of porous materials – Modifications of Delany-Bazley models. Journal of Acoustical Society (America). 1990, 19-24.
17. Improvement of the Delany-Bazley and Miki mdles for fibrous sound-absorbing materilas. T.Komatsu. 43.55.Ev, 2007.
18. K.V.Horoshenkov, K. Attenborough and S.N. Chandler-Wilde. Pade approximants for the acoustical properties iof rigid frame porous media with pore size distributions. Journal of Acoustical Society (America). 1997, 1198-1209.
19. Determination of Sound Absorption Coefficient and Impedance in Impedance Tubes, Part 2. Geneva, Switzerland : s.n., 2001. ISO10534-2:2001.
20. Kuttruff, H. Acoustics, An Introduction. London and New York : s.n., 2007. ISBN 0-203-97089-6.
21. Material characterization. [Online] Materiacustica, 2007. [Cited: 10th April 2017.] http://www.materiacustica.it/mat_UKProdotti_3Mics.html.
22. What is the actual airflow resistivity of nonwovens. A.I. Hurrell, K.V. Horoshenkov.
APPENDICES
Cite This Work
To export a reference to this article please select a referencing stye below:
Related Services
View all


Related Content
All TagsContent relating to: "Automotive"
The Automotive industry concerns itself with the design, production, and selling of motor vehicles, such as cars, vans, and motorcycles, and is home to many multi-billion pound companies.
Related Articles

DMCA / Removal Request
If you are the original writer of this dissertation and no longer wish to have your work published on the UKDiss.com website then please: