Managing International Business Organisations
Info: 9205 words (37 pages) Dissertation
Published: 10th Dec 2019
Tagged: ManagementInternational Business
Table of Contents
2. Main Resources & Firm-Specific Advantages
1. Introduction to VC
Visscher-Caravelle (VC) is a company that designs and produces floor mats for the original automotive OEM industry. It is one of the three subunits owned by the VC Automotive Group. The other two are VC Coatings and Vicim. They are a family-owned business that was founded in 1950 under the name Visscher-Matten. In 1988 Gerard Van Dalfsen bought the company and in 1990 it became VC, which is the name it is known by now. Since then it has been working on expanding and internationalizing. The process of internationalization is a precarious one, and not all companies manage to compete on an international level (Welch & Luostarinen, 1988). However VC used internationalization to improve their operations. In 1996 it opened up its first foreign production facility in Poland. The efforts didn’t stop there, and in the years 2011 and 2012 they established VC Asia, VC China & VC Mexico operations. Today the company has sales offices and production facilities in four continents: North America, Europe, Asia Pacific and Australia (See appendix figure 1).
The VC organization takes a customer-oriented approach to their brand image. The vision of the organization is to become the favorite car mat manufacturer in the world. Team spirit and creativity is valued in the company as well as design and flexibility and they believe that these are the core values needed to achieve customer satisfaction. Their mission is to do all this while still being consumer-friendly and trendsetting. VC wants to anticipate creative developments, by creating a well-organized, effective and efficient production, with a global sales network. By understanding that the automat deserves attention in the automotive sector and taking pride in their work, they can work towards this goal. A lot of focus is placed on quality and continuous improvement. They also take pride in their work relationships and show this with their timely deliveries and compliance with specification, and their efficiency.
The organization also takes special care to be environmentally conscious. They understand that their customers are looking for suppliers that are socially responsible so they take note of social, ethical and environmental issues. Their product is developed in such a way that the waste of the car mat is 100% recyclable into a plastic granule, which can then be used in many ways in the plastic industry. This technique has been transferred to their subsidiary company VC Coatings. The disclosure of information to customers and shareholders is taken very seriously, and they teach their employees the importance of sustainability. They even carry an ISO 14001 certificate.
In 2009 there was a strong growth in the carmat volume in Europe. This led the way for VC to grow and become stronger. Today VC enjoys 17% of the global car-mat market share and 45% in the European market (See appendix figure 2). While their long-term goal is to be the favorite car mat producer in the world, they are pretty much the favorite in Europe already.
Since they are a family owned business they value the culture of the company as much as the profits. They believe that they have an advantage as a family owned company because they do see profits as the end-game and instead see it as a way of expanding their business. They value their employees and focus on developing good relationships with them and encourage teamwork within their organization.
While creating the car mat they work closely with their customer to make sure that the customer will get exactly what they want. The company specifically focuses on innovation and integrates it into the company on all levels and in all their activities. They have a wide range of products from customized car mat with materials such as polyamide, polypropylene and polyester to mass-produced rubber car mats. They also create products that have extra purposes such as slip resistance and sound reduction. The VC Laboratory opened up in 2008 to better their response time for new features that their customers asked for.
In this essay we investigate VC by first looking into their main resources and firm specific advantages. This is followed by an assessment of the competitive intensity of VC’s industry in order to shed light on VC’s competitive position. Lastly financial performance is analysed with an array of financial measures. The aim of this essay is to construct a comprehensive company analysis that builds on scientific literature and theoretical models, as well as company information and data.
2. Main Resources & Firm-Specific Advantages
According to the resource-based view, resources can provide the firms with a foundation for a competitive advantage. The issue lies in the proper application of the various resources a particular firm has to allocate (Penrose, 1959). Theory posits that should firms find themselves able to turn resources into sustainable competitive advantages those resources will effectively be characterised by imperfect imitability and imperfect-substitution within the relevant market (Barney, 1991). It can be said that when assessing the applicability of disposable resources, companies may better identify the nature of its key resources and where its internal advantages lie; the VRIN framework helps in a basic way to gauge whether resources match these criterion.
Valuable: A company’s key resource(s) should be used to create a value-added strategy; this valuable resource should give the company an improvement from its rivals.
Rare: A company’s key resource(s) should be relatively rare in hopes of yielding a strategic competitive-advantage.
Inimitable: A company’s key resource(s), should not be duplicable in the sense that rivals should not be able to copy or easily replicate the strategic end-asset.
Non-substitutable: A company’s key resource(s), embedded in its value-adding strategy should not enable its market rivals to easily respond with a substitute.
Defining resources in its broader meaning, they may be described as “…Economic or productive factors…key to (undertaking and) achieving a desired outcome…” (Verbeke, 2013), furthermore business resources assume various forms such as land, buildings, financial capital, skilled labor, upstream, downstream, administrative knowledge, etc. Alain Verbeke goes on to distinguish that unique resources are what enable an organisation to attain an firm-specific advantage (FSA). This is certainly the case for the VC company within their home region (European market), where they now have come to enjoy a substantial 45% of total market share for automobile mats. More importantly, these larger sales volume within regional markets define what sort of player VC is in the market, in other words, a world player.
Applying this knowledge of resources to the VC company, considering their 2015-2016 business year, we have identified various main resources. The first is financial, namely higher average consolidated profits, and equity (working capital), which rose to EUR 5.6 million and EUR 14.7 million respectively in 2015. Consolidated profits are a reasonable financial measure of joint operations, and considering the 3-in-1 style organisational structure the VC Automotive Group implements, the consolidated accounting statements enable the company to realistically express the company’s current financial profitability of all the subsidiary operations as if they were one entity. Additionally, working capital can measure a company’s ability to cover short-term debt, and may be used to indicate the short-term financial viability of the VC company. Considering working capital reported in 2015 reached a record high level over the past five years, it indicates VC has no problem paying its creditors, and has increased the amount of disposable funds it has available for day to day operations. This also helps demonstrate a clear point to potential investors, namely that the company is growing in its operational-efficiency.
Upstream knowledge contained within the VC company may also be identified as a main resource. Specifically this upstream resource is innovative R&D (technical knowledge), which is broken down to design, engineering & product-research, taking place on a daily basis at the VC development centre. Oh & Rugman (2012) consider upstream R&D activities as a key determinant of global activities, which indeed may help a business to diversify itself better, as well as generating possibly new capabilities inside the company. Rolling back the clock to 2008-2009 we notice an interesting switch the VC company made, namely the decision to shift from the original equipment supplier (OES) market to the original equipment manufacturers (OEM) market. The benefits of this shift were perhaps latent at the start as it meant VC had to incur big expenses to alter and at times completely change its production processes, R&D activities, quality management as well as supply chain requirements, which are at a higher standard in OEM than in the OES market. This overhaul not only worked, but in hindsight helped save the the company from the 2008-2009 financial and economic crisis, which negatively impacted a great deal of players in the automobile industry. Curiously, this OEM switch marked the point from which VC was able to lift themselves out of the 2008-2009 economic crisis-state and facilitated their rapid growth and expanding production volumes to their current levels.
Downstream resources, characterised by strong sales (and market) knowledge may also be found within and identified as a main resource for VC. The motivation for this statement lies in the greater power and effectiveness their organisation’s internal sales network, which appears to have had a strategically positive impact on the firm. VC’s strategic and tactical focus has received substantial support from the company’s specialist employee sales teams. These downstream resources have certainly enabled VC to increase their global market presence, grouping customers by continent, which enabled them to respond to international customers needs. In short, the creation of an internal company sales network to increase global market presence by determining and meeting international customer requirements, is regarded as a main resource for the VC company. (see appendix figure 2).
In addition administrative resources are apparent within VC, embodied by its supportive organisational structure and company culture. To clarify, the VC Automotive Group, whose primary focus is the production of car mats for various automobile industry brands, is comprised of three entities: VC, VC Coatings, and Vicim. VC produces textile car mats, VC Coatings produces basic and multi-layered mat coatings and supplies them to VC, and Vicim produces the TPE (rubber) car mats. Essentially this 3-in-1 configuration a helps support the firm’s mission & strategy, as these subsidiaries are focused on the same business model. The absence of this flexible and consolidated organisational structure, may have disabled VC from realizing the hard-fought gains they enjoy today in their home market. This structure has marginally expanded over the last five years, accommodating a variety of talented hand-picked employees, which would optimally fit into the VC family company culture. Approximately 740 persons are hired in the VC subsidiary, 40 employees work at Vicim, and only 20 persons are employed at the VC Coatings subsidiary; in total roughly 800 employees.
When assessing the company’s financial, operational and sales performance today, one may notice signs of reasonably high employee talent within the VC organisation, partially attributable to the way they foster a close-knit family culture among employee teams. This potentially sets VC employees apart from those within non-family companies, as Anderson and Reeb (2003) empirically suggest, “…family owned firms are an effective company-structure and performe significantly better than nonfamily firms,” because:
Families have longer investment-horizons, which leads to better investment efficiency
Family businesses show better accounting and market performance than non-family firms
Families comprehend their founded businesses better
Families are less prone to agency-dilemmas than nonfamily firms
Long-term view: handing the business over to the next generation
It can be suggested that the combination of these family firm advantages constitutes a potential strength, where VC employees may see a more direct impact of their skill-set contributions, and feel a stronger sense of mutual benefit and reaching fuller potential, enacted through VC Academy training programs. This sustainable and long-term oriented approach may continue to serve the organisation well, supporting its bottom line by cultivating talents to make the company more innovative and more efficient. Higher recognition of the role of innovation as well as mutual commitments between employees and managers are by products of an inclusive family-firm culture, and may therefore be regarded as a key administrative resource.
Firm-specific advantages
Having identified the various main resources within VC, we touch on the topic of firm-specific advantage, which is what helps differentiates one company from another, in competitive terms. In combination with the competitive positioning information provided in section 3, the VC Automotive Group’s firm-specific advantage is listed as:
Manufacturing a range of chemically-coated textile and TPE car mats, covering a large group (45% market share) of European automobile industry OEM customers.
A distinction should be made between location bound and non-location bound advantages. As a general rule Verbeke (2013) indicates that some FSAs are too unique and challenging to replicate abroad, in other words, some FSAs are bound to a location due to the immobility of the resources used to craft that specific advantage. Regional supply chain networks and R&D centres are examples of FSAs which traditionally may only be exploited in one location. In contrast, internationally transferable FSAs are not relegated to a specific location, and will retain their value as companies go overseas. This is precisely where the paradox of internationalisation lies for VC, namely the concern of creating FSAs which are not bound by location, and can be transferred across borders without a reduction in its specific value. It can be reasoned that VC’s market share advantage is regional, and thus not easily transferable overseas, additionally its upstream (R&D) advantage is also location-bound as it is solely based in Genemuiden. Downstream advantages (sales cells) for the company exist of tacit regional knowledge, though costly, are also internationally transferrable and are challenging to imitate (thus a potent FSA). Lastly the administrative strengths (governance related knowledge) can be used to alleviate increased costs of conducting business overseas (Verbeke, 2013) are non-location bound
Core Competence
Prahalad and Hamel (1990) encourage firms to ultimately develop core competencies, that is to say “…vital firm-specific advantages, routines and recombination capabilities..”. It follows, that the cultivation of a core competency can be a source of great success for any company. Core competencies can be broken down into various common components which may be identified within a business organisation. With regard to VC’s core competency, they may be comprised as such:
1. Shared Knowledge: evident through high-degree of supply chain cooperation
2. Company Routines: evident through repetition of best-practices over and over to make FSAs efficient
3. Recombination Capabilities: evident through the integration of existing resources with newly accessed resources (integrating various technologies)
Prahalad and Hamel (1990) further elaborate that core competences must be subject to certain criteria, in order to be truly identifiable as such. In brief a core competency must:
1. Be difficult for rivals to imitate
2. Yield access to a variety of markets
3. Contribute significantly to benefits perceived by end-users
4. The loss of the core competence would create a negative impact on the company’s current and future performance
Building up to a definition, we may describe VC Automotive Group’s core competency as:
Designing and producing innovative (value-added, competitively priced, state-of-the-art, 2-or-3 dimensional, functional and customisable) textile and TPE mats.
Running this core competency through the above mentioned criteria list, we identify that the relatively-high technological intensity incorporated at during upstream activities at VC ensures that their primary products are challenging to replicate. This core competence grants access to various new overseas OEM markets. VC translates innovation, product-quality and car safety requirements into distinctive and customisable products, which makes added-value a reality for their customers. Lastly it can be said that the loss of this core competence would certainly have a negative impact on current sales in their home market region, which will result in a future erosion of their market share.
Cultivation of core competencies should yield core-products at Visccher-Caravelle, and this is found to be the case. This development of core products may result in the creation of strategic business units, or subsidiaries, where the core products may be used to create specific end-products, which may be distributed across separate market regions. The VC Automotive Group’s core products may be described per subsidiary as:
VC core product: innovative textile car mats
VC Coatings core product: innovative multi-layer chemical car mat coatings
Vicim core product: innovative TPE (rubber) car mats
The combination of the advantages discussed in this section give the VC company a distinctive position in the European market, and this knowledge may be utilized to extend its global presence and competitive position.
3. Competitive Positioning
Although the results of a firm’s competitive position can be found quite easily in the form of market share, net income or profit margins, there are several ways to view its causes. The previous section used the resource based view, which looks at firm’s internal resources and capabilities as a source of competitive advantage. A firm must exploit these resources to its best in order to gain and sustain competitive advantage. However, this perspective somewhat neglects the effects of the external environment. The Porter’s five forces model (Porter, 1980) is suited well for analysing this aspect. By this model Porter argued that the state of competition in an industry and accompanying profit potential depends on the following factors: Threat of rivalry, threat of new entrant, bargaining power of customers, bargaining power of suppliers, and the threat of substitutes.
Essentially, the overall state of competition gives an industry’s (financial) attractiveness, while the five forces together illustrate in more detail which aspects of the environment form a threat that a firm needs to cope with in order to achieve sustainable competitive advantage. In this section, Porter’s five forces model is applied to VC’s OEM car mat industry by going through each force and discussing the elements that each force is made up of. This model is useful in that it gives a good overview of the competitive intensity of VC’s industry as well as a better appreciation of VC’s market position and threats to its consolidation. The following discussion is based on the explanation of Hollensen (2014, pp. 107-109) and orally communicated company information from Ms. Heetebrij (p.c., 25 April 2017).
Threat of Rivalry
This refers to how fierce VC has to compete with its rivals to sell its products. Important elements to consider are: industry concentration, market growth, fixed costs, product complexity and presence of switching costs. Their effects are as following:
- Industry concentration: If market share is spread over many competitors, rivalry is strong, while the presence of a market leader reduces competition.
- Market growth: A mature market with little to no growth leads to stronger rivalry.
- Fixed costs: Fixed costs need to be covered by sales. The higher fixed costs, the likelier a firm is willing to reduce prices to cover them.
- Product complexity: Very differentiated products are hard to copy and therefore relate to weaker rivalry.
- Switching costs: If the buyer has spent a lot of money and effort related to a product, it is less likely to switch to a competitor, so rivalry is weaker.
In sum, it can be stated that rivalry is stronger if a firm operates in a fragmented industry with limited market growth, high fixed costs, undifferentiated products and no switching costs. In the OEM car mat industry, market share is relatively concentrated: VC has 45% market share in Europe and 17% globally (Heetebrij, p.c., 25 April 2017). According to Hollensen (2014), being so close to a 50% market share in Europe implies that VC holds a significant cost advantage in the region, reducing rivalry intensity. Additionally, the company reports only a handful of major competitors per region.
The second issue is market growth, which is expected to be very limited in rich economies, but quite strong in developing countries like India and China. Together with other growth markets, these countries will account for a 19 million increase in assembled cars volume by 2023 (Stürmer & Lau, 2017). Consequently, VC can avoid profit-reducing rivalry by expanding to these growth markets, not only for efficiency-seeking incentives, but for market penetration too.
Regarding fixed costs, VC mass-produces car mats because each and every car of a specific model uses their product. This requires high up-front capital investments in large plants and many employees who to a certain extent have fixed contracts. Wages alone account for 27% of revenue (VC financial statements, 2015). This means that filling capacity to cover fixed costs is quite important for VC and competitors, stimulating competition as a result.
Looking at the continuum that encompasses commodity goods like sugar on one end and tailor made high-tech products like certain software applications on the other, it can be concluded that VC’s car mats are somewhere in the middle. The car mats are essentially pieces of cloth that are mass produced, but these have to be designed specifically to meet a car model and local regulations of each region it is sold in. A moderately complex product relieves some competitive pressure. Finally, switching costs are low, because car makers put their car mat orders to tender for each model they launch. The winning car mat manufacturer gets full rights to one car model. Overall, the different elements indicate a moderately high threat of rivalry. However, this has not stopped VC from dominating the European region.
Threat of new entrants
The easier it is for newcomers to enter the market, the stronger competitive pressure will be. Newcomers are repelled by entry barriers like high economies of scale, strong product differentiation and high switching costs. The effects of these elements are explained below.
- Economies of scale: As production volume increases, average unit costs go down. This implies that a competitive unit price can only be achieved by producing in large quantities, requiring high up-front costs for newcomers.
- Product complexity: If a product has unique characteristics or a superior quality, buyers are more likely to be retained, while newcomers will struggle to develop a competitive product.
- Switching costs: If the buyer is vested into a product financially, the buyer is less likely to switch, so snatching market share by newcomers is more difficult.
Given that VC uses mass production facilities and has delivered over seven million sets of car mats in 2015 (Heetebrij, p.c., 25 April 2017), it is evident that the industry involves economies of scale. This clearly is an entry barrier in VC’s industry. Regarding product complexity, it was mentioned before that car mat sets are simple, yet strongly adapted products. While mat-making technology and knowledge may be available for newcomers, the skills and resources necessary to design mats suited to a car model and each country’s regulatory standards is less easy to obtain. Consequently, there is a moderately high entry barrier in this aspect.
As mentioned earlier, switching costs are low as a result of the tender process. Every party that would like to supply car mat sets is able to participate in this process, meaning that this element is hardly an entry barrier at all. Despite this, the strong presence of economies of scale and moderate product differentiation act as entry barriers to such an extent that the threat of new entrants can be deemed low to moderate.
Bargaining power of suppliers
VC is a supplier of car mats to automotive producers, but VC itself also relies on inputs provided by suppliers that provide VC with raw materials, components, machinery and services. If a firm is heavily dependent upon a supplier, then the supplier has high bargaining power, and as a result the supplier is able to ask high prices for the goods or services it is delivering (Hollensen, 2014).
The bargaining power of suppliers to an industry is high if the following conditions are met (Porter, 1980),(Hollensen, 2014):
- There are few suppliers and these suppliers are more concentrated than the firms they supply to.
- There are costs associated to switching from supplier.
- The goods that are being supplied are unique.
- Suppliers can threaten to integrate forward, in VC’s case meaning the suppliers move into the car mat industry.
- Buyers, in this case VC and its competitors, cannot threaten to integrate backwards. This would mean that VC would cut out its suppliers by producing its own inputs.
- The suppliers are not heavily dependent on the particular industry.
Per region, there are a handful suppliers that provide VC with its raw materials. However, there are some switching costs related with changing from supplier because setting up a new contract and aligning the supply chains to the new supplier takes time. The two main materials used in the car mats are textiles and TPE, a form of rubber, thus the commodities are not unique. There is a threat that suppliers integrate forward; this is exactly what VC did itself. Also, VC has the possibility to integrate backwards. The goods that are being supplied can be used in a lot of other industries and therefore suppliers are not heavily dependent on the car mat industry. The bargaining power of suppliers is low to moderate.
Bargaining power of customers
VC produces car mats and supplies them to the automotive industry, its buyers. Buyers with a high bargaining power are able to ask lower prices for the goods that they are purchasing and therefore press down on the revenue and profits of their suppliers, in this case VC.
The bargaining power of buyers is high if the following conditions are satisfied (Porter, 1980),(Hollensen, 2014):
- Buyers obtain the goods in large quantities.
- Buyers can threaten to integrate backwards, meaning that car manufacturers would also start producing the car mats.
- The products are standard and undifferentiated.
- There are a lot of other suppliers the buyers can choose from.
- The profit margin of the buyers is thin
- The products the buyers are purchasing is of key importance to the quality of the product
Porter (2008) mentions specifically that OEMs can gain significant bargaining power if they can influence the purchasing decisions of customers downstream. In the case of VC, they would need to promote the component it is manufacturing, the car mat, to the end users. The goal is to create awareness among customers and create preference for their products. This is called ingredient branding (Hollensen, 2014).
We now move forward by looking at the criteria mentioned before. Automobile manufacturers do buy the car mats in high volume, considering the large volumes of cars that are being sold annually. Buyers could decide to integrate backwards, but it is most likely that this would be more costly to them because this would require them to hire new employees and purchase new manufacturing plants and equipment. The profit margin of VC in 2010-2015 was 4,67% on average, which would mean that without the expertise of VC automobile manufacturers are likely to be have a thinner profit margin or even a loss and therefore would not want to allocate any resources to the production of car mats. Car mats are relatively standard but VC promotes the great amount of differentiation it is capable of producing. Also, the profit margin of automotive manufacturers is not very large, and the car mats are not of key importance to the success of the automotive industry. All factors considered, we assess that the bargaining power of customers is quite high.
Threat of substitutes
If there are substitutes to a product, then the substituted product and its industry become less attractive and less profitable. Especially if profits are high in an industry then competitors are more likely to want to gain from these profits by competing with substituting products. Substitute products are goods that, as a result of changing conditions, that can be replaced by each other (Nicholson, 1998). For example, Coca Cola and Pepsi Cola are substitute products of each other. The threat of substitution is high if the following conditions are fulfilled (Hollensen, 2014):
- Customers are willing to substitute;
- There are low or no switching costs;
- The relative price and performance of substitutes are attractive, for example a substitute that is both less expensive and has higher performance than the original product.
The profit margin of VC for the period 2010-2015 was on average 4,67% (see Financial Performance chapter), which means VC has profits to spare and therefore it is an attractive target. Looking at the three factors, we made some findings. First of all, automobile manufacturers might be willing to substitute to a substitute product if they are unhappy with VC or if there are alternatives that are more attractive. However, customer satisfaction currently is not a problem with VC: it has ISO 9001, ISO/TS 16949, ISO 14001 and Ford Q1 certifications, all formal recognition of excellent quality and customer satisfaction. (VC.nl).
Switching costs can be created by VC to prevent customers from going to the competition and they don’t only need to be monetary, but can also be psychological. Hollensen (2014) explains that they can be built up by the creation of strong, distinctive brand personalities, and by providing a price that is proportionate with perceived consumer values. VC is constantly emphasising the quality, diversification abilities and innovativeness of its products, thus it is making a good effort of building up psychological switching costs.
VC is offering the best quality and price package, at least in Europe, because it is a market leader there with a market share of 45%.
Concluding, because customers are not willing to substitute, VC is continually making efforts to create psychological switching costs, and because the price and quality combination it is offering is more attractive than competitors, we find that the threat of substitution is low.
4. Financial Performance
In this section, the financial performance of VC will be analysed through 5 different aspects: General revenue development, Liquidity, Profitability, Safety and Efficiency. In each aspects, several ratios are selected as measurements based on the guideline of Financial Statement Analysis For Small Businesses (Virginia Small Business Development Center Network, 2011).
General revenue development
Revenue is the money a company takes from conducting its regular business operations. By analysing the revenue from the most recent period to the revenue from previous period, the comparison can give an indication how well the business is performing.
Table 1 Revenue VC gives the revenue of VC from 2011 to 2015 and the growth rate on revenue from previous year.
Table 1 Revenue VC
| VC | 2011 | 2012 | 2013 | 2014 | 2015 |
| Revenue | € 85,678,659 | € 72,994,350 | € 76,728,707 | € 90,483,935 | € 106,932,064 |
| Growth Rate | 14.00% | -14.80% | 5.12% | 17.93% | 18.18% |
As can be seen from the table above, VC suffered a huge decline in financial year 2012, which was strongly affected by the European debt crisis. It took nearly 2 years for VC to recover from such big loss.
From financial year 2014 to 2015, VC kept expanding their expansion on their business, although it is not significant (a growth rate of 0.25%). This conclusion is drawn by ignoring the impact of the inflation.
Liquidity
The liquidity of the financial performance measures a company’s capacity to pay its debts as they come due. There are two ratios to evaluate the liquidity: Current Ratio and Quick Ratio.
Current Ratio: Current Ratio judges how able a business is to pay current liabilities by using the current assets only, which measures the ability of a company to cover its short-term liabilities with its current assets. Current Ratio is calculated as:
Total Current AssetsTotal Current Liabilities
The general rule of thumb of current ratio is 2/1, however, an average level of industry will be a more appropriate standard to compare with.
Table 2 Current Ratio VC
| VC | 2011 | 2012 | 2013 | 2014 | 2015 |
| Current Ratio | 1.38 | 1.42 | 1.34 | 1.50 | 1.58 |
Table 2 Current Ratio VC shows the 5 years’ Current Ratio of VC (2011-2015). Figures shows VC maintains the Current Ratio in a relatively stable level. From the figures of 2013 to 2015 we can see a slightly upward trend, which may indicates that VC is strengthen its ability of covering its short-term liabilities.
The Current Ratio of Autoneum in 2015 is 1.30, which is lower than VC. From the comparison, we can conclude that VC has a stronger liquidity on covering the current liabilities by using current assets.
Quick Ratio: Although the results of Current Ratio shows VC a good sign of managing the liquidity, Quick Ratio should be analysed. Quick Ratio is a more precise measure which excludes inventory (the least liquidity items in current assets) from assets compared to Current Ratio. The formula of calculating Quick Ratio is:
Quick AssetsCurrent Liabilities
Where the quick assets indicates the highly liquidity assets that can be immediately convertible to cash, such as Accounts Receivable and cash, etc. As a rule of thumb, Quick Ratio lower than 1 is a danger signal of the company’s financial liquidity.
Table 3 Quick Ratio VC
| VC | 2011 | 2012 | 2013 | 2014 | 2015 |
| Quick Ratio | 1.48 | 1.60 | 1.26 | 1.26 | 1.13 |
Table 3 Quick Ratio VC shows a continuous declining in Quick Ratio of VC, which indicates the liquidity of financing keeps weakening. In financial year 2015, the Quick Ratio of the company is 1.13, which will possibly fall below 0 by the trend. It is a danger signal for the company’s financial liquidity.
However, if compare the Quick Ratio of VC with the figure of Autoneum in 2015 (0.99), the results still shows a relative higher liquidity.
Conclusion Liquidity: As a conclusion, VC has a healthy liquidity situation. However, the company still need to pay attention to the liquidity management since the trend of Quick Ratio gives a signal that VC may facing liquidity problems in the future.
Profitability
Profitability measures the company’s ability to generate returns on the resources. The following ratios are used to help analysing the profitability of VC: Return on Sales, Cash Flow Return on Assets and Return on Equity.
Return on Sales (ROS): In order to measure how efficient the company is to generate the profit on sales, the Return on Sales (ROS) is calculated. An increase on Return on Sales indicates that the company is growing more efficient; an decrease on ROS may signal existing financial troubles. The Return on Sales is calculated as follow:
Net income before interest and taxTotal Sales
Table 4 Return on Sales VC
| VC | 2011 | 2012 | 2013 | 2014 | 2015 |
| Return on Sales | 1.94% | 3.96% | 4.88% | 4.16% | 6.66% |
Table 4 Return on Sales VC shows the Return on Sales figures for each year between 2011 and 2015 and the figures indicate an increasing trend, with only 1.94% Returns on 2011 and tripled in 2015 with a rate of 6.66%. The results shows the company is growing more efficient in 5 years’ time. In 2015, Autoneum has Return on Sales of 6.06%, which is slightly lower than VC. The comparison fact means VC has stronger ability of generate profit on sales rather than Autoneum.
Cash Flow Return on Assets: Return on Assets tells financial analyst how well the company manage the assets by calculating how much each unit of currency of assets can generating in earnings. However, the ratio is strong affected by the flowing elements: tax and depreciation regimes, financial structure on equity or debt, goodwill calculation & reporting, etc. In order to get rid of the influence brought by the elements mentioned before, the figure Cash Flow Return on Assets is used to measure the effectiveness of managing assets. The formula of calculating Cash Flow Return on Assets is:
Gross Operating Cash FlowTotal Assets
Table 5 Cash Flow Return on Assets VC
| VC | 2011 | 2012 | 2013 | 2014 | 2015 |
| Cash Flow Return on Assets | 5.68% | 10.47% | 12.49% | 11.34% | 16.82% |
As can be seen from Table 5 Cash Flow Return on Assets VC, the ratio in 2015 (16.82%) is nearly tripled than the figure in 2011 (5.68%). An increasing on the ratio indicates that company’s effectiveness of managing assets has largely increased during the 5-years-period. However, this ratio in 2015 is still slightly lower than its competitor Autoneum (with the figure of 17.18%).
Return on Equity: Return on equity measures a company’s profitability by figuring out how much profit generates with the money the shareholders invested. The ratio is calculated as follow:
Net IncomeShareholders’Equity
Table 6 Return on Equity VC
| VC | 2011 | 2012 | 2013 | 2014 | 2015 |
| Return on Equity | 5.85% | 12.76% | 19.45% | 15.09% | 23.49% |
By looking at the Table 6 Return on Equity VC, the profit generated with the money invested by shareholder keeps growing from 2011 to 2015, and the ratio in 2015 (23.49%) is around four times larger compared to the ratio in 2011 (5.85%).
Return of Equity ratio of Autoneum is 17.28% in 2015, which is lower than VC. We can conclude from the comparison that VC is able to generate more profit than Autoneum, if same investment amounts are implied.
Conclusion Profitability: As can be concluded from the ratios measure the profitability of the company, the profitability of VC keeps growing and have a general relative better performance than its competitor Autoneum.
Safety
Safety here means the company’s vulnerability to the risk. To be more specific here, safety stands for the degree of protection provided for the business debts.
Debt to Equity Ratio: The Debt to Equity Ratio shows how much debt a company is using to finance relative to the amount of value presented in the shareholders equity. The higher the ratio, the greater the risk to the current and future creditors. A Lower figure means company is more financial stable and probably in a better position to borrow money now or in the future. However, an extremely low ratio may indicate that the company is too conservative and are not letting the business realize its potential. The Debt to Equity Ratio is calculated in the formula:
Total LiabilitiesShareholders’Equity
Table 7 Debt to Equity VC
| VC | 2011 | 2012 | 2013 | 2014 | 2015 |
| Debt to Equity | 2.35 | 1.93 | 2.01 | 1.79 | 1.37 |
Table 7 Debt to Equity VC shows a declining on company’s Debt to Equity ratio. Based on the definition, a declining on Debt to Equity ratio indicates that company is becoming more financial stable, and the risk to the current and future creditors is becoming lower as well.
Although the risk is minified in VC, the Debt to Equity ratio is nearly doubled compare to Autoneum in 2015 (with figure of 0.67). However, we cannot directly conclude that the situation of VC’s creditors are much worse than Autoneum, since the extremely low ratio indicates the company may waste of its potential. Industry index on Debt to Equity should be used as standard to draw the conclusion, which is unfortunately unavailable in this analysis.
Interest coverage ratio: Interest coverage ratio is used to determine how easily a company can pay interest on outstanding debt. It measures the margin of safety a company has for paying interest during a given period, which indicates the company’s survivability in the future. Here we use the following formula to calculate the interest coverage ratio:
Earnings Before Interest and TaxInterest expenses
Table 8 Interest Coverage Ratio VC
| VC | 2011 | 2012 | 2013 | 2014 | 2015 |
| Interest Coverage Ratio | 0.642 | 2.741 | 3.832 | 3.682 | 8.084 |
Table 8 Interest Coverage Ratio VC presents a huge increase on the Interest Coverage Ratio from 2011 to 2015, which indicates the safety of paying interest during a given period is significantly improved. Such result leads to a high proportion of survivability for VC in the future.
Conclusion Safety: Both results from Debt to Equity ratio and Interest Coverage ratio indicate that VC keeps reducing the risks and adding protections for the business debts. The safety condition of the company is becoming solid.
Efficiency
This part will analyse how well the company is on managing its assets besides determining the assets value.
Account Receivable Turnover: Account Receivable Turnover measures how many times of accounts receivable is collected during the financial year. The higher the turnover, the faster the company collecting the receivables, which generally indicates more cash on the hand. The Account Receivable Turnover is calculated as follows:
Net SalesAverage Account Receivables
Table 9 Account Receivable Turnover VC
| VC | 2011 | 2012 | 2013 | 2014 | 2015 |
| Account Receivable Turnover | 4.96 | 4.64 | 5.55 | 5.31 | 5.52 |
Table 9 Account Receivable Turnover VC represents a stable trend in receivable turnover, which is fluctuating around 5. Thus, in general, VC collects around 5 or 6 times accounts receivable during each financial year. Autoneum has an Account Receivable Turnover of 8.18 in 2015. The comparison tells us Autoneum collecting the receivables faster than VC.
Accounts Payable Turnover: Accounts Payable Turnover indicates the number of times that the company repays its accounts payable to creditors. A high Accounts Payable Turnover can either means company decides to hold the credit money for a longer time, or shows company has difficulties of paying creditors. The formula of calculating Accounts Payable Turnover is:
Cost of Goods SoldAverage Accounts Payable
Table 10 Account Payable Turnover VC
| VC | 2011 | 2012 | 2013 | 2014 | 2015 |
| Account Payable Turnover | 4.66 | 4.77 | 6.29 | 6.83 | 6.74 |
As can be seen from Table 10 Account Payable Turnover VC, the Account Payable Turnover of VC increases from 4.66 in 2011 to 6.74 in 2015. The increases on the Account Payable Turnover tells us the company decides to hold the credit money for a longer time. Based on the theory that there is also possibilities that the company may have difficulties of paying creditors. However, if we take the liquidity as a reference, VC is in a healthy liquidity situation. Thus the chance of VC has difficulties of paying creditors is relatively low. Therefore, we can conclude that the increase in Accounts Payable Turnover is caused by deciding to hold the credit money for a longer period. Autoneum has a lower Account Payable Turnover in 2015 (4.10) than VC. It means Autoneum is managing to repay its creditor in a shorter period.
Conclusion Efficiency: The calculation of ratios shows VC is managing to collect the money faster and pay the debt slower. In one hand, collecting the money faster from the customers shows the company becomes more efficient on collection of account receivable and has a high proportion of quality customers that pay off their debts quickly. In the other hand, since money in account payable is always regarded as free financing resource, company can benefit by holding the credit money for longer.
5. Conclusion
In this essay the VC company is analysed by looking at the aspects of general information, internal resources, FSAs and core competence, the state of competition in VC’s industry and the company’s financial performance. In terms of financial resources, the company can rely on EUR 5.6 million in consolidated profits, as well as strong R&D expertise upstream, and sales & market knowledge downstream in their supply-chain. Especially the latter two resources can be traced back to VC’s 2008-2009 transition from OES to OEM supplier as these are critical for making the transition a success. Additionally, being a family-owned business provides VC with the long-term planning horizon that it needs to stay focused on sustainable competitiveness. A core competence is identified in the design and production process of their mats enables VC to trump rivals in terms of quality and price
Using Porter’s five forces model to assess VC’s competitive position, it is found that threats of rivalry and new entrants were moderate, threat of substitutes and strength of suppliers low, while the bargaining power of buyers is high. Indeed, dependence on car makers is high for VC and it poses as the main barrier to increasing market share, particularly in Europe.
The result of financial analysis shows that VC has an overall improving financial performance, especially in company’s financial safety aspect. VC keeps reducing the risks and adding protections for the business debts. However, VC should pay additional attention to their liquidity, since the evidence provided by Quick Ratio shows VC may have liquidity risk in the future. Strictly speaking, industry index should be used as a criterion to compare with, in order to give a more accurate analysis results. But due to the limitation of information (since VC and most of its competitors are private companies, their financial figures are not obligate to the public), the performance analysis is not fully representable to the actual financial performance of VC.
6. Bibliography
Anderson, RC. & Reeb, DM. (2003). Founding-family ownership and firm performance: evidence from the S&P 500, The Journal of Finance, vol. 18 (3): pp. 1301-1328.
Barney, JB. (1991). Firm resources and sustained competitive advantage, Journal of Management. vol. 17 (1): pp. 99-120.
Hollensen, S. (2014). Global marketing : A decision-oriented approach (sixth edition), Harlow, England: Pearson.
Nicholson, W. (1998) Microeconomics Theory. The Dryden Press
Oh, CH. & Rugman, AM. (2012) Regional integration and the international strategies of large european firms. International Business Review, vol. 21, (1): pp. 493-507
Penrose, ET. (1959) The theory of the growth of the firm. New York, New York: John Wiley Press.
Porter, M. (1980). Competitive strategy : Techniques for analyzing industries and competitors. New York: Free Press.
Porter, M. (2008). The five competitive forces that shape strategy. Harvard Business Review 86, (1): pp. 78–93.
Prahalad, CK. & Hamel, G. (1990) The core competence of the corporation. Harvard Business Review, vol. 68 (3), pp 79-91.
Stürmer, C. & Lau, S. (2017) Growth Markets: Opportunities and Challenges for the Automotive Industry. PWC.blogs.com. Accessed 17 May 2017. Retrieved from:
http://pwc.blogs.com/growth_markets/2017/02/growth-markets-the-engines-that-drive-the-auto-industry.html
Verbeke, A (2013) International business strategy (second edition), Cambridge, UK: Cambridge University Press.
VC. (2017). Quality. Accessed 16 May 2017. Retrieved from: http://www.VC.nl/language/gb/ref/kwaliteit.html
HP. (2009). HP and Beats set premium standard for music audio on notebooks. Accessed 17 May 2017. Retrieved from: http://www8.hp.com/us/en/hp-news/press-release.html?id=169479#.WRsoLFJg3wc
NYU Stern. (2017). Margins by sector (US). Accessed on 16 May 2017. Retrieved from: http://pages.stern.nyu.edu/~adamodar/New_Home_Page/datafile/margin.html
Virginia Small Business Development Center Network. (2011). Financial Statement Analysis For Small Business: A Resource Guide. Florida.
7. Appendix
Figure 1: International presence of VC
Source: VC.nl
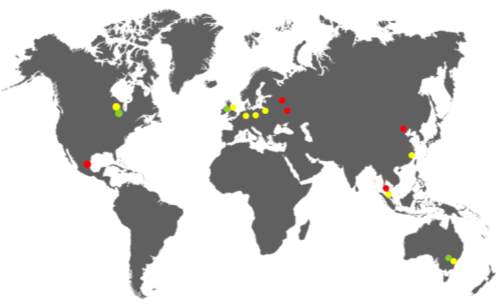
 = Local sales cells
  = Production plants
  = Warehousing
Figure 2: Market Share of Visscher-Caravelle
Source: Visscher-Caravelle Lecture, April 2017, Rijksuniversiteit Groningen
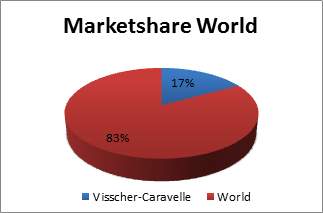
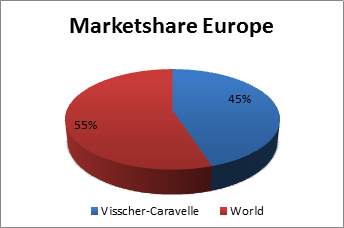
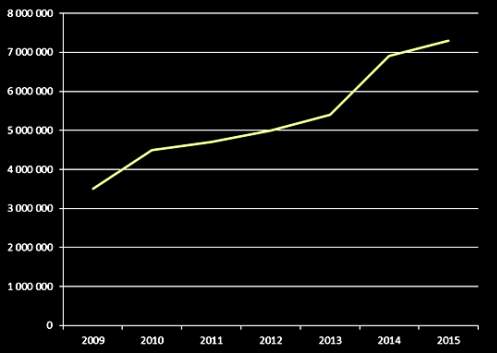
Figure 3: VC Automotive Group total car-mat sales rose from 3.5 to 7 million units, ballooning its regional market share over a 5-year period.
Source: VC lecture, April 2017, Rijksuniversiteit Groningen
Cite This Work
To export a reference to this article please select a referencing stye below:
Related Services
View all


Related Content
All TagsContent relating to: "International Business"
International Business relates to business operations and trading that happen between two or more countries, across national borders. International Business transactions can consist of goods, services, money, and more.
Related Articles

DMCA / Removal Request
If you are the original writer of this dissertation and no longer wish to have your work published on the UKDiss.com website then please: